Keywords
Metabolomics; Nuclear Magnetic Resonance,
Biomolecular; Pancreatitis, Acute Necrotizing; Pancreatitis,
Chronic; Urine
Abbreviations
AP: acute pancreatitis; CP: chronic pancreatitis;
HC: healthy controls; HMDB: Human Metabolome Database;
NMR: nuclear magnetic resonance; PCA: principal component
analysis
INTRODUCTION
Diseases of the pancreas affect greater than 1 million
persons in the United States annually, resulting in
nearly $3 billion in direct and indirect medical costs.
The most prevalent disorder of the pancreas is
pancreatitis. This disease is characterized by
inflammation of the exocrine portion of the pancreas
that secretes digestive enzymes into the duodenum.
Pancreatitis can take two forms, acute and chronic.
Acute pancreatitis begins abruptly and either resolves
or worsens within several days. In contrast, chronic
pancreatitis is a chronic inflammatory disorder with a
protracted disease course developing and progressing
over several years.
Acute pancreatitis is the most common cause of
hospitalization for pancreatic disorders in the United
States and is associated with significant resource
utilization, morbidity and mortality. Recent national
survey data indicate increasing frequency of
hospitalizations (4.6 of every 1,000 hospital
admissions, greater than 200,000 admissions in the
U.S. annually) and costs ($2 billion in direct annual
costs) associated with acute pancreatitis in the United
States [1, 2]. Currently, diagnoses of acute pancreatitis
are made by standard laboratory testing and radiologic
imaging [3]. Severe cases may be associated with
complications such as organ failure, necrosis, and
death; approximately 2% of total acute pancreatitis
attacks are fatal.
Although the exact pathogenesis of chronic pancreatitis
remains to be determined, a variety of etiologic risk
factors have been outlined, including repeated bouts of
acute pancreatitis [4]. Objective features of chronic
pancreatitis, detectable by current diagnostic
radiologic, endoscopic and biochemical studies, are
associated with moderate to advanced stage disease.
However, at these stages, pathological structural and
functional changes are irreversible and only
symptomatic treatment is possible [5, 6]. Furthermore,
the advanced stages of chronic pancreatitis are
associated with diabetes, severe pain, malabsorption of nutrition, and the development of pancreatic cancer.
The prevalence of chronic pancreatitis in industrialized
countries, although frequently misdiagnosed [7] or
neglected [8], is approximately 30 per 100,000
inhabitants [9, 10]. No specific therapy is available to
arrest the acute inflammatory response seen in acute
pancreatitis or to retard the progression of chronic
pancreatitis.
Metabolomics, the systematic, high-throughput
profiling of the host of metabolites in an organism, can
be used to characterize an organism’s metabolic
response to a pathophysiologic state [11]. Nuclear
magnetic resonance (NMR) spectroscopy-based
approaches are well-suited for high-throughput studies,
offering the ability to profile a wide range of
metabolites in a single spectrum with minimal sample
preparation [12, 13]. Such studies are commonly used
to identify biomarkers or sets of biomarkers of disease
[14, 15, 16].
The characterization of the metabolic response in
pancreatitis is a potentially useful strategy to determine
the effects of pancreatic injury in both chronic and
acute pancreatitis. Improved understanding of the
metabolic consequences of these diseases may yield
non-invasive diagnostic biomarkers and therapeutic
targets. To that end, we performed a pilot study to
determine if differences could be detected among
NMR-based urinary metabolic profiles of patients with
chronic pancreatitis, acute pancreatitis, and healthy
controls.
METHODS
Study Population
The study population comprised adult patients referred
to the Center for Pancreatic Disease at Brigham and
Women’s Hospital in Boston, MA, USA for evaluation
of abdominal pain, and healthy adult volunteers with
no pancreatic disease or risk factors for pancreatic
disease. Three cohorts were studied: inpatients with
mild acute pancreatitis (AP, n=5), outpatients with
chronic pancreatitis (CP, n=5), and healthy controls
(HC, n=5).
Urine Collection
Clean-catch urine was collected for all subjects.
Second void of the day urine was collected using the
clean-catch method for acute and chronic pancreatitis
patients. Healthy control and chronic pancreatitis
collections were done in the outpatient setting. Acute
pancreatitis samples were collected within 48 hours of
admission. All urine was promptly aliquoted and stored
at -80°C until analysis.
Urine Sample Processing
Urine samples were thawed at the time of preparation
for NMR analysis. One mL of thawed urine was mixed
with 0.5 mL of 0.2 M sodium phosphate buffer
prepared with D2O to control pH. The mixture was placed on ice for 10 minutes and then centrifuged at
7,000 g for 10 minutes. A total of 500 mL of the
supernatant was withdrawn and combined with 50 mL
of the internal standard 3-(trimethylsilyl)propionic acid
(TSP, Sigma-Aldrich, St. Louis, MO, USA) to a
concentration of 1 mM [17]. The internal standard and
buffer were prepared with D2O to provide a lock for the
NMR signal. The pH of the final solution was recorded
and the mixture was transferred to separate 5 mm NMR
tubes (Wilmad, LabGlass, Vineland, NJ, USA).
Nuclear Magnetic Resonance (NMR) Spectroscopy
Proton NMR spectra were collected with a Bruker
Avance spectrometer with autosampler and 5 mm triple
resonance 1H/13C/15N TXI CryoProbe with Zgradient,
running TopSpin v. 2.16 (Bruker BioSpin,
Fremont, CA, USA) at 700.13 MHz. A 1D NOESY
(nuclear Overhauser effect spectroscopy) pulse
sequence was used. The 90° pulse width was calibrated
for each sample, and was generally 12-13 ms. The
relaxation time was defined by each sample’s 90° pulse
width. The relaxation delay was 2 s, the acquisition
time was 3 s, the spectral width was 10 kHz, the total
number of data points collected was 63,000, and the
number of transients collected was 128, for a total
experiment time of 11 minutes and 17 seconds. During
the relaxation period, the water resonance was
presaturated. All spectra were collected at a
temperature of 298 °K. Line broadening at 0.5 Hz was
applied before fast Fourier transform (FFT);
autophasing and auto-baseline correction were applied
by TopSpin.
Chenomx software (Edmonton, AB, Canada) [18] was
used to identify and quantify a portion of the
metabolites present in each urine sample. Fine manual
phasing and baseline corrections and the software’s
Reference Deconvolution algorithm was applied to
each spectrum before targeted profiling of the
metabolites was performed. Sixty metabolites were fit
in each urine sample in this study, resulting in a profile
containing the concentration of each identified
metabolite in millimoles per liter (mM). The
metabolomic profiles containing the urine
concentrations were then normalized using the
probabilistic quotient method [19, 20] to correct for
differences in dilution among samples.
ETHICS
Informed consent was given by all patients and healthy
controls enrolled in this study. This protocol was
approved by the Institutional Review Board at Brigham
and Women’s Hospital (BWH; IRB #2007-P-
002480/1). The study protocol conforms to the ethical
guidelines of the “World Medical Association (WMA)
Declaration of Helsinki - Ethical Principles for Medical
Research Involving Human Subjects” adopted by the
18th WMA General Assembly, Helsinki, Finland, June
1964 and amended by the 59th WMA General
Assembly, Seoul, South Korea, October 2008.
STATISTICS
Data are reported as mean and range or mean ±
standard deviation (SD). Significant urinary
metabolites according to the three groups (acute
pancreatitis, chronic pancreatitis, healthy control) were
identified by Kruskal-Wallis test. Differences between
metabolite concentrations were assessed with post-hoc
Wilcoxon rank-sum tests with Bonferroni correction to
accommodate the small sample size. These results were then validated with random permutations. All statistical
tests were done with R software (R Foundation for
Statistical Computing, https://cran.r-project.org/) [21]. R
software was also used to generate a principal
component analysis model with respect to patient
group, and to create boxplots of profiled metabolites
(Supplementary Figure).
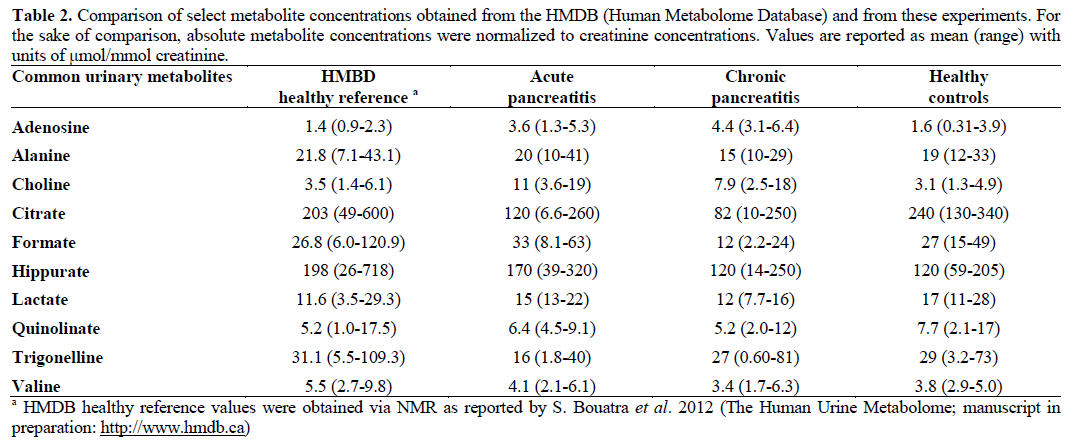
To check for consistency, absolute metabolite
concentrations were normalized to creatinine and
compared to values reported in the Human Metabolome Database (HMDB; https://www.hmdb.ca)
[22]. Values obtained herein were compared to those
also obtained by NMR as reported in HMDB entries
(S. Bouatra et al., 2012, The Human Urine
Metabolome; manuscript in preparation:
https://www.hmdb.ca).
RESULTS
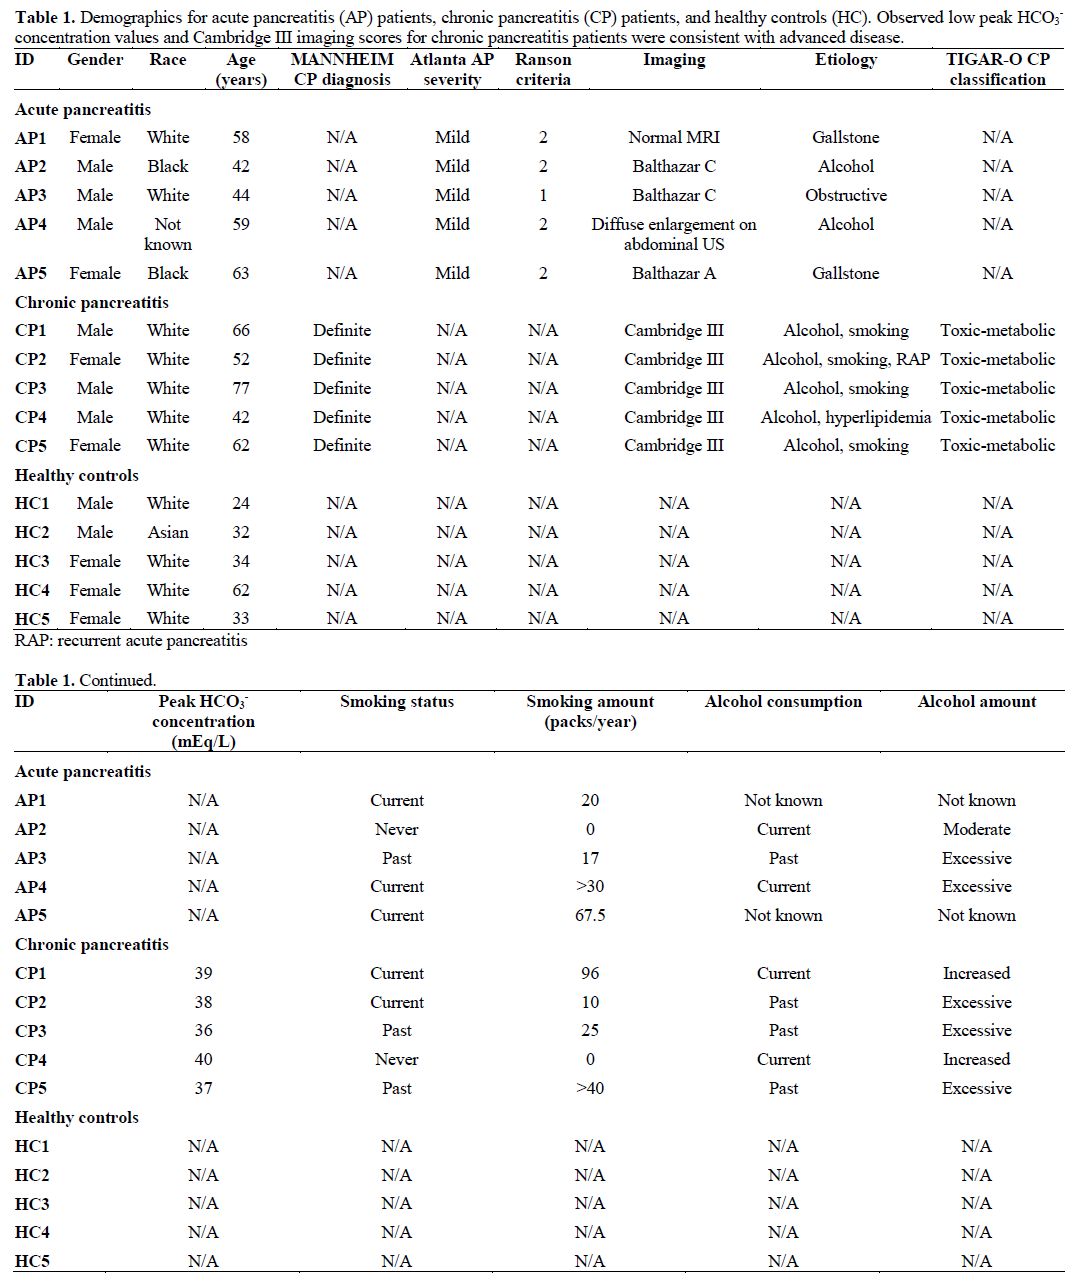
Patient characteristics are listed in Table 1. All of the
patients with chronic pancreatitis had alcohol
consumption as a related factor and half of the patients
with acute pancreatitis had alcohol consumption as a
related factor. Peak HCO3- concentrations were
obtained from i.v. secretin-stimulated endoscopic
pancreatic function tests (ePFT) [23]. Accepted normal
values are greater than 75 mEq/L [24]. The observed
low peak HCO3- concentration values and Cambridge
III imaging scores for chronic pancreatitis patients
were consistent with advanced disease.
Nuclear Magnetic Resonance (NMR) Spectroscopy
Identified Metabolites in the Urine of all Three
Cohorts
Sixty metabolites were identified and quantified in the
urine. Urea was subsequently omitted from the data set
because its protons are in exchange with water and the
signal is compromised by water suppression. Boxplots
of the remaining 59 metabolites and their averages and
standard deviations are reported in the Supplementary
Table and Figure. Concentrations of a subset of
metabolites identified here are compared with those
reported in the Human Metabolome Database in Table
2 and demonstrate that the results of this study are
comparable to known concentration ranges.
Of the 59 metabolites analyzed in this study, five were
found to differ significantly among the three groups by
Kruskal-Wallis test: acetone, adenosine, citrate, ribose,
and 3-indoxylsulfate. These five metabolites were then
subjected to pairwise Wilcoxon rank-sum tests with
Bonferroni correction in a post-hoc evaluation (Table
3). Validation by random permutation confirmed that
of these, only citrate and adenosine were significantly different among the groups. Citrate and adenosine
concentrations in each of the groups are shown in Figure 1. Urinary citrate concentrations in healthy
controls were greater than those in chronic pancreatitis
patients (P=0.019, validation by random permutation).
Conversely, urinary adenosine concentrations were
lower in healthy controls than in chronic pancreatitis
patients (P=0.026, validation by random permutation).
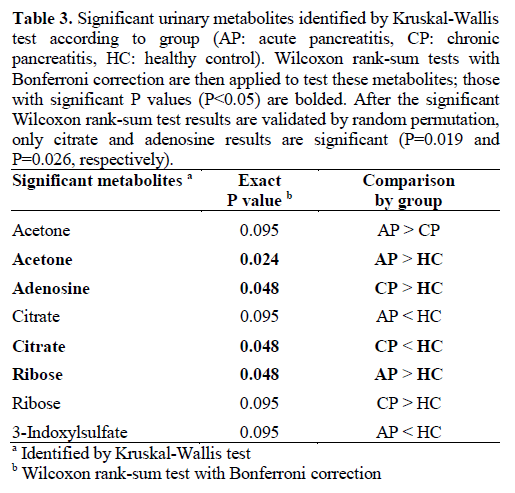
Figure 1. Boxplots depict concentrations of two significant
metabolites identified after Wilcoxon rank-sum tests and validation
by random permutation. Data are reported in μmol/L (normalized).
Citrate (left) concentration was significantly lower in chronic
pancreatitis (CP) patients compared to healthy controls (* P=0.019).
Adenosine (right) concentration was significantly higher in chronic
pancreatitis patients compared to healthy controls (** P=0.026). The
box covers the first (Q1) and third (Q3) quartile of the data. The line
in the box represents the median value. The whiskers extend to ±1.5
interquartile range (IQR), where IQR=Q3-Q1. Outliers are shown as
points.
Principal Component Analysis Revealed Separation
Between Healthy Controls and Pancreatitis Patients
Principal component analysis (PCA) was used to model
the metabolic profiles according to group (chronic
pancreatitis, acute pancreatitis, or healthy control). The
first three components collectively explain 41% of the
variance in the data (PC1=16%, PC2=13%,
PC3=12%). Examination of the three-dimensional
scores plot (Figure 2) showed that the control urine
samples in green were generally separated from the
urine samples obtained from pancreatitis patients. PCA
demonstrated no separation between chronic pancreatitis and acute pancreatitis urine samples. The
loadings plot (Figure 3) demonstrated the contribution
of each of the metabolites to the model; citrate and
adenosine are highlighted in blue. Though there is little
pattern in the distribution of the metabolites, it is clear that citrate and adenosine lie far from each other in the
loadings.
Figure 2. Principal component (PC) scores plot of urinary metabolic
profiles shows acute pancreatitis (AP: black), chronic pancreatitis
(CP: red), and healthy control (HC: green) urine samples in three
dimensions. Separation of the healthy control urine samples from
acute pancreatitis and chronic pancreatitis samples is observed. No
separation in acute pancreatitis and chronic pancreatitis urine
samples is observed.
Figure 3. Principal component (PC) loadings plot of urinary
metabolic profiles shows the influence of the metabolites on the
scores. It can be seen that citrate and adenosine (boxed) are wellseparated
in the model.
DISCUSSION
This pilot study demonstrates that the urinary
metabolome can be used to differentiate patients with
acute or chronic pancreatitis from healthy controls.
Although only two potential biomarkers were
identified, establishing the utility of this methodology
is important for future metabolomic studies of
pancreatic disease.
Of five identified metabolites that differed significantly
among groups by Kruskal-Wallis test, four remained
significant after evaluation by Wilcoxon rank-sum tests
with Bonferroni correction (acetone, adenosine, citrate,
ribose). Of these metabolites, only adenosine and
citrate survived validation by random permutation.
These two metabolites could reasonably be expected to
differ among pancreatitis patients and healthy controls.
Citrate is known to be a significant component of
pancreatic secretions [25]. Given that alcohol use or
abuse has been associated with a decrease in citrate in
pancreatic secretions [26], it is notable that most
patients in the chronic pancreatitis and acute
pancreatitis groups reported some form of regular
alcohol consumption (Table 1). The decreased urinary
citrate in the pancreatitis cohorts compared to healthy
subjects may be associated with decreased citrate in
pancreatic secretions due to alcohol metabolism. This
weakens citrate’s candidacy as a biomarker of
pancreatitis considerably, as the observed differences
are potentially confounded by alcohol consumption.
Still, future studies controlling for alcohol consumption
may support citrate as a urinary biomarker of
pancreatitis. Other etiologies of low urinary citrate include metabolic acidosis, potassium depletion, and
acetazolamide [27, 28]. These conditions do not appear
to be relevant in the population studied here.
Adenosine may prove to be a better marker of pancreas
disease since it possesses known anti-inflammatory
properties [29]. However, adenosine as a marker of
inflammation is unlikely to be specific to pancreatitis
[30], thus limiting its utility as a biomarker if not
validated in further studies. While urinary adenosine
concentrations may vary with changes in extracellular
adenosine [31], variation in urinary adenosine
concentration is known to be low in humans, and is
unaffected by sodium content or changes in fluid
homeostasis [32]. This implies that renal handling of
adenosine does not further confound our results.
As suggested above, this study has several limitations,
which may be attributed to small sample size. We
attempted to minimize the effects of sample size on the
statistical analysis of the data by using Kruskal-Wallis
global test, followed by Wilcoxon rank-sum tests with
Bonferroni correction and validation by random
permutation. We also chose to use PCA, an
unsupervised multivariate analysis technique, instead
of a supervised technique. Supervised analyses such as
partial least squares discriminant analysis (PLS-DA)
are common in large metabolomics studies, but are
inappropriate for small studies such as this.
Additionally, we have not accounted for all
confounding variables. As discussed, citrate’s
relationship to alcohol consumption compromises its
usefulness as a biomarker of pancreatitis. Other factors
such as age, differences in liver function, and dietary
status likely exist among the patients providing
samples. Furthermore, the possibility of differences
among patient populations, etiology, and disease
severity inducing variations in metabolomes presents
an additional challenge. A larger study of the urine,
serum, and pancreas fluid metabolomes with welldefined
patient enrollment criteria, controlling for age,
disease severity, and etiology of pancreatitis will
account for confounding factors. This would result in a
higher proportion of variance explained in the PCA
model. A larger study with better-defined cohorts
would also allow for partial least squares discriminant
analysis modeling. We are currently performing a
larger metabolomics study of ERCP-induced
pancreatitis that will address many of these issues.
Our study demonstrates that metabolomics techniques
are capable of distinguishing urine samples obtained
from pancreatitis patients and from those obtained from
healthy controls. This is a novel, non-invasive
technique that can provide insight into the metabolic
states of patients with chronic and acute pancreatitis.
The significant increase in urinary adenosine and
decrease in urinary citrate among pancreatitis patients
compared to healthy controls may have reflected the
patients’ inflammatory state and alcohol consumption,
and as such, validation studies will have to be
performed. Although we cannot definitively conclude
that these metabolites are biomarkers of pancreatitis, further analyses with larger cohorts will refine our
results and define their diagnostic utility. The
methodology described here presents a definitive
strategy upon which further analyses with larger
cohorts can be tested.
Financial support
None
Conflicts of interest
None
References
- Fagenholz PJ, Castillo CFD, Harris NS, Pelletier AJ, Camargo CA. Increasing United States hospital admissions for acute pancreatitis, 1988–2003. Ann Epidemiol. 2007; 17(7):491-497. [PMID: 1744682]
- Fagenholz PJ, Fernández-del Castillo C, Harris NS, Pelletier AJ, Camargo CA. National study of united states emergency department visits for acute pancreatitis, 1993–2003. BMC emergency medicine. 2007; 7(1):1. [PMID: 17241461]
- Cappell MS. Acute pancreatitis: Etiology, clinical presentation, diagnosis, and therapy. Med Clin North Am. 2008; 92(4):889-923. [PMID: 18570947]
- Etemad B, Whitcomb DC. Chronic pancreatitis: Diagnosis, classification, and new genetic developments. Gastroenterology 2001; 120(3):682-707. [PMID: 1179244]
- Warshaw AL, Banks PA, Fernāndez-del Castillo C. AGA technical review: Treatment of pain in chronic pancreatitis. Gastroenterology 1998; 115(3):765-776. [PMID: 9721175]
- Witt H, Apte MV, Keim V, Wilson JS. Chronic pancreatitis: Challenges and advances in pathogenesis, genetics, diagnosis, and therapy. Gastroenterology 2007; 132(4):1557-1573. [PMID: 17466744]
- Flasar MH, Goldberg E. Acute abdominal pain. Med Clin North Am 2006; 90(3):481-504. [PMID: 16473101]
- Lankisch P. The problem of diagnosing chronic pancreatitis. Dig Liver Dis 2003; 35(3):131-134. [PMID: 12779064]
- Otsuki M. Chronic pancreatitis in japan: Epidemiology, prognosis, diagnostic criteria, and future problems. J Gastroenterol 2003; 38(4):315-326. [PMID: 127437700]
- Whitcomb DC, Yadav D, Adam S, et al. Multicenter approach to recurrent acute and chronic pancreatitis in the United States: The North American pancreatitis study 2 (NAPS2). Pancreatology 2008; 8(4-5):520-531. [PMID: 18765957]
- Fiehn O. Metabolomics–the link between genotypes and phenotypes. Plant Mol Biol 2002; 48(1):155-171. [PMID: 11860207]
- Nicholson JK, Lindon JC, Holmes E. ‘Metabonomics’: Understanding the metabolic responses of living systems to pathophysiological stimuli via multivariate statistical analysis of biological NMR spectroscopic data. Xenobiotica 1999; 29(11):1181- 1189. [PMID: 10598751]
- Madsen R, Lundstedt T, Trygg J. Chemometrics in metabolomics--A review in human disease diagnosis. Anal Chim Acta. 2010; 659(1-2):23-33. [PMID: 20103103]
- Sreekumar A, Poisson LM, Rajendiran TM, et al. Metabolomic profiles delineate potential role for sarcosine in prostate cancer progression. Nature 2009; 457(7231):910-914. [PMID: 19212411]
- Spratlin JL, Serkova NJ, Eckhardt SG. Clinical applications of metabolomics in oncology: A review. Clin Cancer Res 2009; 15(2):431-40. [PMID: 19147747]
- Carraro S, Rezzi S, Reniero F, et al. Metabolomics applied to exhaled breath condensate in childhood asthma. Am J Respir Crit Care Med 2007; 175(10):986-90. [PMID: 17303796]
- Mortishire-Smith RJ, Skiles GL, Lawrence JW, et al. Use of metabonomics to identify impaired fatty acid metabolism as the mechanism of a drug-induced toxicity. Chem Res Toxicol 2004; 17(2):165-173. [PMID: 14967004]
- Weljie AM, Newton J, Mercier P, Carlson E, Slupsky CM. Targeted profiling: Quantitative analysis of 1H NMR metabolomics data. Anal Chem 2006; 78(13):4430-4442. [PMID: 16808451]
- Dieterle F, Ross A, Schlotterbeck G, Senn H. Probabilistic quotient normalization as robust method to account for dilution of complex biological mixtures. application in 1H NMR metabonomics. Anal Chem 2006; 78(13):4281-4290. [PMID: 16808434]
- Lusczek ER, Nelson T, Lexcen D, Witowski NE, Mulier KE, Beilman G. Urine metabolomics in hemorrhagic shock: Normalization of urine in the face of changing intravascular fluid volume and perturbations in metabolism. J Bioanal Biomed. 2011; 3:038-048.
- R Development Core Team. R: A Language and Environment for Statistical Computing. R Foundation for Statistical Computing Vienna Austria. 2010; https://cran.r-project.org/.
- Wishart DS, Knox C, Guo AC, et al. HMDB: A knowledgebase for the human metabolome. Nucleic Acids Res. 2009; 37(suppl 1):D603-D610. [PMID: 18953024]
- Wu B, Conwell DL. The endoscopic pancreatic function test. Am J Gastroenterol. 2009; 104(10):2381-2383. [PMID: 19806083]
- Stevens T, Conwell DL, Zuccaro G, Lewis SA, Love TE. The efficiency of endoscopic pancreatic function testing is optimized using duodenal aspirates at 30 and 45 minutes after intravenous secretin. Am J Gastroenterol. 2007; 102(2):297-301. [PMID: 17100964]
- Boustière C, Sarles H, Lohse J, Durbec J, Sahel J. Citrate and calcium secretion in the pure human pancreatic juice of alcoholic and nonalcoholic men and of chronic pancreatitis patients. Digestion 1985; 32(1):1-9. [PMID: 4018438]
- Sarles H, Bernard J, Johnson C. Pathogenesis and epidemiology of chronic pancreatitis. Annu Rev Med 1989; 40(1):453-468. [PMID: 2658760]
- Simpson D. Citrate excretion: A window on renal metabolism. American Journal of Physiology-Renal Physiology. 1983; 244(3):F223-F234. [PMID: 6338740]
- Hamm LL. Renal handling of citrate. Kidney Int. 1990; 38(4):728-735. [PMID: 2332510]
- Noji T, Nan-ya K, Mizutani M, et al. KF24345, an adenosine uptake inhibitor, ameliorates the severity and mortality of lethal acute pancreatitis via endogenous adenosine in mice. Eur J Pharmacol 2002; 454(1):85-93. [PMID: 12409009]
- Bours M, Swennen E, Di Virgilio F, Cronstein B, Dagnelie P. Adenosine 5′-triphosphate and adenosine as endogenous signaling molecules in immunity and inflammation. Pharmacol Ther 2006; 112(2):358-404. [PMID: 1678477]
- Thompson CI, Sparks HV, Spielman WS. Renal handling and production of plasma and urinary adenosine. American Journal of Physiology-Renal Physiology. 1985; 248(4):F545-F551. [PMID: 3985162]
- Heyne N, Benöhr P, Mühlbauer B, Delabar U, Risler T, Osswald H. Regulation of renal adenosine excretion in humans—role of sodium and fluid homeostasis. Nephrology Dialysis Transplantation. 2004; 19(11):2737-2741. [PMID: 15385638]