Research Article - (2025) Volume 12, Issue 1
Structural and Mineral Exploration in the North-Central Part of Nigeria Using Airborne Magnetic Data
JM Sawuta1*,
AU Sadiq1,
EE Udensi2,
AA Adetona2,
CI Unuevho1,
AA El-Mansur2,
MA Nyabam1 and
OS Ayanninuola3
1Centre for Satellite Technology and Development (CSTD), National Space Research and Development Agency, Airport Road, Abuja, Nigeria
2Department of Physics, Federal University of Technology, Minna, Nigeria
3Department of Physics, Nasarawa State University, Keffi, Nigeria
*Correspondence:
JM Sawuta, Centre for Satellite Technology and Development (CSTD), National Space Research and Development Agency, Airport Road, Abuja,
Nigeria,
Email:
Received: 27-Jul-2023, Manuscript No. IPIAS-23-17137;
Editor assigned: 31-Jul-2023, Pre QC No. IPIAS-23-17137 (PQ);
Reviewed: 14-Aug-2023, QC No. IPIAS-23-17137;
Revised: 10-Jan-2025, Manuscript No. IPIAS-23-17137 (R);
Published:
17-Jan-2025, DOI: 10.36648/2394-9988.12.1.56
Abstract
Aeromagnetic data was analysed and used to delineate the structural features. These structural features include; lineaments, faults and folds which are channels for the accumulation of solid minerals were delineated with a trend of NE, NW, and SW direction. In delineating these structural features, some enhancement techniques such as first and second vertical derivative filters, Tilt derivative filter, analytical signal and CET were employed to enhance the structural features. The Residual Magnetic Intensity (RMI) map showed regions of different magnetic concentration which correspond to different lithology and depth of source rock with magnetic values range from -93.5 nT to 95.4 nT. The high magnetic signature occupied mostly the north-eastern and south- western part, corresponding to Akwanga, N/Eggon Keffi, Garaku and others. The extreme south-eastern part of the map which is the sedimentary region has low magnetic intensity. The residual and derivatives filters showed that most part of the area is characterized by a mixture of low and high magnetic closure of short wavelength that are high in frequency of occurrence. Few areas with relative sedimentation are denoted with averagely long wavelength. The analysis of the vertical derivatives maps and CET revealed fault zones, lineaments, and intrusions. These lineaments trend in the NW-SW direction while the fault lines trend mostly in the NE-SW and E-W directions. The analytical signal showed amplitude range of -0.01-0.110 nT/m. Most of the lineaments, faults and intrusions observed in the map have high analytical signal. Low analytical signal was observed on the sedimentary region. Generally, the structures observed from the magnetics maps agree with the geology map of the study area.
Keywords
Basement; Structures; Spectral; Airborne magnetics; Lineaments
Introduction
Nasarawa state is endowed with abundant mineral resources and it has contributed enormously to the state revenue streams with socioeconomic benefits. Mineral resources are essential source of wealth for a nation but before harnessing, they must pass through stages of exploration, mining and processing. The search for mineral deposits has been a major business challenge in Nigeria since the pre-colonial era. The bedrock of Nigeria’s economy before the discovery of oil had been the solid minerals and agricultural sectors, but currently, it is the oil and gas sector [1]. Magnetic method of geophysical exploration is widely used to infer subsurface geologic features by observing variations in the Earth’s magnetic field arising from contrasts in total magnetization of the crust. This method has traditionally been focused on mapping igneous rocks, metamorphic rocks and structures related to them, because these rocks commonly have high total magnetization. The role of aeromagnetic method in mineral exploration varies from delineation of structures like faults, folds, contacts, shear zones and intrusions to automated detection of porphyry and favorable areas of ore deposits and the structures play important roles in the localization of mineralization. Various enhancement techniques could be used. These include Vertical and Horizontal gradient magnitude “HGM”, Tilt derivative “TDR” Miller and Singh. In addition, there are automated methods that can locate porphyry magnetic signatures and delineate lineaments that used to identify favorable areas of ore deposits [2,3]. The three major geological components that makeup the geology of Nigeria, namely, basement complex, younger granites and sedimentary rocks are all pronounced in the study area. All known minerals that occur in the Nigerian geological environments have re-mineralized in the study area [4]. The rocks in the study area are the host to Gold in Wamba; Baryte at Azara, Wuse and Aloshi; Coals (of the highest rank in Nigeria) at Obi, Jangerigeri, Jangwa and Shankodi; Tantalite at Afu, Udege Beki, and Wamba; Gemstone in Keffi; Nasarawa Eggon and Kokona; Salt deposits in Ribi, Keana and Awe; Limestone deposits at Adudu, and Jangwa; at Keffi, Akwanga, Nasarawa Eggon, Tudu Uku, etc.
Location and Geology of the Study Area
The study area is bounded by latitudes 08.00’N to 9.00’N and longitudes 07.30’E to 09.00’E located within the basement complex and parts of the middle benue trough of north central Nigeria [5]. The study area covers parts of Nasarawa states and its environs, it is approximately 18,150 km2 and covered by six (6) airborne magnetic and radiometric maps which includes sheets 208. 209, 210, 229, 230, and 231 for Keffi, Akwanga, Wamba, Udegi, Doma, and Lafia respectively (Figure 1).

Figure 1: Map of the study area showing towns, minor and major roads and state boundary.
The accessibility of the area is very good with major roads such as the Keffi-Abuja expressway, Keffi-Abaji-Lokoja express way, Keffi-Kaduna express way, Lafia Makurdi express way and Akwanga Jos express way as well as a railway line that traversed almost throughout the length of the area from north to south [6]. The vegetation and climatic conditions in the area are typical of the Guinea Savannah.
The geology of the area comprises of both Basement Complex and sedimentary basins of the North-central and middle Benue trough of Nigeria (Figure 2). It comprises rocks of the basement complex which includes; migmatite-gneiss, Schist, Porphyrite granite, banded genis/Biotite gneiss, medium to coarse grain biotite, undifferentiated granite, migmatite and granite gneiss and undifferentiated schist including phyllites. The sedimentary basin is made of shale, sandstones of the Eze-aku group, shale and mudstones of Nkporo formation, sand, clay and quartzite. The rocks of the study area have undergone various episodes of deformation and have ages ranging from Precambrian to Pan African.

Figure 2:Geological map of the study area, modified from NGSA (2006).
Materials and Methods
Both the aeromagnetic datasets were obtained from the Nigerian Geological Survey Agency (NGSA) in digitized form. The data sets were from the new high-resolution airborne survey coverage in Nigeria carried out by Fugro airborne surveys between 2006 and 2009 for the Nigerian geological survey agency [7]. The aeromagnetic surveys were flown along a series of NW-SE flight lines, spaced 500 m, with 2000 m tie-line spacing in a NE-SW direction and 80 m nominal flight height. The data were recorded at 0.1 second interval. It consists of six square map sheets: 208 (Keffi), 209 (Akwanga), 210 (Wamba), 229 (Udege), 230 (Doma), and 231 (Lafia). Each square block represents a map on the scale of 1:100,000 and is (55 × 55) km2 covering an area of 3,025 km2, hence the study area is 18, 150 km2. All magnetic data corrections were carried out by Fugro airborne surveys. The geomagnetic gradient was removed from the aeromagnetic data using the January 2005 International Geomagnetic Reference Field (IGRF) model referenced to the World geodetic system, 1984 ellipsoid. The aeromagnetic data were geo-referenced to the Universal Transverse Mercator (UTM) coordinate system for comparative study with geologic map of the study area. Acquisition, processing and compilation of the high-resolution aeromagnetic data were jointly financed by the Federal government of Nigeria and the World Bank as part of the Sustainability Management for Mineral Resources Project (SMMRP) in Nigeria [8].
The first step in the present study is to assemble the nine aeromagnetic maps covering the survey area to form a composite map (Figure 3).

Figure 3: The composite aeromagnetic map.
The initial stages of quantitative magnetic data interpretation involved the application of mathematical filters (first vertical derivative and horizontal derivative) to observed data. The specific goals of these filters vary, depending on the situation. The general purpose is to enhance anomalies of interest and to gain some basic information on source location or magnetization [9]. A derivative helped to sharpen the edges of anomaly and enhance shallow features. This includes first and second vertical derivatives, and horizontal derivative. Computation of the first vertical derivative in an aeromagnetic survey is equivalent to observing the vertical gradient with a magnetic gradiometer with advantages of sharpening the edges of magnetic.
Methods and Procedures to Analyze Magnetic Data
Aeromagnetic data sheets were acquired, assembled, and interpreted. The procedures involved are;
• Production of Total Magnetic Intensity (TMI) map of the study area using MONTAJ software.
• Perform vertical derivative of the TMI data to enhance shallow geological features and horizontal derivative to identify geology boundaries in the profile data.
• Production structural map of the study area from derivatives maps.
• Tilt and analytical signal maps.
Vertical Derivative Filters
Vertical derivative filters is commonly applied to total magnetic field data to enhance the shallowest geological source and can be calculated either in space or frequency domain. The enhancement sharpens anomalies over bodies and tends to reduce anomaly complexity, allowing a clearer imaging of a causing structure. The transformation can be noisy since it will amplify short wavelength noise [10]. First vertical derivative data have become almost a basic necessity in magnetic interpretation projects. The second vertical derivatives have more resolving power than the first vertical derivatives and it is computed using equation 1.
L(r) = rn (1)
Where, n=order of differentiation.
Analytic Signal
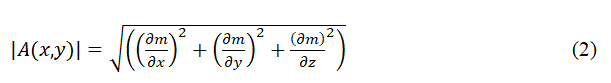
Analytical signal of TMI has much lower sensitivity to the inclination of the geomagnetic field than the original TMI data, and provides a means to analyze low latitude magnetic fields without the concerns of the RTP operator [11]. Analytical signal is a popular gradient enhancement, which is related to magnetic fields by the derivatives. Roest et al., showed that the amplitude of the analytic signal can be derived from the three orthogonal gradients of the total magnetic field using the expression in equation 2:

Where A(x,y) is the amplitude of the analytical signal at (x,y) and m is the observed magnetic anomaly at (x,y), while this function is not a measurable parameter, it is extremely interesting in the context of interpretation, as it is completely independent of the direction of magnetisation and the direction of the Earth's field. This means that all bodies with the same geometry have the same analytic signal. Analytic signal maps and images are useful as a type of reduction to the pole, as they are not subject to the instability that occurs in transformations of magnetic fields from low magnetic latitudes [12]. They also define source positions regardless of any remnant magnetization in the sources.
Tilt Angle Derivative
Since the amplitude of magnetic signature depends on magnetic field strength and to some extent the depth of magnetic sources, lower amplitude signature may be suppressed at the expense of higher amplitudes. For this reason, the edge-detection filters area normally applied for delineating linear features without necessary diminishing the long-wavelength anomalies Oruc and Selim. The tilt derivative filter, TDR (a very good edge-detection filter) brings out short wavelength and reveals the presence of magnetic lineaments.
Verduzco et al., showed in his work that tilt derivative filter also performs an Automatic-Gain-Control (AGC) filter which tends to equalize the response from both weak and strong anomalies. Hence, the filter provides an effective way to trace out along striking anomalies. The tilt angle is defined as equation 3.
Where f is the magnetic or gravity field.
The gradient of the tilt angle has some interesting properties. It is a dimensionless ratio but it responds equally well to shallow and deep sources and to a large dynamic range of amplitudes for sources at the same level. The tilt angle is positive when over the source, passes through zero when over, or near, the edge where the vertical derivative is zero and the horizontal derivative is a maximum and is negative outside the source region. The TDR values are restricted to values between −π/2 and +π/2 and is much simpler to interpret.
Results and Discussion
Interpretation of Magnetic Data
The results from the airborne magnetic dataset are presented and discussed. The data generated high resolution images that show major lithology and structural features that may be present in the study area. Interpretation of these images was carried out visually to identify the individual lithology and delineate geological structures [13].
The Total Magnetic Intensity Map (TMI)
The Total Magnetic Intensity Map (Figure 4) is characterized by composite patterns of Highs (H) and Lows (L) magnetic signatures corresponding with the digital elevation map (Figure 5). Positive and negative anomalies which carried different shapes and sizes with magnetic intensities ranges from 31943.3 nT to 32111.5 nT.

Figure 4: TMI map of the study area.

Figure 5: DEM of the area.
The TMI map depicts low magnetic intensity signatures represented by green-blue colour with magnetic values ranges from 31943.3 nT to 32036.6 nT, medium magnetic intensity signatures represented by yellow-orange colour has magnetic values ranges from 32039.5 nT to 32059.4 nT and areas of high magnetic intensity signatures indicated as redpink colour has magnetic values ranged from 32061.8 nT to 32111.5 nT. The low magnetics values around Lafia, Doma, Adogi, Keana, Shabu, Gofa Akum, Loko, Torkura and others depicts rocks with low magnetic concentration while the high magnetics values around the norther parts depicts rocks with high magnetic concentration found around Akwanga, N/ Eggon, Wamba, Nasarawa Eggon, Keffi, Gunduma, Tudun Wada, Garaku, Dari and others.
The high magnetic signatures in the northern parts suggest the presence of basement rocks with high magnetics susceptibility which correspond with the geology map in Figure 1 while the presence of low magnetic signatures in the southern parts suggests that the rocks have low magnetic susceptibility which correlate with the geology indicating the presence of sedimentary rocks in southern part corresponding with the geology in the study area.
Sedimentary rocks have low magnetic susceptibility and usually give only an insignificant contribution to magnetic anomalies. The high frequency anomalies are concentrated mainly within the NE, NW and SW part of the study area. The high magnetic signatures correspond to regions with high magnetic anomalies which suggest igneous crystalline basement rocks. The basement complex and sedimentary basin of the area are separated by a major demarcation A and A1 and B and B1 running from NE to NE-SW. The existence of these two major geology components corresponds with the geology of the study area (Figure 2). The Magnetic lows signatures were observed majorly around the Lafia-Wukari Formation, Eze-aku Group, Nkporo Formation, and Awgu Formation and they correspond to the region hosting Sandstones, Shale, Siltstone in the study area [14].
The digital elevation map displayed high, H and low, L lands in the study area, the elevation ranges from 67.91 m to 475.46 m with a mean value of 271.69 m. On the average, a greater portion of the area falls within high lands (Figure 5). The high elevations shown at the northwestern part of the area are partly associated with the granitic rocks which form major part of the basement complex of the area that resulted in high magnetic signatures in Figure 4, the relatively low elevations indicated with green color in Figure 4, coincided with the sedimentary component that is made of sand stones, shale, limestone and mudstone.
Residual Magnetic Intensity (RMI) Map
The residual value is obtained by subtracting values of the regional field from the total magnetic value. The residual map shown in Figures 6 and 7.

Figure 6: RMI map of the area.

Figure 7: RMI map of the area (grey).
It is important to note that most extensive works/ interpretations which aimed at bringing features of the field of study by geophysicists are done with the residual maps. The residual magnetic intensity of the study area was discovered to range between 93.5 nT to 95.4 nT. This shows the study area is predominantly area of positive residual anomalies and lesser area of negative residual anomalies. This implies that shallow to near surface magnetized bodies exist in the area having positive residual values. The positive residual anomalies reflect areas of high magnetization while negative residual anomalies reflect areas of low magnetization. It further implies that areas like Lafia, Kadarko, Keana, Amaku, Gidan Rai, Doma, Agyaragu, Gbasan, and Obi with negative residual values between -93.5 nT and -1.3 nT are underlain by deep seated magnetized bodies also corresponding to the sedimentary basin in the region [15]. The existence of the elongated positive anomaly in the southwestern part around Udegi, Udeni, Torkura and Amaku areas with a high amplitude anomaly is associated with igneous intrusion onto the basement surface or within the sedimentary section. The igneous and the granitic rocks are believed to be intruded onto the basement surface or within the sedimentary layer, resulting in the observed magnetic anomaly in the Earth’s main field measured on the surface.
One remarkable observation is the very close resemblance of the residual field map (Figures 6 and 7) and analytic signal map in Figure 8. The fact that the residual anomalies in this study area differ little from the anomalies of the observed total field in Figure 4. At some places on the residual map there are anomalies which are not visually seen on the total magnetic field intensity map, they are present but may have been masked by the strong regional trends.

Figure 8: Analytic signal map of the area.
Analytical Signal Map of the Study Area
The analytic signal map revealed the source position of the magnetic anomaly regardless of direction and remnant magnetization in the sources effect that is mostly associated with the TMI, the analytical signal filter was applied to the TMI grid. The significant characteristic of the Analytical Signal, (AS) is that it is independent of the direction of the magnetization of the source. Moreover, the amplitude of the analytical signal can be related to the amplitude of magnetization. In Figures 6 and 7 the most prominent features are the high analytic signal amplitude that runs in an approximately from North East to North West direction along the Southern border of the area. Three major magnetic zones (high magnetic anomalous zone) define by (H), intermediate magnetic anomalous zone (IM) and low magnetic anomalous zone (L) were delineated. The high magnetic signatures (H) of the analytical map are the volcanic rocks which are found around the North Eastern-North western part of the area and trend in the southern direction.
Areas with high amplitude in the analytic signal map correspond with the rocks type contained in the geology map in Figures 3 and 4 which are considered to have high magnetic and intermediate magnetic signatures caused by the presence of Porphyroblast Gneiss, Migmattie, Banded Gneiss/Biottite Gneiss, Granite Gneiss and undifferentiated schists including Phyllites. The low magnetic signature was delineated to be Eze-aku Group, Lafia Wukari Formation, Nkporo Formation and Agwu Formation. The two black lines in Figure 8 portray a demarcation between the basement and sedimentary basin with a circle of low magnetic region within the sedimentary region signifying deep underlying sediment. The black line is the volcanic-shale boundary (contact) and the line represents the boundary between the basement complex and the sediments region. In general, the analytical signal image (Figure 8) revealed the different lithological units and geological structures in the area.
First and Second Vertical Derivative (FVD)
The First Vertical Derivative (FVD) Figure 9 shows the rate of change of the anomaly with elevation or the variation of the anomaly with height. This enhances knowledge of the shallow depth of the anomalies.

Figure 9: FVD of the study area.
The magnetic content of the FVD range between -0.1 and 0.1nT. Based on these variations on the FVD map, the structures demarcated trending NE-NW to SW portion of the map indicated the existent of short wavelength anomalies with the indications of faults line cutting across the basement areas of the area. The high magnetic signatures is as a result of high magnetic susceptibility contrast between the adjacent magnetized blocks that correspond to geological contacts like lithological contacts and fractures.
Delineated Structural Map of the Study Area
Structures like lineaments, faults and fold were delineated with a trend of NE, NW-SW direction (Figure 10). The sedimentary region of the study area is clearly demarcated with low magnetic structures. The map shows that the northern portion around Keffi, Akwanga, Garaku, Wamba and Nasarawa Eggon are promising areas for mineralization. There are also minor mineralization zones in the SW and SE region around Awe, Keana, Doma which correspond to the Lafia Wukari formation and shall, Eze-aku Group, Agwu and Nkporo Formation which is made up of sandstones, limestone and shale.

Figure 10: Delineated structural map of the study area.
CET Porphyry Analysis
Structural complexity detection: The proceedings of the CET grid analysis are applied to the TMI map of the area to produce the structural complexity map.
In the process of computing the CET, the standard deviation of the study area shows that the low values which indicate very little variations are the main characteristics of the southern part of the area that is associated with sedimentary rocks, whereas high values indicate large variations are associated with the basement rocks in the northern part. The CET structural map (Figure 11) that is derived from the standard deviation map of study area shows that the northern part is highly deformed and dissected by many tectonic trends. These trends are the NNE, NNW, NW, SW and NE directions.

Figure 11: CET structural map of the study area.
The structural complexity map (Figure 11) overlain by the faults and shows that the eastern part associated with basement rocks of area is highly deformed along two main junction zones. The first one is observed in the southeastern corner trending in the N-S direction while the other one lies in the northeastern corner trending in the NE direction. Moreover, the structural complexity map illustrates that the central and southwestern parts are of intermediate structural complexity while the northwestern part is the lowest part of the study area from the complexity vision. The structural complexity map can be used as a primary map for identifying the shear zones that can host mineralization in in the study area.
Conclusion
Results obtained shows high potential of solid minerals deposits in the study area. The filters derivatives reveal variations in magnetic signature of highs and lows. The high magnetic signatures occupy the northeastern to northwestern regions of the study area which corresponds to Keffi, Akwanga, Wamba and Nasarawa Eggon regions were delineated. The major high magnetic signature trends eastwest. While the low magnetic signature which is of sediment deposition also occupies southwestern and Southwestern part of the study area which corresponds to lafia, Doma, Udege, Keana regions. The greenish part of the study area indicates alluvium deposition. The magnetic intensity map agreed with the geological map of the study area. These are areas with promising solid minerals of economic potentials like, gold at Wamba; Tin, Columbite and Tantalite at Akwanga; Granite rocks at Nasarawa Eggon. While the sedimentary basin occupies majorly Lafia and Doma which also host some industrial minerals like clay, glass sands and the salt brines at Keana. The examination of the geophysical datasets in the study area provides fresh information into structural construction. These reveals enhanced structural features that include shear zone, faults, shear and fault intersections and fracture systems as magnetic anomalies that mainly trend NESW.
Recommendation
From the results and findings obtained in this research work, the results suggest that the study area has the potential for minerals deposition. Therefore, further geophysical investigations involving ground magnetics, Electromagnetic (E-M) and geochemical analysis be carried out.
References
- Cooper GR, Cowan DR (2006) Enhancing potential field data using filters based on the local phase. Comput Geosci. 32(10):1585-1591.
[Google Scholar]
- Cordell L, Grauch VJ (1985) Mapping basement magnetization zones from aeromagnetic data in the San Juan Basin, New Mexico. Soc Explor Geophys. 181-197.
[Google Scholar]
- Core D, Buckingham A, Belfield S (2009) Detailed structural analysis of magnetic data-done quickly and objectively. SGEG Newsletter. 1(2):15-21.
- Obiora DN, Ossai MN, Okwoli E (2015) A case study of aeromagnetic data interpretation of Nsukka area, Enugu State, Nigeria, for hydrocarbon exploration. Int J Phys Sci. 10(17):503-519.
[Google Scholar]
- Gibson RI, Millegan PS (1998) Geologic applications of gravity and magnetics: Case histories. Society of Exploration Geophysicists and American Association of Petroleum Geologists.
[Google Scholar]
- Holden EJ, Dentith M, Kovesi P (2008) Towards the automated analysis of regional aeromagnetic data to identify regions prospective for gold deposits. Comput Geosci. 34(11):1505-1513.
[Google Scholar]
- Mørk MB, McEnroe SA, Olesen O (2002) Magnetic susceptibility of Mesozoic and Cenozoic sediments off Mid Norway and the role of siderite: Implications for interpretation of high-resolution aeromagnetic anomalies. Mar Pet Geol. 19(9):1115-1126.
[Google Scholar]
- Milligan PR, Gunn PJ (1997) Enhancement and presentation of airborne geophysical data. J Aust Geol Geophys. 17(2):63-75.
[Google Scholar]
- Miller HG, Singh V (1994) Potential field tilt-a new concept for location of potential field sources. J Appl Geophys. 32(2-3):213-217.
[Google Scholar]
- Oruc BU, Selim HH (2011) Interpretation of magnetic data in the Sinop area of Mid Black Sea, Turkey, using tilt derivative, Euler deconvolution, and discrete wavelet transform. J Appl Geophysi. 74(4):194-204.
[Google Scholar]
- Silva AM, Pires AC, Mccafferty A, de Moraes RA, Xia H (2003) Application of airborne geophysical data to mineral exploration in the uneven exposed terrains of the Rio Das Velhas greenstone belt. Braz J Geol. 33(2):17-28.
[Google Scholar]
- Verduzco B, Fairhead JD, Green CM, MacKenzie C (2004) New insights into magnetic derivatives for structural mapping. Leading Edge. 23(2):116-119.
[Google Scholar]
- Reeves C, Reford S, Millingan P (1997) Airborne geophysics: Old methods, new images. InProceedings of the fourth decennial international conference on mineral exploration. 13-30.
- Roest WR, Verhoef J, Pilkington M (1992) Magnetic interpretation using the 3-D analytic signal. Geophys. 57(1):116-125.
[Google Scholar]
- Jauro A, Obaje NG, Agho MO, Abubakar MB, Tukur A (2007) Organic geochemistry of Cretaceous Lamza and Chikila coals, upper Benue trough, Nigeria. Fuel. 86(4):520-532.
[Google Scholar]
Citation: Sawuta JM, Sadiq AU, Udensi EE, Adetona AA, Unuevho CI, et al. (2025) Structural and Mineral Exploration
in theNorth-Central Partof Nigeria Using Airborne Magnetic Data. Int J Appl Sci Res Rev. 12:56.
Copyright: © 2025 Sawuta JM, et al. This is an open-access article distributed under the terms of the Creative
Commons Attribution License, which permits unrestricted use, distribution, and reproduction in any medium, provided the
original author and source are credited.