Keywords
Gas chromatography; Liquid chromatography; Analytical methods
Introduction
Epigenetic modifications of DNA are covalent chemical changes at the moiety of the nucleic bases with no alterations in the DNA sequence [1]. Among others, DNA methylation is one of the most important epigenetic processes, and there is a vast literature describing the strong evidences about the correlation between methylation of DNA and alterations of gene expression. In particular, alterations in the methylation pattern were found to be related to different diseases such as human carcinomas [2], leukemia [3], lung [4], thyroid [4], pancreas [4] and prostate [5] tumours, to mention a few examples. Despite 7-methylguanine (7-mG) is considered as non-promutagenic with minimal biological relevance [6], the development of analytical methods for its determination is of relevance since its presence and level increase, as a consequence of the presence of methylating agents, can be correlated to pro-mutagenic and carcinogenic, such as O6-methylguanine and methyladenine [7]. In other words, the determination of 7-mG can serve as internal or indirect biomarker for the monitoring, control and estimation of exposure degree to different methylating agents [8].
Many different analytical methodologies have been developed for the determination of 7-mG (N7-guanine adducts), including chromatography [9], high pressure liquid chromatography (HPLC) [10], 32P-postlabeling methods [11], gas chromatography [12] and liquid chromatography tandem mass spectrometry [13] as representative examples of such methods. Unfortunately, and despite their high sensitivity, they are time-consuming and expensive, which hinders their implementation for routine analyses. In this regard, electrochemical methods have taken a step forward and represent very promising tools for DNA studies since they can provide not only a rapid and accurate analysis but also an economically viable tool which would allow their easy implementation [14-17]. Nevertheless, and despite the progress performed in this area of research, there is still much work to undertake regarding the reproducibility and repeatability in performance of these electrochemical methods.
In the particular case of 7-mG electrochemical response, some works can be already found in the literature. For example, Bojarska et al. [18] studied the polarographic behaviour of different 7-mG derivatives (7-methylguanosine and 7-methylguanosine 5'-phosphate) using direct-current polarography, cyclic voltammetry and differential pulse polarography. Shubietah et al. [19] also investigated the voltammetric behaviour of 7-mG by using differential pulse cathodic stripping voltammetry at a hanging mercury drop electrode. Schleifer et al. [20] quantified the presence of N7-methylguanine and O6-methylguanine DNA by HPLC coupled to a carbon based electrochemical detector for determining guanine alkyl adducts [20]. More recently, Brotons et al. first reported a more extensive work regarding the electrochemical behaviour of 7-mG at screen-printed graphite electrodes (SPGEs), examining the detection and quantification of 7-mG by cyclic voltammetry (CV) and square wave voltammetry (SWV). They also evaluated the effect of different parameters including i) 7-mG concentration, ii) pH and iii) SPGE pretreatment on the electroanalytical performance of 7-mG. Interestingly, the same authors reported a linear correlation between the current intensity and 7-mG concentration within a concentration range of 1-35 μM. In addition, this analysis was possible even in the presence of guanine (G) and adenine (A) as inherent interferents [21].
The electrooxidation of nucleic bases involves the landing and slight adsorption upon the electrode surface dominated either by a π-π interaction between the pyrimidine or purine rings and the sp2 to sp3 character ratio of carbonaceous materials such as graphite or graphene or by the interaction of the ring moieties of the nucleic base with edge plane surfaces that depict higher electron transfer rates. Hence, the control of the strongest or weakest adsorption of nucleic bases upon the electrode surface is relevant and will govern the electron transfer rate of the electrooxidation reaction.
On the other hand, it is also well-known that the DNA bases adsorb on some metal solid surfaces such as noble metal materials, and in particular, on Au electrodes [22-26]. In addition, by using electrochemical methods, this adsorption desorption process has been also described to be sensitive to the surface structure of the Au electrode, that is, to its specific atomic arrangement. Taking advantage of this surface structure sensitivity, our preliminary results have previously demonstrated that the adsorptiondesorption properties of cytosine (C) and methylcytosine (mC) on Au surfaces are highly sensitive to the surface structure. Concerning this fact, the use of Au (111) electrode surfaces provided a discriminatory determination and quantification of the presence of C and mC throughout the logarithm of the potential of the peak due to the adsorbed nucleobase with concentration [27,28]. Following a similar approach, the aim of this article is to explore first the influence of the methyl group at N7 position of guanine nucleobase on the adsorption at well-defined single crystalline gold structures and its comparison with the nonmodified guanine (G) residues. Cyclic voltammetric responses of G and 7-mG have been performed at phosphate buffer solution and the adsorption-desorption peak potentials of 7-mG have been correlated with the concentration of 7-mG in the absence and presence of G. Finally, the feasibility for the electroanalytical sensing and quantification of 7-mG throughout its adsorptiondesorption properties on different Au surfaces will be discussed.
Methods
Materials and chemicals
Gold single crystal electrodes were made from gold beads (2-3 mm diameter), obtained by fusion and subsequent slow crystallization of a 99.999% gold wire (Good fellow Metals in all gold samples). After careful cooling, the resulting single crystal beads were oriented, cut and polished following the procedure described in [29] as similarly for Pt beads. Prior to each electrochemical experiment, the single crystal electrodes were flame-annealed and quenched with ultrapure water (Milli-Q 18.2 MΩ cm). A gold bead fully immersed in the electrochemical cell solution was also used as a reproducible pattern of a polyoriented gold electrode (i.e., a polycrystalline gold electrode). The quality of all these gold electrodes has been verified by cyclic voltammetry in 0.1 M phosphate buffer solution (pH=7) [30], which was prepared using a certain ratio of NaH2PO4 and Na2HPO4 (Panreac 99% purity). The pH of the solution was checked with a Crison 507 pH-meter.
Guanine (G) and 7-methylguanine (7-mG) were obtained at the highest analytical grade available (from Sigma Aldrich) and were used as received without any further purification. Ultrapure water was used for all solutions. G and 7-mG solutions were prepared in 0.1 M phosphate buffer pH 7 solution. Due to the low G solubility, solutions were prepared up to saturated conditions and then were filtered through a 0.42 μm pore diameter filter. The solubility of 7-mG was found to be closer to 300 μM in aqueous solution. A certain amount of 7-mG to reach a specific concentration was added into a certain volume of aqueous buffer solutions and stirred for 30 min. alternatively, saturated solutions of 7-mG were prepared in aqueous buffer solutions and further filtrated through a filter with a 0.42 μm pore diameter and the final concentration of 7-mG was determined spectrophotometrically. In some cases a certain concentration was prepared from the dilution of the saturated 7-mG solution. Final concentrations of freshly prepared G and 7-mG solutions were determined via UV-visible spectrophotometry using an extinction coefficient of 10,700 cm-1 M-1 at 243.0 nm for G [31] and 7300 cm-1 M-1 at 248.0 nm for 7-mG [32] in water.
Electrochemical measurements
The voltammetric experiments were carried out in a standard three-electrode cell. The electrode potential was controlled by a PGSTAT302N (Metrohm Autolab) system. Solutions were prepared as previously described and deaerated with Ar (99.999%, AlphaGaz). All experiments were performed at room temperature (22 ± 2ºC). The electrode potential was controlled using an AUTOLAB, with a gold wire as counter electrode. The potentials were measured against a reversible hydrogen electrode (RHE) connected to the cell through a Luggin capillary. As usual, the Au single crystal electrodes contacted the solution through the hanging meniscus configuration at 0 V. As previously stated, a gold bead fully immersed in the electrochemical cell solution was also used as a polyoriented gold electrode. The electrochemical experiments were performed in triplicate (the electrodes were flame-annealed and quenched each time) and potential peaks were given as an average value. Limit Of Detection (LOD) and Limit Of Quantification (LOQ) were calculated with Origin software.
Results and Discussion
Figure 1 depicts the characteristic voltammetric profiles obtained either with a Au bead (polyoriented surface) or with the three basal plane electrodes (Au (100), Au (110) and Au (111)) in 0.1 M phosphate buffer solution (pH=7) in presence of G (55 μM). The voltammetric profile of the polyoriented Au surface (black line) shows the presence of a complex voltammetric profile with multiple, stable and broad contributions. However, this voltammetric response becomes simpler when the response of different Au single crystals basal planes, in the same experimental conditions, is obtained and incorporated into the discussion. The results clearly Figure out how sensitive the adsorptiondesorption of G to the surface structure of the Au electrode is and therefore, very distinct and characteristic voltammetric signals are recorded for each surface orientation. Interestingly, if these voltammetric profiles performed at gold single crystals are compared with that observed for a polyoriented surface, it is possible to make a reasonably good assignation of each one of the broad contributions observed on the polyoriented surface due to its corresponding surface structure.
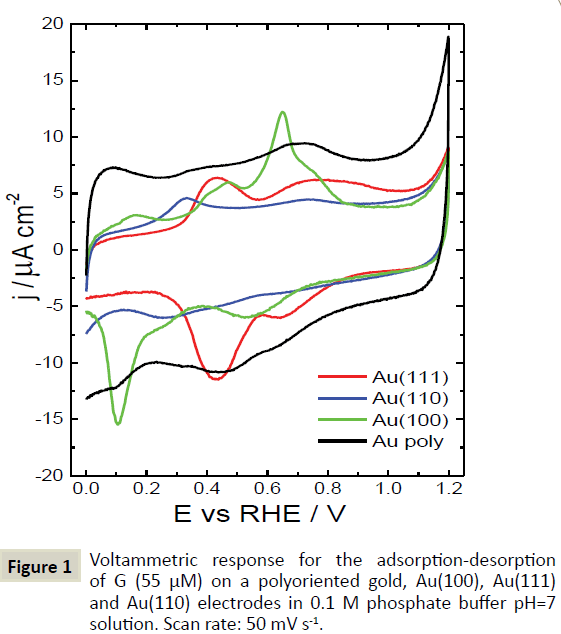
Figure 1 Voltammetric response for the adsorption-desorption of G (55 μM) on a polyoriented gold, Au(100), Au(111) and Au(110) electrodes in 0.1 M phosphate buffer pH=7 solution. Scan rate: 50 mV s-1.
A similar comparative study can be carried out when G is replaced by 7-mG. Thus, Figure 2 illustrates the distinct voltammetric features of the different Au surfaces in presence of 7-mG. As previously observed in the case of G, it is possible to establish some relationships between the voltammetric features obtained with the polyoriented gold surface and those obtained with the Au basal planes electrodes. However, in the case of Au (111), there are two sharp signals at about 0.29 V and 0.37 V in the negativegoing sweep which are not visible in the polyoriented surface. These contributions, exclusively observed with the Au (111) surface, are very relevant and will be employed in forthcoming sections of this work.
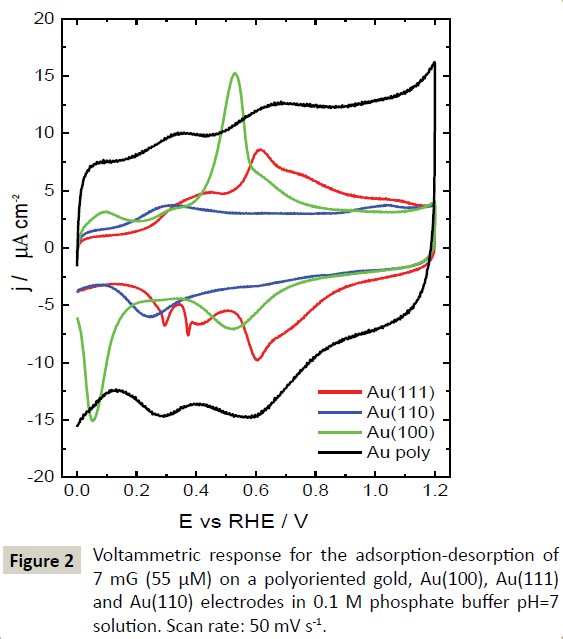
Figure 2 Voltammetric response for the adsorption-desorption of 7 mG (55 μM) on a polyoriented gold, Au(100), Au(111) and Au(110) electrodes in 0.1 M phosphate buffer pH=7 solution. Scan rate: 50 mV s-1.
It is worth mentioning that the characteristic voltammetric features observed in the presence of G and 7-mG are obviously different from those obtained in their absence. To illustrate this fact, Figure 3 compares the voltammetric responses of each Au single crystal electrode in absence and presence of G and 7-mG. The response of the different Au surfaces in absence of G and 7-mG is, as expected, similar to that previously shown in the literature [30]. In fact, these voltammetric profiles can be used to verify the quality of the surface structure of each electrode.
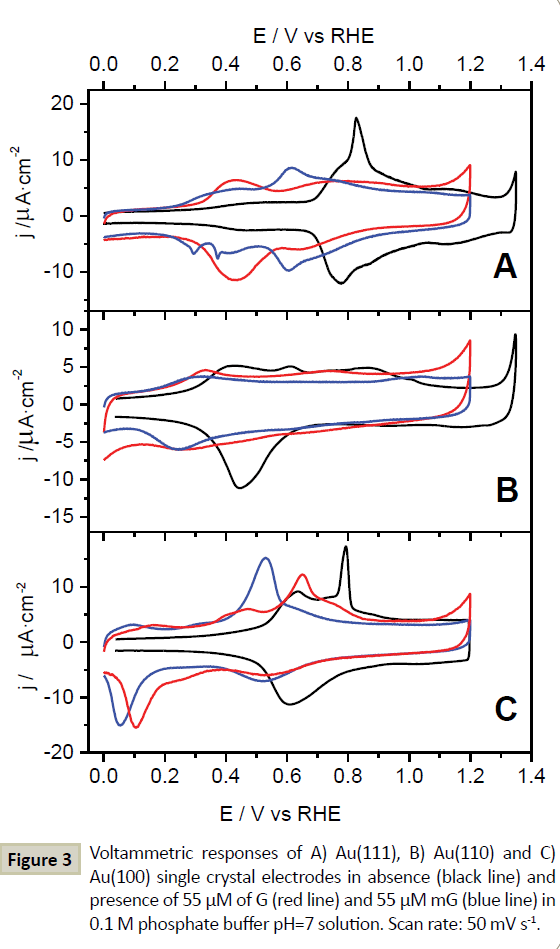
Figure 3 Voltammetric responses of A) Au(111), B) Au(110) and C) Au(100) single crystal electrodes in absence (black line) and presence of 55 μM of G (red line) and 55 μM mG (blue line) in 0.1 M phosphate buffer pH=7 solution. Scan rate: 50 mV s-1.
As previously stated, in case of the Au (111) electrode, two sharp contributions were clearly identified in the negative going sweep. To gain more information on these contributions, we have acquired a collection of voltammograms in which the 7-mG concentration was intentionally increased. The results obtained under these experimental conditions are shown in Figure 4. The results show a clear evolution of the voltammetric profile as a function of the 7-mG concentration. Particularly, there are three voltammetric contributions which seem to be strongly affected by the 7-mG concentration, two of them previously mentioned and placed at about 0.29 V and 0.37 V in the negative going sweep and the third, a new one at about 0.28 V in the positive going sweep, which becomes clearly visible for 7-mG concentrations higher than 100 μM. An additional contribution at about 0.4 V in the positive going sweep is also visible for 7-mG concentrations higher than 100 μM. However, this latter contribution seems to be insensitive to changes in the 7-mG concentration contrarily to the other three contributions.
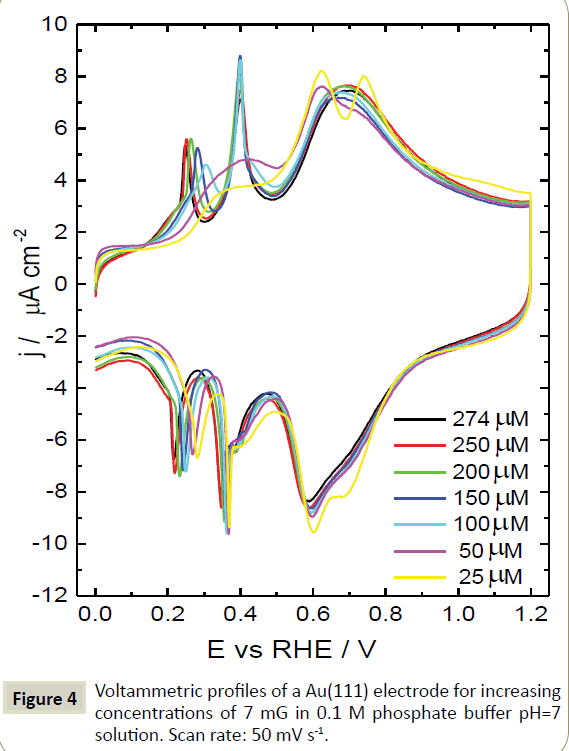
Figure 4 Voltammetric profiles of a Au(111) electrode for increasing concentrations of 7 mG in 0.1 M phosphate buffer pH=7 solution. Scan rate: 50 mV s-1.
Interestingly, all these sharp contributions are stable with the number of cycles within this particular potential window. However, if the upper potential limit is shifted to more positive values, where surface oxidation takes place, the voltammetric profile is clearly modified as a consequence of the Au (111) surface disordering. On the other hand, it is also worth noting that these voltammetric responses are perfectly reproducible.
From a more analytical point of view, we have observed that the plot of the peak potential of these three contributions as a function of the 7-mG concentration gives rise to a reasonably good linear regression (R ~ 0.99) is all three contributions. The results obtained are displayed in Figure 5 and point out the possibility of determining the 7-mG concentration, within the linear range evaluated, by simply measuring the peak potential of one of the three voltammetric features under study.
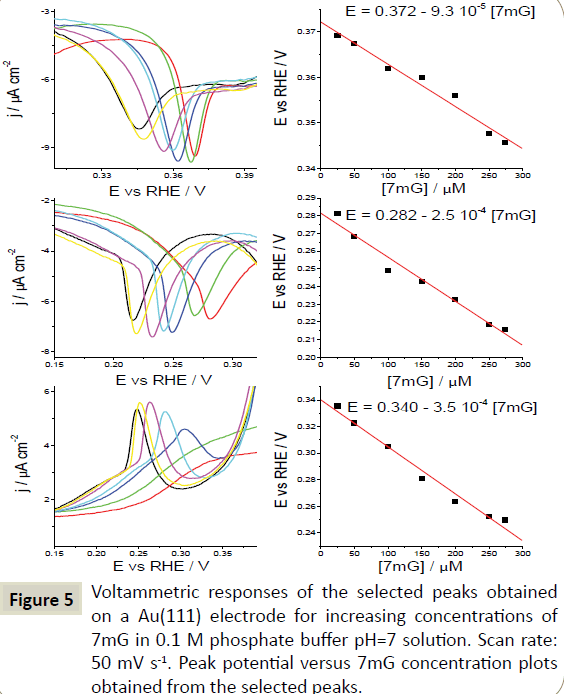
Figure 5 Voltammetric responses of the selected peaks obtained on a Au(111) electrode for increasing concentrations of 7mG in 0.1 M phosphate buffer pH=7 solution. Scan rate: 50 mV s-1. Peak potential versus 7mG concentration plots obtained from the selected peaks.
One of the key issues in the development of an electrochemical sensor for the detection of methylated guanine in a pool of nucleobases residues is the effect of the possible interferents. Even assuming that the samples for analysis can be obtained from biological samples after optimised extraction, purification and hydrolysis of the DNA samples, the resulting sample will contain different nucleobases which can strongly modify the electrochemical response obtained when 7-mG is solely present. Among the different nucleobases, the presence of G may result particularly harmful and, consequently, we have explored the possible detection of 7-mG in the presence of G. In this regard, Figure 6 shows the results obtained for increasing concentrations of 7-mG in the presence of a fixed concentration of G (~ 44 μM). The results obtained indicate the increasing presence of 7-mG has two main effects which are only noted in the negative-going sweep. Specifically, the contributions observed in the absence of 7-mG (only G is present) and centered at about 0.65 and 0.45 V clearly evolve with the increasing concentration of 7-mG; the first one showing an increasing current and shifting to more negative potentials while the second one decreasing significantly but remaining at almost the same potential. Additionally, and only for 7-mG concentrations higher than 50 μM, the previously discussed contribution at 0.29 V is again observed.
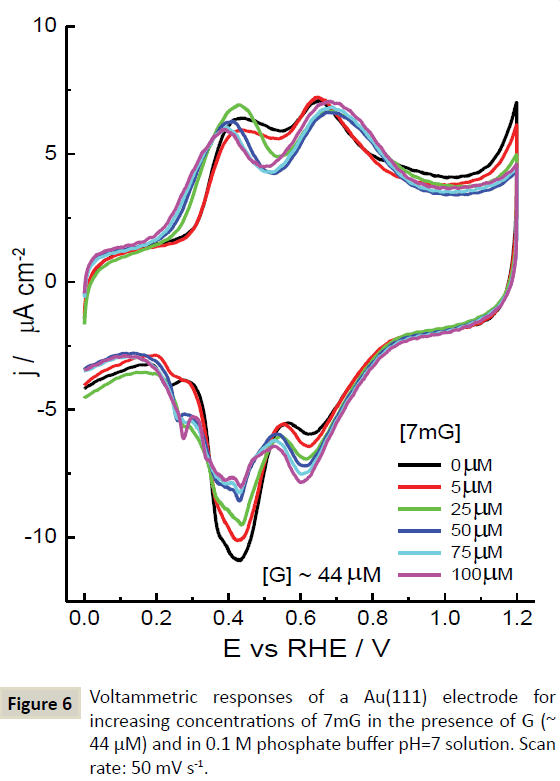
Figure 6 Voltammetric responses of a Au(111) electrode for increasing concentrations of 7mG in the presence of G (~ 44 μM) and in 0.1 M phosphate buffer pH=7 solution. Scan rate: 50 mV s-1.
In an attempt to establish a correlation between the 7-mG concentration and any of the voltammetric features observed in Figure 6, we have found a reasonably good linear regression (R ~ 0.99) by using the contribution placed at about 0.65 V. As shown in Figure 7, the peak potential varies linearly with the 7-mG concentration. In addition, in this case, it is also possible to obtain a good linear correlation (R ~ 0.99) between the current density of the peak and the 7-mG concentration. This correlation is presented in Figure 8.
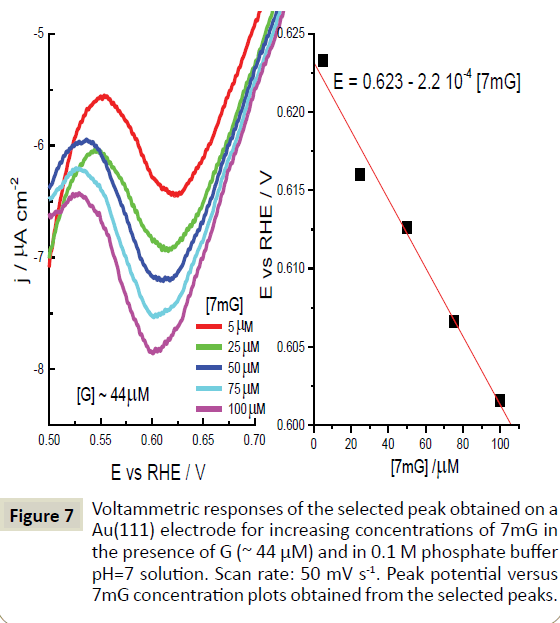
Figure 7 Voltammetric responses of a Au(111) electrode for increasing concentrations of 7mG in the presence of G (~ 44 μM) and in 0.1 M phosphate buffer pH=7 solution. Scan rate: 50 mV s-1.
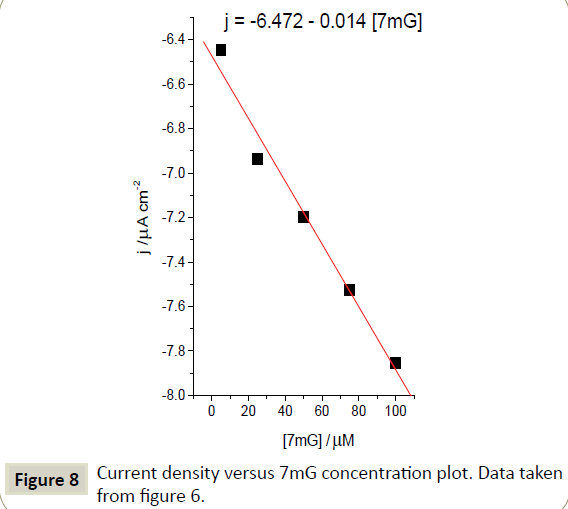
Figure 8 Current density versus 7mG concentration plot. Data taken from figure 6.
These results indicate that the adsorption-desorption properties of 7-mG on a Au (111) electrode displays some singular voltammetric features that show a linear dependence with the concentration of 7-mG. This dependence could allow its quantification which may contribute to the future development of an electrochemical sensor. In this sense, it is also worth noticing that, from an analytical point of view, the results here reported are still very preliminary. Thus, for instance, the results obtained using SPGE platforms gave a sensitivity of 0.046 μA μM-1 and a limit of detection of 1.63 μM in a concentration range of 1-35 μM of 7-mG, while in this manuscript we have obtained, in the best case, a limit of detection of about 8.5 μM and a sensitivity of about 0.00035 V μM-1. However, it is also important to keep in mind that this analysis is based on only adsorption desorption process instead of oxidation processes. This implies that the electroanalytical methodology is not destructive and the samples could be reused. In addition, it is also interesting to mention that the Au (111) electrode, although expensive, can be reusable many times giving rise to highly reproducible and accurate electrochemical measurements (assuming a controlled manipulation of the electrode, i.e., its flame annealing and quenching).
Conclusions
In this article, the adsorption-desorption properties of G and 7-mG on different Au surfaces and particularly on Au (111) electrodes have been studied. The results clearly indicate that the adsorptiondesorption properties of both nucleobases are sensitive to the surface structure of gold. Interestingly, the electrochemical response of a Au (111) electrode towards the adsorptiondesorption of 7-mG displays some specific contributions that have been found to be highly sensitive to the 7-mG concentration. This 7-mG concentration sensitivity has allowed obtaining some calibration plots that could be employed for the electroanalytical determination of 7-mG. Unfortunately, in the presence of Gas potential interferents, the electrochemical response becomes much more complicated. Nonetheless it is still possible to find some voltammetric features, but different to those employed when 7-mG is solely analyzed, that present a reasonably good linear dependency with the 7-mG concentration. More work is in progress to improve the electrochemical sensitivity towards 7-mG detection as well as to analyse the effect of the presence of other nucleobases.
Acknowledgements
Authors would like to acknowledge funding obtained through the Spanish Ministry of Science and Innovation (MICINN) CTQ2013- 48280-C3-3-R project.
References
- Alberts B (2008) Molecular Biology of the Cell: Reference Edition. Taylor & Francis.
- Baylin SB, Herman JG, Graff JR, Vertino PM, Issa JP, et al. (1998) Alterations in DNA methylation: a fundamental aspect of neoplasia. Adv Cancer Res 72: 141-196.
- Chen J, Odenike O, Rowley JD (2010) Leukaemogenesis: more than mutant genes. Nat Rev Cancer 10: 23-36.
- Belinsky SA, Nikula KJ, Palmisano WA, Michels R, Saccomanno G, et al. (1998) Aberrant methylation of p16(INK4a) is an early event in lung cancer and a potential biomarker for early diagnosis. ProcNatlAcadSci USA 95: 11891-11896.
- Donkena KV, Young CY, Tindall DJ (2010) Oxidative stress and DNA methylation in prostate cancer. ObstetGynecolInt 2010: 302051.
- WATSON JD, CRICK FH (1953) Molecular structure of nucleic acids; a structure for deoxyribose nucleic acid. Nature 171: 737-738.
- Meer L, Janzer RC, Kleihues P, Kolar GF (1986) In vivo metabolism and reaction with DNA of the cytostatic agent, 5-(3,3-dimethyl-1-triazeno)imidazole-4-carboxamide (DTIC). Biochem Pharmacol 35: 3243-3247.
- Boysen G, Pachkowski BF, Nakamura J, Swenberg JA (2009) The formation and biological significance of N7-guanine adducts. Mutation Research/Genetic Toxicology and Environmental Mutagenesis 678: 76-94.
- Schwarz M, Wiesbeck G, Hummel J, Kunz W (1982) Effect of ethanol on dimethylnitrosamine activation and DNA synthesis in rat liver. Carcinogenesis 3: 1071-1075.
- Swenberg JA, Dyroff MC, Bedell MA, Popp JA, Huh N, et al. (1984) O4-ethyldeoxythymidine, but not O6-ethyldeoxyguanosine, accumulates in hepatocyte DNA of rats exposed continuously to diethylnitrosamine. ProcNatlAcadSci USA 81: 1692-1695.
- Gupta RC, Reddy MV, Randerath K (1982) 32P-postlabeling analysis of non-radioactive aromatic carcinogen--DNA adducts. Carcinogenesis 3: 1081-1092.
- Foiles PG, Akerkar SA, Carmella SG, Kagan M, Stoner GD, et al. (1991) Mass spectrometric analysis of tobacco-specific nitrosamine-DNA adducts in smokers and nonsmokers. Chem Res Toxicol 4: 364-368.
- Singh R, Farmer PB (2006) Liquid chromatography-electrospray ionization-mass spectrometry: the future of DNA adduct detection. Carcinogenesis 27: 178-196.
- Oliveira-Brett AM, Piedade JA, Silva LA, Diculescu VC (2004) Voltammetric determination of all DNA nucleotides. Anal Biochem 332: 321-329.
- Brotons A, Mas LA, Metters JP, Banks CE, Iniesta J (2013) Voltammetric behaviour of free DNA bases, methylcytosine and oligonucleotides at disposable screen printed graphite electrode platforms. Analyst 138: 5239-5249.
- Ivandini TA, Honda K, Rao TN, Fujishima A, Einaga Y (2007) Simultaneous detection of purine and pyrimidine at highly boron-doped diamond electrodes by using liquid chromatography. Talanta 71: 648-655.
- Kato D, Sekioka N, Ueda A, Kurita R, Hirono S, et al. (2008) A nanocarbon film electrode as a platform for exploring DNA methylation. J Am Chem Soc 130: 3716-3717.
- Bojarska E, Darzynkiewicz E, Ostapczuk P, Sequaris JM, Czochralska B, et al. (1990) Electroanalytical study on nicotinamide 7-methylguanine dinucleotide (NM7GD+), analog of coenzyme NAD+ and related-compounds. NucleosNucleotNucl 9: 437-438.
- Shubietah RM, Zuhri AZA, Fogg AG (1994) Voltammetric behaviour and determination of some methylated guanine in presence of copper ions. Anal Lett 27: 1123-1134.
- Schleifer S, Tempel K (1996) Formation and persistence of N7- and O6-methyl-guanine in DNA of chick embryo brain cells in ovo following administration of N-nitroso-N-methylurea. ZentralblVeterinarmedA 43: 589-598.
- Brotons A, Sanjuan I, Banks CE, Vidal-Iglesias FJ, Solla-Gullón J, et al. (2015) Voltammetric behaviour of 7-methylguanine using screen-printed graphite electrodes: towards a guanine methylation electrochemical sensor. Electroanalysis: in press.
- Rueda M, Prieto F, Rodes A, Delgado JM (2012) In situ infrared study of adenine adsorption on gold electrodes in acid media. Electrochim Acta 82: 534-542.
- Álvarez-Malmagro J, Prieto F, Rueda M, Rodes A (2014) In situ Fourier transform infrared reflection absortion spectroscopy study of adenine adsorption on gold electrodes in basic media. Electrochim Acta 140: 476-481.
- Wandlowski T, Lampner D, Lindsay SM (1996) Structure and stability of cytosine adlayers on Au(111): an in-situ STM study.J Electroanal Chem 404: 215-226.
- Roelfs B, Bunge E, Schröter C, Solomun T, Meyer H, et al. (1997) Adsorption of Thymine on Gold Single-Crystal Electrodes. J Phys Chem B 101: 754-765.
- Piana S, Bilic A (2006) The nature of the adsorption of nucleobases on the gold [111] surface. J Phys Chem B 110: 23467-23471.
- Brotons A, Vidal-Iglesias FJ, Solla-Gullon J, Iniesta J, Feliu JM, et al. (2013) A First Approach to the Electrochemical Evaluation of DNA Methylation on Gold Surfaces: from Single Crystals to Nanoparticles. 12th Topical Meeting of the International Society of Electrochemistry & XXII International Symposium on Bioelectrochemistry and Bioenergetics of the Bioelectrochemical Society.
- Brotons A, Vidal-Iglesias FJ, Solla-Gullon J, Iniesta J, Feliu JM, et al. (2015) Electrochemical Quantification of 7-Methylguanine on Gold Surfaces. XXIII International Symposium on Bioelectrochemistry and Bioenergetics.
- Clavilier J, Armand D, Sun SG, Petit M (1986) Electrochemical adsorption behaviour of platinum stepped surfaces in sulphuric acid solutions. J Electroanal Chem 205: 267-277.
- Martins A, Queirós A, Silva F (2005) Surface-structure-sensitive adsorption of adenine on gold electrodes. Chemphyschem 6: 1056-1060.
- Fasman GD, Company CR (1977) Handbook of Biochemistry and Molecular Biology. CRC Press.
- Svoboda P, Kasai H (2004) Simultaneous HPLC analysis of 8-hydroxydeoxyguanosine and 7-methylguanine in urine from humans and rodents. Anal Biochem 334: 239-250.