Vatsala L, Jamuna Prakash* and Prabhavathi SN
Department of Food Science and Nutrition, University of Mysore, Manasagangotri, Mysuru-570 006, India
*Corresponding Author:
Prakash J
Department of Food Science and Nutrition
University of Mysore, Manasagangotri
Mysuru-570 006, India
Tel: +91-821-2419634
E-mail: jampr5@hotmail.com
Received date: July 31, 2017; Accepted date: August 07, 2017; Published date: August 17, 2017
Citation: Vatsala L, Prakash J, Prabhavathi SN (2017) Food Security and Nutritional Status of Women Selected from a Rural Area in South India. J Food Nutr Popul Health. Vol. 1 No. 2: 10
Keywords
Food security; Dietary intake; Nutrient adequacy; Food frequency; Anthropometry
Introduction
The health of an individual is known to be influenced by his/ her nutritional status. For instance, a child born in one of the healthiest countries would have a life expectancy of more than 70 healthy years, in contrast to a child born in least healthy counterpart who may live for less than 50 years. This is suggestive of the fact that, poorer countries can be expected to have much lower levels of average health achievement. On the other hand, higher incomes are thought to facilitate for exercising greater command over many goods and services that are linked to promote health, better nutrition, and access to clean drinking water, sanitation, housing and quality health services [1-3]. The distribution of nutritional status both within and between countries is said to be totally uneven [4,5]. In developed countries like United States, the burden of overweight and obesity is estimated to disproportionately impact those with low incomes, low educational status and those who belong to minority race/ethnicity [6-8]. In a developing country like India, nutritional status is directly related to several factors including; levels of education, standard of living and social status. Thus it could be said that over nutrition is widely prevalent among high socio economic status and under nutrition among low income category [9-12]. Over the years large changes have occurred in diet and physical activity with respect to the structure and overall composition. Changes in life style and health status paralleled with major demographic and socio economic changes have also been observed. The diet of early humans was said to be highly varied i.e., it had low fat and high fiber, coupled with higher levels of physical activity. After about 10-12,000 years, industrial revolution and 2nd agricultural revolution began which lead to a greater shift in dietary pattern. Such diets were said to contain high fat, refined carbohydrate and low fiber [13,14]. There are several factors that have been associated with the occurrence of malnutrition particularly among women such as the socio economic status, culture, demography and dietary characteristics [15-20]. In developing countries, women take a major share of managing the food security of families as they are responsible for cooking and feeding all the family members apart from decision making. However, they also tend to neglect their own health as priority is placed on taking care of others. The present study was undertaken in order to explore the nutritional status, dietary pattern and food security scenario among selected subjects from a rural area of Mysuru district.
Methodology
The study area was a village named ‘Belawadi’ in Mysuru district, situated in Karnataka state of South India. Female subjects belonging to the age group of 20-40 years formed the study population and were selected based on purposive sampling and their consent to be a part of the study. Approval from the Institutional Human Ethics committee was obtained for the study. Subjects who were healthy were included for the study and women under any physiological stress conditions such as pregnancy and lactation were excluded. The required information about various aspects proposed for study was obtained by structured questionnaires. Suitable questionnaires were constructed and pre-tested with a small population, and appropriate modifications were introduced so as to obtain a standard questionnaire. Schedules so constructed were used for interviewing respondents. General information schedule carried questions about age, religion, education, marital status, and personal habits. All subjects included for the study were measured for their body dimensions. Anthropometric assessment schedule included useful measurements such as height, weight, mid upper arm circumference (MUAC), and waist and hip ratio. Height was measured in cm, using a fiber glass tape (nearest to 0.1 cm). A battery operated digital balance precise to 0.1 kg was used to record weight of the selected subjects. The balance was calibrated with standard weights every time before use. Using height and weight data the BMI was calculated using the formula: Weight (kg)/Height (m2). A flexible fiber glass tape having scale with 10 division/cm was used to measure MUAC of the selected subjects on the bare left hand at the center point marked after measuring the length between acromion and olecranon. The measurement was made with the arm hanging relaxed at the side. The skin-fold parallel to the long axis was picked up between the thumb and forefinger of the left hand, clearly away from the underlying muscle, and was measured at this point [21]. The measurement of waist circumference between the lower margin of the last palpable rib and the top of the iliac crest and the hip circumference measurement was taken around the widest portion of the buttocks for computation of waist: hip ratio (WHR). For the dietary assessment two methods were employed- food frequency and 24 h recall method. Information on frequency of consumption of each food item listed in the questionnaire was collected by interviewing the subjects. Dietary assessment schedule included questions for food frequency, and dietary intake according to 24 h recall method. Information about the foods, beverages, and snacks consumed in the preceding 24 h with the help of standard cups and spoons were recorded. The food items consumed by the subjects were standardized in the laboratory for convenience in computing nutritional composition of prepared foods. A ready recknor for nutritional value of each dish consumed was developed using the data for the analysis of dietary intake assessment. For this database for nutritional composition of Indian foods was used [22]. Percent adequacy of nutrients was computed using the recommended dietary allowances suggested for Indians [23]. The food security was assessed by collecting information regarding their economic status, occupation, place of dwelling, crops grown, frequency of purchase of food items, rearing of domestic animals and availing assistance from welfare programs. The data obtained were subjected to suitable statistical analysis. Mean with the respective standard deviation (SD) and percentages were used wherever necessary. Student’s t-test and chi-square was used to compute the significant differences between the groups.
Results and Discussion
The results of the study are summarized in Tables 1-6 and Figures 1-2. Table 1 indicates the demographic characteristics of the study population. Majority of the subject (86.8%) were housewives. A very small percentage (7.8%) of subjects was working in factory and others had alternate occupations. Information about family structure revealed that the vast majority of subjects (86.6%) were living in nuclear families. A considerably small number (5.8 and 7.6%) were living in joint and extended families respectively. Details about household facilities showed that 65.8% of subjects had own houses and 32.8% were residing in rented houses. A majority of the subjects in the study area (99.4%) reported having toilet facility while only 1.6% was without toilet facility. The major source of drinking water was piped in water for about 99.4% of the subjects whereas 0.6% was using pump/borewell water. Educational status indicated that a sizeable proportion (46.6%) had schooling up to 10 years, followed by 13.2% with a total schooling years of 12 years and only 9% informed to have completed graduation courses. About 25.6% were found to be illiterates. The main source of fuel being used was liquid petroleum gas (91.2%), kerosene oil (8%) and a negligible number of subjects (0.8%) used firewood. Majority (82%) of the households reported using both plastic and steel pots for storing drinking water, while around 14.4% were using only steel pots. This indicated that in general, they belonged to low socio-economic group with meagre facilities. Research carried out in most of the developing countries like Asia, Africa and Latin America has indicated that household food security and nutritional status are directly associated with women’s access to income and their role in household decisions with regard to the expenditure. This could be mainly due to the reason that women are known to spend significantly higher proportion of the income for providing food for the family in comparison to a male member [24]. Average household income was Rs. <1000 for a highest majority (95.8%) of the subjects. While a very small segment (0.4%) of the subjects were found to earn Rs. >5000/ month. In situations of financial problem, 53.6% reported borrowing money from others. Around 66% of the subjects reported that they were covered under public distribution system and received certain grocery items under subsidized rates under Government Welfare Program. Information about involvement in agriculture and type of crops grown is presented in Table 2. Around 13.8% of the subjects said that they were taking part in agricultural activities. Data regarding involvement of household members in agriculture showed that, in 6.8% of the households only head of the family was taking care of agriculture related activities. According to report women farmers are known to be involved in the production of large proportions of the world’s food output. Half of the agricultural work force has been estimated to be provided by women in most of the developing countries. Estimates across South Asia has indicated a country wise variation with respect to participation of females in agriculture related activities and was reported to be ranging from 50% in Bangladesh to only 35% in Sri Lanka [25]. In about 6.6% of the households both the head of the family as well as spouse were reported to be involved. Both plough as well as tractor (7.4 and 6.4%) was being employed in agricultural work. About 12% of the subjects cultivated both cereals as well as pulses. A very small number also grew fruits and vegetables in their kitchen gardens. A small percentage of subjects (7.2 and 2.2) reported that they sell about 75 and 50% of the produce from the total amount. The main mode of selling crops was through auction (1.6%) and 8.4% sold it directly to the consumers. It has become imperative that to maintain good health and well being, one should have adequate supply of diversified food groups. Food security can be defined as the access to adequate food to lead an active and healthy life. Food insecurity may arise as a result of non- availability of nutritionally adequate and safe foods. This may lead to a persistent hunger resulting in the development of malnutrition [26]. An investigation was conducted in the city of Coimbatore in India to determine the prevalence of food insecurity and dietary practices of households with and without children. About 300 households were interviewed to gather basic information. The results of the study indicated that, about 56% of the households without children were reported to be food secure, while 20% were food insecure but without hunger. In contrast, 43% of households with children were found to be food secure. Rural houses were noticed to have more food insecurity than those living in urban and semi urban areas. Frequency of consumption of fruits and vegetables and dairy products were reported to be low irrespective of the presence of either food security or insecurity. The study demonstrated that, food insecurity was found to be prevalent in household with children and thus efforts should focus on immediate causes and their prevention [27]. Information pertaining to the classification of subjects according to nutritional status is shown in Table 3. It was interesting to note that with increasing age, the pattern of weight gain was found to be gradually increasing. The highest mean weight was recorded among the subjects in the age group of 36- 40 years (60.43 ± 11.74 kg). A considerably higher percentage (13.6%) of the subjects in the age group of 20-25 years was below desirable BMI range. A small number of subjects were observed to have body mass index (BMI) greater than 35 kg/m2. Statistical analysis showed that the differences among different age groups were not significant (p=0.58). According to NFHS-4 (2015-16), 24.3% of adult women from rural area of Karnataka were found to have a BMI <18.5kg/m2. While the prevalence of overweight or obesity was estimated to be about 16.6% [28]. Similarly the classification of subjects based on waist-hip ratio (WHR) showed that a total of 160 subjects had normal WHR values in the range of 0.7-0.8. Subjects with a higher WHR values between 0.8 and 0.9 were found to be higher among all age groups and the observed prevalence rate was 14.4%, 18.2% and 17.8%, respectively. Statistical analysis indicated no significant differences between subjects belonging to different age groups (p=0.85). Classification of subjects according to mid-upper arm circumference (MUAC) showed that a total of 6.0% of subjects belonged to the category with 70-80% of the standard. A proportionately higher percentage (74.2%) was observed to have more than 90% of the standard with non-significant differences between the groups. The overall grading of all subjects in BMI grades presented in Figure 1 showed that a majority (37.2%) were in normal range, followed by overweight (29.6%), Grade I obesity (29.6%) and Grade II Obesity (3.6%). In a study conducted by Prakruti and Prakash [29] in another rural area of same district, similar pattern of weight gain was reported among women. Women gained weight with increasing age and there were higher number of obese older women. The study also showed a positive correlation between BMI and age, WHR and skinfold thickness. Higher BMI was associated with decreased energy expenditure and increased energy intake in the study group. To understand the dietary pattern of subject, data on food frequency and food intake was collected and analyzed. The frequency of consumption of various foods is given in Table 4. It is evident from the table that all the respondents consumed rice on every day basis since that was the major staple food followed by ragi and wheat. Among the green leafy vegetables the most frequently used one was the curry leaves followed by coriander leaves and shepu leaves. Onion was reported to be used by all the subjects on daily basis. Milk consumption represented a higher average intake. Butter milk and curd were the other milk products that were found to be used most often. Beverages like tea and coffee were consumed frequently. Vegetables like bitter gourd, brinjal and cluster beans had a very low average consumption rate. Others such as beans, cucumber and cauliflower were found to be used more frequently. Tomato was found being consumed by almost all the study population. Among the processed foods baked products like bun was shown to be consumed by larger number of subjects. Cookies, cake, biscuit and chat items (description of the terms is provided in table) were also found to have a proportionately low average intake. Fruit consumption was found to be moderate and among fruits, banana was more commonly consumed. Flesh foods were consumed occasionally. Details about the average food intake of the subjects per day are shown in Table 5. The average cereal consumption was observed to be 203.4 ± 55.45 g/day. Millet consumption was found to be very lower (78.1 ± 67.6 g/day). Pulse intake was observed to be optimum (55.9 ± 20.6 g/day). Other food groups such as green leafy vegetables, roots and tubers and other vegetables intake were less than 100 g/day. The visible fat intake values (26.7 ± 6.14 g/day) were closer to the values suggested by ICMR in guidelines for healthy eating for Indians [30]. Mean fruit intake was found to be satisfactory. Flesh foods were consumed occasionally. The mean nutrient intake of the subjects belonging to various age groups is presented in Table 6. As can be seen from the table, the protein intake of subjects varied between 47.6-50 g/day, which was slightly lesser than desirable intake of 1.0 g/kg body weight for adult women. Fat intake was observed to be almost similar for all the age groups ranging from 33.0-35.0 g/day representing about 15% of total calorie consumption. There were some variations observed in dietary fiber intake among different groups which was in lower range of desirable intake. Energy intake was slightly higher in older women. However, there were no significant differences between any of these among subjects from different age groups. Calcium intake was relatively high and can be attributed to ragi consumption which is an extremely rich source of calcium (364 mg/100 g) [31]. Iron intake varied between 17.1 and 19.7 mg/day with no groupwise differences. An adequate iron intake is very essential for Indian women on account of high prevalence of iron deficiency anemia. As per the recent National Family Health Survey, the prevalence of anemia among adult women from rural part of Karnataka was 63.6% and urban prevalence rates were slightly lower at 60.7%. Intake of riboflavin and niacin were in similar ranges though differences were seen in thiamin intake. The intake of some nutrients is said to be directly associated with the socio economic status of families. Many a times certain food groups are not consumed either due to the high cost or due to non-availability. Poor households have been estimated to have severe energy deficits. For removing nutritional deprivation in India, it is very important to reduce calorie deficits among the poor households. Existence of a range of nutritional deficiencies has become a greatest concern since long time, particularly of vitamins and minerals. Animal proteins and fats have also assumed greater importance for general nutrition. According to a study by Gopaldas all members of both low as well as middle income suffered with vitamin and mineral deficiencies [32]. The information on the percent nutrient adequacy of the subjects is given in Figure 2. The adequacy and inadequacy of nutrients is the major determinant of the health of an individual. Hence, it is worthwhile to compare the actual intakes to those with the recommended dietary allowances (RDA) and compute adequacy level. The nutrient intakes were compared with the respective RDA for age and the percent adequacy was computed. The data revealed that, the protein intakes were slightly below the adequacy level for the subjects from various age groups, while energy intake was adequate. Fat intake was much higher than the adequacy level for all the age groups. Intake of calcium and B-complex vitamins also reached adequacy levels, though iron intake was insufficient. Diets were also deficient in dietary fiber showing inadequate intake of protective foods like green leafy vegetables. The computed adequacy level of vitamin C was much higher than the RDA. Iron deficiency anemia is a public health problem in India and it can be seen in almost all age groups. The prime cause for it is recognized as iron deficient diets and presence of a large number of iron inhibitors in the diets decreasing the bioavailability. Our earlier studies have also indicated an inadequate intake of dietary iron among women from rural and slum areas [29-33].
Table 1 Demographic characteristics of the subjects (%).
| Occupation |
Household facilities |
Education |
| Housewife |
86.8 |
Own house |
65.8 |
Years of schooling |
% |
| Business |
0.4 |
Rented house |
32.8 |
| Daily wage workers |
2.8 |
Paying mortgage |
1.4 |
0 |
25.6 |
| Factory |
7.8 |
House structure |
1-5 |
5.6 |
| Students |
0.8 |
Permanent |
65.6 |
6-10 |
46.6 |
| Others |
1.4 |
Semi - permanent |
34.4 |
11-12 |
13.2 |
| Family type |
Sources of drinking water |
Graduate |
9 |
| Nuclear |
86.6 |
piped in water |
99.4 |
Sources of fuel |
| Joint |
5.8 |
pump/borewells |
0.6 |
| Extended |
7.6 |
Water storage facility |
Liquid petroleum gas |
91.2 |
| Toilet facility |
plastic pots |
3.6 |
| yes |
98.4 |
steel pots |
14.4 |
stove/kerosene |
8 |
| no |
1.6 |
plastic+steel pots |
82 |
firewood |
0.8 |
| Average household income (Rs. /month) |
Dealing with financial problems? Borrowing money from others? |
If yes, do you have to borrow very frequently |
| <1000 |
95.8 |
| 1000-5000 |
3.8 |
Yes |
53.6 |
Yes |
15 |
| >5000 |
0.4 |
No |
46.4 |
No |
85 |
| Government support system |
Public distribution system |
Involvement in Welfare program |
| - |
Stree shakthi |
43.6 |
| Yes |
13.2 |
43.6 |
Availing loan for house construction |
8.8 |
| No |
6.8 |
56.4 |
Availing loan for constructing toilet |
11.4 |
Table 2 Involvement in agriculture and type of crops grown.
| Parameters and response (percent of subjects) |
Major crops grown |
Percent of subjects (%) |
| Engagement in agriculture |
Yes |
No |
Pulses and Cereals |
12 |
| 13.8 |
86.2 |
Only Pulses |
0.2 |
| Involvement of Household Members |
Fruits |
0.2 |
| Household Head |
Household Head+Spouse |
Household Head+Sibling |
Fruits and Vegetables |
0.2 |
| 6.8 |
6.6 |
0.4 |
Pulses+Cereals+Fruits |
0.6 |
| Equipment used for agriculture |
Plow |
Plow+Tractor |
Pulses+Cereals+Fruits +Vegetables |
0.2 |
| 7.4 |
6.4 |
Pulses+Cereals+Vegetables |
0.4 |
| Details about marketing of agricultural products |
| Percent of produce |
Marketed |
Retained |
Selling of products through |
| 25 |
3.8 |
0.6 |
Direct consumers |
8.4 |
| 50 |
2.2 |
7.2 |
Auction |
1.6 |
| 75 |
7.2 |
2.2 |
Purpose of storing food |
| 100 |
0.6 |
3.8 |
Family consumption |
3.8 |
| Details about Livestock raising (%) |
| Goat |
Sheep |
Hen |
Cow |
Buffalo |
| 6 |
7.8 |
14 |
12.2 |
0.4 |
Table 3 Subjects classified according to nutritional status.
| Indicators |
Age in years |
| 20-25 (n= 131) |
26-30 (n=147 ) |
31-35 (n=91 ) |
36-40 (n= 131) |
| Mean height (cm) |
154.87 ± 5.06 |
155.17 ± 6.15 |
154.60 ± 6.17 |
154.94 ± 5.90 |
| Mean weight (kg) |
51.94 ± 9.24 |
55.39 ± 10.78 |
57.32 ± 10.98 |
60.43 ± 11.74 |
| Grades |
BMI Grading (percent of subjects) |
| 16 |
2.4 |
3.2 |
1.4 |
1 |
| 18.5-22.5 |
13.6 |
11.4 |
6 |
6.2 |
| 23-25 |
7 |
8.2 |
5.4 |
9 |
| 25-30 |
3 |
6 |
4.4 |
7.2 |
| >30 |
- |
0.4 |
0.8 |
2.4 |
| >35 |
0.2 |
0.2 |
0.2 |
0.4 |
| X2 =0.587 |
| Ratio |
Waist-Hip Ratio (percent of subjects) |
| 0.7-0.8 |
11 |
9.6 |
5.8 |
5.6 |
| 0.8-0.9 |
14.4 |
18.2 |
11.2 |
17.8 |
| >0.9 |
0.8 |
1.6 |
1.2 |
2.8 |
| X2=0.851 |
| Percent of standard |
MUAC (percent of subjects) |
| 70-80 |
2.2 |
1.2 |
1.4 |
1.2 |
| 80-90 |
8.4 |
7.6 |
2 |
1.8 |
| >90 |
15.6 |
20.6 |
14.8 |
23.2 |
| X2=0.054 |
Table 4 Mean frequency of daily use of foods (number of subjects).
| Foods |
Mean intake |
Foods |
Mean intake |
Foods |
Mean intake |
Foods |
Mean intake |
| Cereals |
Roots and Tubers |
Other vegetables |
Processed foods |
| Rice |
500 |
Potato |
77.06 |
Bitter gourd |
27.7 |
Gobi manchoorian |
41.4 |
| Wheat |
135.7 |
Carrot |
96.2 |
Bottle gourd |
22.4 |
Bajji |
55.3 |
| Ragi |
308.4 |
Radish |
73.4 |
Brinjal |
20.4 |
Vada |
52.8 |
| Pulses |
Onion |
500 |
Beans |
76.2 |
Bonda |
32.1 |
| Red gram |
114.6 |
Beetroot |
101.3 |
Cauliflower |
76.2 |
Egg puffs |
57.8 |
| Green gram |
56 |
Garlic |
66.6 |
Cluster beans |
12.8 |
Bun |
224.9 |
| Green leafy vegetables |
Milk and its products |
Cucumber |
61.8 |
Puffs |
58.8 |
| Coriander |
241 |
Milk |
219.8 |
Capsicum |
38.1 |
Cookies |
175.5 |
| Spinach |
66 |
Butter milk |
136.9 |
Knol Khol |
20.6 |
Cake |
59.4 |
| Amaranth |
78.4 |
Ghee |
33.8 |
Ladies finger |
41.6 |
Biscuit |
159.1 |
| Shepu |
83.3 |
Curd |
180.06 |
Tomato |
500 |
Pani puri |
78.6 |
| Fenugreek |
66.6 |
Beverages |
Ridge gourd |
42.6 |
Masalapuri |
56.1 |
| Curry |
500 |
Fruit juice |
78.6 |
Tinda |
20.8 |
Jam |
19.3 |
| Mint |
74.1 |
Coffee |
369 |
Drumstick |
19.06 |
Sauce |
7.2 |
| Radish |
79.4 |
Tea |
385 |
Flesh foods |
Fruits |
| Drumstick |
47.2 |
Chocolate |
11.3 |
Meat |
57.4 |
Apple |
20 |
| Cabbage |
44.6 |
- |
- |
Chicken |
49.1 |
Banana |
174.8 |
| - |
- |
- |
- |
- |
- |
Orange |
27.7 |
| Botanical names of legumes and vegetables |
| Ragi |
Eleusine coracana |
Drumstick |
Moringa oleifera |
| Red gram dhal |
Cajanus cajan |
Radish |
Raphanus sativus |
| Green gram |
Phaseolus aureus roxb |
Bitter gourd |
Momordica charantia |
| Coriander leaves |
Coriandrum sativum |
Bottle gourd |
Lagenaria vulgaris |
| Spinach |
Spinacea oleracea |
Brinjal |
Solanum melongena |
| Amaranth leaves |
Amaranthus Gangeticus |
Knol khol |
Brassica oceracea, var.caulorapa |
| Shepu leaves |
Peucedanum graveolens |
| Fenugreek leaves |
Trigonella foenum graecum |
Ladies finger |
Abelmoschus esculentus |
| Curry leaves |
Murraya koenigii |
Ridge gourd |
Luffa acutangula |
| Mint leaves |
Mentha spicata |
Tinda |
Coccinia cordifolia |
| Description of ethnic snacks |
| Gobi manchoorian |
Fried cauliflower seasoned with highly spiced onions, ginger, garlic and soy sauce |
| Bajji |
Deep fried vegetables dipped in chick pea flour |
| Bonda |
Boiled spiced potato balls dipped in chick pea flour batter and deep fried. |
| Vada |
Deep fried savory snack prepared with soaked and ground decorticated legumes. |
| Egg bun |
Boiled and sliced egg stuffed inside the bun |
| Pani puri |
Fried small wheat poories stuffed with boiled potatoes and eaten with finely cut tomatoes, onions and spiced water |
| Masalapuri |
Fried small wheat poories eaten with finely cut tomatoes, onions and spiced chutneys |
Table 5 Average food intake of the subjects per day (g/day).
| Food groups |
Mean ± SD |
Food groups |
Mean ± SD |
| Cereals |
203.4 ± 55.45 |
Other vegetables |
94.8 ±57.33 |
| Millets |
78.1 ±67.68 |
Milk products |
24.5 ±62.3 |
| Pulses |
55.9± 20.67 |
Fats and oils |
26.7 ±6.14 |
| Green leafy vegetable |
49.4± 63.07 |
Sugar |
11.29± 7.85 |
| Roots and tubers |
74.7 ±38.9 |
Fruits |
91.5 ±50.17 |
Table 6 Mean nutrient intake of subjects.
| Nutrients |
Age in years |
| 20-25 |
26-30 |
31-35 |
36-40 |
P-value |
| Protein(g) |
50±11.6 |
49±11.4 |
48.0±10.0 |
47.6± 12.5 |
0.10 ns |
| Fat (g) |
35±16.3 |
33±12.7 |
34.6 ±13.8 |
33.0±15.2 |
0.13 ns |
| Dietary Fiber (g) |
12.0±9.3 |
20.6 ±15.3 |
18.8 12.7± |
16.4 ±12.7 |
5.82 ns |
| Energy (Kcal) |
2079 ±586 |
1950±581 |
2114±608 |
2035±659 |
0.17 ns |
| Calcium (mg) |
705±409 |
605±241 |
625±224 |
603±248 |
0.01** |
| Iron (mg) |
19.7±10.8 |
17.1±6.9 |
18.0±8.8 |
18.1±9.5 |
0.13 ns |
| Thiamin (mg) |
1.34 ±0.6 |
1.29 ±0.4 |
1.77±2.3 |
1.34 ±0.8 |
0.01** |
| Riboflavin (mg) |
0.97 ±0.5 |
1.04±0.7 |
0.99±0.5 |
1.01±0.6 |
0.85 ns |
| Niacin (mg) |
11.53±5.1 |
10.56±4.6 |
12.0±4.9 |
11.7±5.6 |
0.16 ns |
| Vitamin C |
82.3±54.7 |
71.8 ±42.7 |
78.3± 42.1 |
104.8± 81.4 |
3.92 ns |
**Significant differences between the groups, P ≤ 0.01; ns: Not significant.
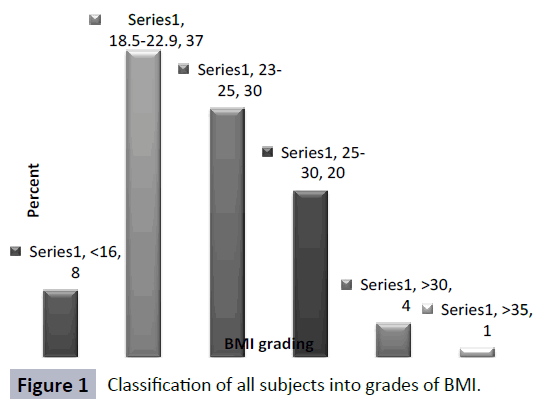
Figure 1: Classification of all subjects into grades of BMI.
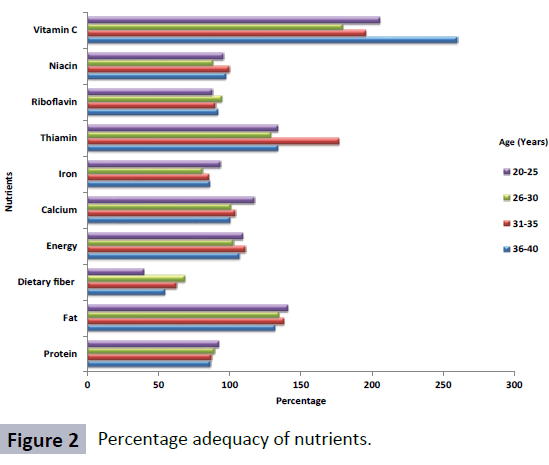
Figure 2: Percentage adequacy of nutrients.
Conclusion
The findings of the study revealed that the majority of the subjects belonged to low income category. Income was found to be the major constraint restricting the adequate access to food which is evident from the present study that majority of subjects showed lower consumption of protective foods in a daily diet. Hence welfare programs have to be implemented in such a way that at least one member in a family should acquire the capacity to earn which enables the families to have adequate access to right amount of food for maintaining health.
Conflict of Interest
Authors have no conflict of interest for the research reported in this paper.
References
- Shetty PS, James WPT (1994) Body Mass Index: A Measure of Chronic Energy Deficiency in Adults.FAO Food and Nutrition paper 56: 1-57.
- WHO (2000) Obesity: preventing and managing the global epidemic. Report of a WHO Consultation (no.894). World Health Organization.
- WHO (2003) Diet, nutrition and the prevention of chronic diseases (No.916).
- Mendez MA, Monteiro CA, Popkin BM (2005) Overweight exceeds underweight among women in most developing countries. Am J Clin Nutr 81: 714-721.
- Monteiro CA, Conde WL, Popkin BM (2004) The burden of disease from undernutrition and overnutrition in countries undergoing rapid nutrition transition: a view from Brazil. Am J Public Health 94: 433-434.
- Drewnowski A, Specter SE (2004) Poverty and obesity: the role of energy density and energy costs. Am J Clin Nutr 79: 6-16.
- USDHHS (2001) The Surgeon General’s call to action to prevent and decrease overweight and obesity. U.S. Department of Health and Human Services, Public Health Service, Office of the Surgeon General, Rockville, MD.
- Mokdad AH, Ford ES, Bowman BA, Dietz WH, Vinicor F, et al. (2003) Prevalence of obesity, diabetes, and obesity-related health risk factors, 2001. J Am Med Assoc 289: 76-79.
- Shukla HC, Gupta PC, Mehta HC, Hebert JR (2002) Descriptive Epidemiology of Body Mass Index of an Urban Adult Population in Western India. J Epidemiol Community Health 56: 876-880.
- Subramanian SV, Smith GD (2006) Patterns, distribution, and determinants of under- and overnutrition: a population based study of women in India. Am J Clin Nutr 84: 633-640.
- Griffiths P, Bentley M (2005) Women of higher socio-economic status are more likely to be overweight in Karnataka, India. Eur J ClinNutr 59: 1217-1220.
- Osmani S, Sen A (2003) The hidden penalties of gender inequality: fetal origins of ill-health. Econ Hum Biol 1: 105-121.
- Monteiro CA, Conde WL, Lu B, Popkin BM (2004) Obesity and inequities in health in the developing world. International journal of obesity 28: 1181-1186.
- Monteiro C, Moura EC, Conde WL, Popkin BM (2004) Socioeconomic status and obesity in adult populations of developing countries: a review. Bulletin of the World Health Organization 82: 940-946.
- Griffiths PL, Bentley ME (2001) The nutrition transition is underway in India. J Nutr 131: 2692-2700.
- Monteiro CA, Conde WL, Popkin BM (2002) Is Obesity, Replacing Undernutrition? Evidence from Different Social Classes in Brazil. Public Health Nutr 5: 105-112.
- Shetty PS (2002) Nutrition Transition in India. Public Health Nutr 5: 175-182.
- Radhakrishna R, Ravi C (2004) Malnutrition in India: Trends and Determinants. Economic and Political Weekly 34: 14-20.
- Radhakrishna R, Hanumantha Rao K, Ravi C, Sambi Reddy B (2004) Chronic Poverty and Malnutrition in 1990s. Economic and Political Weekly 3121-3130.
- Roy TK, Kulkarni S, Vaidehi Y (2004) Social Inequalities in Health and Nutrition in Selected States. Economic and Political Weekly 34: 14-20
- Rao HK, Raghavan V and Rao M (2003) Anthropometry in the assessment of nutritional status. Human Nutrition, (3rd edition), Oxford and IBH publishing company.
- Gopalan C, Ramasastri BV, Balasubramanian SC, Narasinga Rao BS, Deosthale YG, et al. (1996) Nutritive Value of Indian Foods. National Institute of Nutrition Hyderabad.
- ICMR (2010) Nutrient Requirement and Recommended Dietary Allowances for Indians. Indian Council of Medical Research. National Institute of Nutrition, Hyderabad, India.
- Secretariat C (2003) Gender Inequality and Poverty Eradication: Promoting Household Livelihoods. New Gender Mainstreaming Series on Development Issues 107-145.
- HDSA (2003) Human development in South Asia 2003. Oxford: Oxford University Press for Mahbub ul Haq Human Development Centre, Islamabad.
- Life Sciences Research Office: Federation of American Societies of Experimental Biology (1990) Core indicators of nutritional state for difficult-to-sample populations. J Nutr 120: 1559-1599
- Nnakwe N, Yegammai C (2002) Prevalence of food insecurity among households with children in Coimbatore, India. Nutr Res 22: 1009-1016.
- NFHS-4 State fact sheet of Karnataka, International institute for population sciences 2015-2016.
- Prakruthi BS, Prakash J (2013) Nutritional status and dietary pattern of Indian rural women with reference to energy intake and expenditure. J Comm Nutr Health 2: 1-8.
- Manual A (2011) Dietary guidelines for Indians. Nat Inst Nutrition 2: 89-117.
- Longvah T, Ananthan R, Bhaskarachary K, Venkaiah K (2017) Indian Food Composition Tables. National Institute of Nutrition Hyderabad.
- Gopaldas T (2006) Hidden Hunger: The Problem and Possible Interventions. Economic & Political 3671-3674.
- Kulsum A, Lakshmi JA, Prakash J (2009) Dietary adequacy of Indian children residing in an urban slum - Analysis of proximal and distal determinants. Ecology Food Nutr 48: 161-177.