Research Article - (2024) Volume 8, Issue 2
CT-Based Radiomics Nomogram for Preoperative Evaluation of Overall Survival in Intrahepatic Cholangiocarcinoma after Surgical Resection
Yuguo Wei*
Department of Gastroenterology and Hepatology, University in Wuhan, Wuchang, China
*Correspondence:
Yuguo Wei, Department of Gastroenterology and Hepatology, University in Wuhan, Wuchang,
China,
Email:
Received: 15-Jun-2023, Manuscript No. IPJCGH-23-16727;
Editor assigned: 19-Jun-2023, Pre QC No. IPJCGH-23-16727 (PQ);
Reviewed: 03-Jul-2023, QC No. IPJCGH-23-16727;
Revised: 05-Mar-2024, Manuscript No. IPJCGH-23-16727 (R);
Published:
12-Mar-2024, DOI: 10.36648/IPJCGH.8.2.12
Abstract
Purpose: The purpose of this study was to establish a radiomics nomogram based on multi-phase
contrast-enhanced Computed Tomography (CT) for preoperative prediction of Overall Survival (OS) in
Intrahepatic Cholangiocarcinoma (ICC) after resection.
Methods: A cohort of 96 (7:3 in the training and validation cohorts) ICC patients was enrolled in this
study. All patients underwent a preoperative enhanced CT examination and then accepted the ICC
resection. Radiomics features were extracted from Arterial Phase (AP) and Portal Venous Phase (PVP)
contrast-enhanced CT images, respectively. The Least Absolute Shrinkage and Selection Operator
(LASSO) Cox regression was used to select the features. Radiomics and clinical features were
combined to build the nomogram to predict the OS. ICC patients were divided into high and low risk
groups based on cut-off value of the radscore. The Kaplan-Meier analysis and the log-rank test were
applied to analyze the OS difference between different risk groups.
Results: Relative to the prediction of OS in ICC patients, the C-index of the radiomics was 0.869 in the
training and 0.632 in the validation cohort, while the C-index of clinical-nomogram was 0.873 in the
training and 0.628 in the validation cohorts. The C-index of the combined nomogram for the
prediction of OS in ICC patients was 0.912 and 0.696 in the training and validation cohorts,
respectively. The calibration curve indicated that the predicted survival time was close to the actual
survival time. Decision curve analysis showed that the combined nomogram has better clinical
prediction than clinical or radiomics features alone. The combined model showed that the low-risk
group and high-risk group had a significant statistical difference in the OS of both training cohort
(p<0.001) and validation cohort (p=0.01).
Conclusion: The newly developed clinical decision nomogram based on preoperative enhanced CT
radiomics could not only be used to predict the OS of ICC, warn the risk factors affecting the survival
status of ICC patients, but also play a certain role in assisting clinical treatment decision making.
Keywords
Intrahepatic cholangiocarcinoma; Computed tomography; Radiomics; Nomogram; Survival
Introduction
Intrahepatic Cholangiocarcinoma (ICC) arises within the second
order bile duct branches and peripheral branches and accounts
for 5% to 30% of all primary liver malignancies [1-3]. It is a
highly aggressive malignancy associated with high mortality and
increasing global incidence in recent years [4]. Currently,
surgical resection remains the best treatment choice. However,
most ICC patients were usually diagnosed in advanced clinical
stages, and only one third of patients could accept surgical
resection. Unfortunately, the postoperative prognosis was
disappointing, with the five-year survival and OS ranging from
15% to 40% [5]. Meanwhile, Adjuvant Therapy (AT) can only
bring some survival benefits for unresectable patients, but
whether postoperative AT is beneficial to patients after surgical
resection is still controversial [6].
For ICC patients, accurate clinical staging is critical for
predicting survival and selecting treatment options. Many
recent studies have shown that the number of lesions,
vascular invasion (e.g. microvascular or major vascular
invasion), positive surgical margin, and lymph node metastasis
are all important factors in ICC prognosis [7,8]. Therefore,
imaging plays an important role in preoperation diagnosis and
treatment of patients with suspected ICC. Multiphasic
contrast enhanced multi-detector CT has high spatial
resolution and advanced post-processing techniques and has
served as the standard imaging modality for the preoperative
assessment of ICC [9]. Meanwhile, the use of multi-detector
CT can provide a comprehensive assessment and staging
information of the primary tumor, the vascular and lymph
node status, and the presence and extent of tumor invasion
into the adjacent structures. In addition, based on the
qualitative imaging features of ICC on CT, a better prediction
of prognosis was identified in the survival outcomes of
surgical patients [10]. However, the evaluation of these
images is mostly dependent on the physicians, experience,
which will affect the accuracy of the preoperative diagnosis.
Therefore, there is an urgent need for an accurate and
effective diagnostic method with higher clinical applicability
and universality to preoperatively evaluate the OS.
In recent years, radiomics as an emerging and promising field,
has shown discriminating capabilities in the stratification of
tumor histology, tumor grades or stages, prognosis
evaluation, and clinical treatment outcomes by extracting and
mining large numbers of quantitative features from images
[11,12]. In addition, the nomograms have been widely used as
a reliable prediction tool to estimate prognosis in oncology
and medicine by incorporating quantitative risk factors of
clinical events [13]. Therefore, in this study, we extracted
radiomics features from preoperative CT images of ICC in AP
and PVP, respectively. Then, we established a radiomics
nomogram combined with clinical factors to predict the
survival status of ICC patients after resection.
Materials and Methods
Patients
In this retrospective study, we reviewed clinical records, and AP
and PVP contrast-enhanced CT images of ICC patients who
underwent surgical resection between January 2011 and
December 2018. The patients inclusion criteria were as follows:
a) A multiphase enhanced CT examination within 1 month prior
to surgery, b) No anti-tumor treatment received before the CT
examination, c) Confirmed by pathology, d) With wellpreserved
imaging data, and clinical records. The exclusion
criteria were as follows: a) With recurrent ICC; (b) Who
underwent anti-tumor treatments before the contrast
enhanced CT scan; and (c) With partial loss or poor CT images
that could not be used for Region of Interest (ROI) delineation.
According to the above-mentioned inclusion-exclusion criteria,
there were 96 ICC patients recruited. The patients were
randomly split into training (n=68) and validation (n=28)
cohorts in a 7:3 ratio. Clinical information, and radiologic
findings were collected for each patient. Some potential
factors for the prognosis of ICC were obtained, including age,
sex, clinical symptoms, chronic hepatopathy history, Total
Bilirubin (TBIL), Albumin (Alb), Globulin (GLB), Alanine
Aminotransferase (ALT), Aspartate Aminotransferase (AST),
Lymphocyte Count (LYM), neutrophils count, Platelet Count
(PLT), Carcinoembryonic Antigen (CEA), Fetoprotein (AFP),
Carbohydrate Antigen 19-9 (CA19-9), Carbohydrate Antigen
12-5 (CA12-5), growth patterns, number of the lesions,
maximum diameter of the tumor, major vascular invasion,
lymph node metastasis, adjacent organ invasion, distant
metastasis, T stage, survival status. The preoperative serum
CEA (abnormal or normal), AFP (abnormal or normal), CA19-9
(abnormal or normal), CA12-5 (abnormal or normal) were
respectively achieved with the threshold value of 5 ng/ml, 20
u/ml, 37 u/ml, 35 u/ml in our institution. The endpoint of this
study was OS, calculated as the time intervals between the
date of surgery and the date of death or final follow-up. All
patients were followed up until June 2021. The maximum
follow-up time was 46 months (median, 25 months). The TNM
stage of ICC was defined according to the TNM classification
and staging system of the eighth edition by the American Joint
Committee on Cancer (AJCC), which was mainly determined by
surgical and pathological records.
CT Image Acquisition
All enrolled patients underwent contrast enhanced CT. All CT
scans were performed on three CT scanners, including a 16-
slice CT (Toshiba Medical Systems), a 64-slice CT (Revolution
EVO, General Electric Medical Systems), and a 256-slice CT
(Philips Healthcare). CT scans used the same scanning
parameters: Tube voltage of 120 kV, tube current of 125-300
mAs, pitch of 0.6-1.25 mm, slice thickness of 3 mm, and
reconstruction interval of 3 mm. Each patient was bolus
injected (1.5 mL/kg) with the nonionic contrast agent ultravist
300 (Bayer Schering pharma) with a high pressure syringe at
3.0 mL/s. The AP and PVP were scanned at 25 to 35 seconds
and 55 to 75 seconds after injection, respectively.
ROI Segmentation
Before radiomics features extraction, image resampling and
gray level normalization were carried out to standardize
different image specifications [14]. All image data were
resampled to a 1 × 1 × 1 mm voxel space size. The gray scale
was standardized to 64 levels to calculate the radiomics
features.
The segmentation of tumor’s ROI was contoured manually using
ITK-SNAP software (version 3.8.0, http://www.itksnap.org/) [15].
The tumor boundary was outlined on each slice for both axial AP
and PVP images by two abdominal radiologists (J.W., 9 years
experience in abdominal radiology; W.X., more than 20 years
experience in abdominal radiology). The two radiologists were
aware of the final pathologic result, but they were blinded to the
exact pathologic type and TNM stage.
Intra and Inter Observer Agreement
To evaluate the intra and inter observer agreement of
radiomic features extraction, the intra and interclass
correlation coefficients were calculated. 20 random images
were chosen for ROI segmentation by two radiologists (reader
A, 9 years experience in abdominal radiology; reader B, more
than 20 years experience in abdominal radiology) to evaluate
the interobserver agreement. A radiologist (A) repeated the
same procedure in 20 random images two weeks later to
assess the intra-observer agreement [16]. A value of the intra
and interclass correlation coefficients greater than 0.8 was
considered in good agreement.
Feature Extraction and Selection
Radiomics features including firstorder features, shape features,
Gray-Level Co-occurrence Matrix (GLCM) features, Gray Level
Size Zone Matrix (GLSZM) features, Gray Level Run Length
Matrix (GLRLM) features, were extracted from the AP and PVP
CT images separately based on segmented tumor ROIs using the
Artificial Intelligence Kit Version 3.0.1.A (GE Healthcare, China),
which based on pyradiomicss, and complies IBSI [17]. Ultimately,
a total of 293 × 2 radiomics features were calculated and
standardized. For the purpose of dimension reduction, a
univariate cox regression analysis model was used to select the
significant predictors from all the extracted image features. The
correlation analysis between features was adopted, and one of
the features with a correlation higher than 0.9 was retained to
reduce the redundancy. Then, the survival analysis model was
constructed by the Least Absolute Shrinkage and Selection
Operator (LASSO) Cox regression analysis model. For each
patient, a radiomics score (radscore) was produced using a
linear combination of selected features that were weighted by
their coefficients [18].
Construction of the Radiomicss Nomogram and its
Performance
For clinical data, the univariate Cox regression analysis model
was first used to select the significant predictors. Then, the
multivariate Cox regression analysis model was adopted to
develop the clinical survival analysis model.
The radscore from the radiomics model and predictors from
the clinical survival model were used to construct the
radiomics nomogram. In the training and validation cohorts,
Harrell's C index was calculated to evaluate the predictive
performance of the radiomics nomogram. The C-index is a
number that varies from 0.5 to 1.0, with 0.5 denoting a
random data distribution and 1.0 denoting that the model's
results correctly match the observed survival data. Also, the
radiomics nomogram calibration curves of the patient's 3-
years OS were drawn [19]. The calibration curve showed the
difference between the observed probabilities and the
survival probability predicted by the nomogram. A decision
curve was also applied to determine the clinical practicability
of radiomicss nomogram by quantifying the net benefits
under different threshold probabilities. The specific research
process was shown in Figure 1.

Figure 1: The workflow of model development.
Statistical Analysis
All statistical analyses were performed using the R software
(version 4.0.2, www.r-progject.org) and Python (version 3.5.6).
Mann-Whitney U test and χ2 test were used to determine
whether there was a significant difference in the values of
clinical-pathologic variables. A two-tailed p-value <0.05
indicated statistical significance. The Kaplan-Meier analysis and
a log-rank test were used to analyze the survival time and the
difference between the patients from the high risk group and
the low-risk group, in the training and the validation sets
respectively.
Results
Clinical Characteristics
The demographic and clinical characteristics of patients in the
training and validation cohorts are summarized in Table 1,
which indicated the distribution of all clinical characteristics
were similar between the training and validation cohorts.
There were significant differences in age, clinical symptoms,
Alb, CEA, CA 12-5, major vascular invasion, size, TNM stage,
OS, and radscore between the survived and died cohorts
(p<0.05).
| Variable |
Training (n=68) |
Validation (n=28) |
Total (n=96) |
p-value |
| Age (y), mean (sd) (%) |
60.710 (10.290) |
62.180 (8.190) |
61.135 (9.685) |
0.5 |
| Sex (%) |
|
| Male |
37 (54.412) |
15 (53.571) |
52 (54.167) |
|
| Female |
31 (45.588) |
13 (46.429) |
44 (45.833) |
1 |
| Clinical symptoms (%) |
|
| Asymptomatic |
38 (55.882) |
21 (75.000) |
59 (61.458) |
|
| Symptomatic |
30 (44.118) |
7 (25.000) |
37 (38.542) |
0.08 |
| Chronic hepatopathy (%) |
53 (77.941) |
20 (71.429) |
73 (76.042) |
|
| Absent |
53 (77.941) |
20 (71.429) |
73 (76.042) |
|
| Hepatitis B associated liver cirrhosis |
10 (14.706) |
6 (21.429) |
16 (16.667) |
|
| Schistosomiasis cirrhosis of liver |
4 (5.882) |
2 (7.143) |
6 (6.250) |
|
| Primary biliary cirrhosis |
1 (1.471) |
0 (0.000) |
1 (1.042) |
0.775 |
| TB (u mol/L), mean (sd) |
27.025 (50.624) |
31.039 (72.827) |
28.196 (57.603) |
0.757 |
| Alb (g/L), mean (sd) |
43.637 (4.838) |
43.161 (6.499) |
43.498 (5.344) |
0.693 |
| GLB, (g/L), mean (sd) |
28.207 (4.093) |
30.936 (9.901) |
29.003 (6.421) |
0.055 |
| ALT, (IU/L), mean (sd) |
37.706 (53.485) |
38.429 (73.726) |
37.917 (59.687) |
0.957 |
| AST, (IU/L), mean (sd) |
40.088 (59.024) |
31.714 (33.690) |
37.646 (52.861) |
0.482 |
| LYM, (109/L), mean (sd) |
1.573 (0.657) |
1.661 (0.594) |
1.599 (0.638) |
0.543 |
| Neutrophils (109/L), mean (sd) |
4.273 (1.950) |
4.068 (1.551) |
4.213 (1.837) |
0.62 |
| PLT, (109/L), mean (sd) |
203.676 (88.400) |
194.857 (70.485) |
201.104 (83.304) |
0.639 |
| CEA (u/ml) |
| ≤ 5 |
48 (70.588) |
18 (64.286) |
66 (68.750) |
|
| >5 |
20 (29.412) |
10 (35.714) |
30 (31.250) |
0.716 |
| AFP (u/ml) |
| ≤ 20 |
63 (92.647) |
27 (96.429) |
90 (93.750) |
|
| >20 |
5 (7.353) |
1 (3.571) |
6 (6.250) |
0.817 |
| CA199 (u/ml) |
| ≤ 37 |
31 (45.588) |
14 (50.000) |
45 (46.875) |
|
| >37 |
37 (54.412) |
14 (50.000) |
51 (53.125) |
0.866 |
| CA125 (u/ml) |
| ≤ 35 |
46 (67.647) |
22 (78.571) |
68 (70.833) |
|
|
22 (32.353) |
6 (21.429) |
28 (29.167) |
0.41 |
| Growth patterns |
| Mass-forming |
53 (77.941) |
25 (89.286) |
78 (81.250) |
|
| Periductal infiltrating |
12 (17.647) |
3 (10.714) |
15 (15.625) |
|
| Intraductal growth |
3 (4.412) |
0 (0.000) |
3 (3.125) |
0.34 |
| Number |
| One |
55 (80.882) |
18 (64.286) |
73 (76.042) |
|
| Two |
6 (8.824) |
3 (10.714) |
9 (9.375) |
|
| More than two |
7 (10.294) |
7 (25.000) |
14 (14.583) |
0.155 |
| Size (cm), mean (sd) |
5.328 (2.016) |
5.368 (2.801) |
5.34 (2.257) |
0.938 |
| Adjacent organ invasion |
| Absent |
65 (95.588) |
27 (96.429) |
92 (95.833) |
|
| Present |
3 (4.412) |
1 (3.571) |
4 (4.167) |
1 |
| Major vascular invasion |
| Absent |
39 (57.353) |
21 (75.000) |
60 (62.500) |
|
| Present |
29 (42.647) |
7 (25.000) |
36 (37.500) |
0.164 |
| Lymphatic metastasis |
| Absent |
53 (77.941) |
25 (89.286) |
78 (81.250) |
|
| Present |
15 (22.059) |
3 (10.714) |
18 (18.750) |
0.314 |
| Distant metastasis |
| Absent |
67 (98.529) |
27 (96.429) |
94 (97.917) |
|
| Present |
1 (1.471) |
1 (3.571) |
2 (2.083) |
1 |
| TNM |
|
| Ⅰ |
28 (41.176) |
12 (42.857) |
40 (41.667) |
|
| Ⅱ |
17 (25.000) |
10 (35.714) |
27 (28.125) |
|
| Ⅲ |
22 (32.353) |
5 (17.857) |
27 (28.125) |
|
| Ⅳ |
1 (1.471) |
1 (3.571) |
2 (2.083) |
0.436 |
| OS (month), mean (sd) |
22.853 (13.371) |
21.207 (11.126) |
22.373 (12.722) |
0.566 |
| Radscore |
0 (1.181) |
0.126 (1.532) |
0.037 (1.286) |
0.663 |
Table 1: Clinical characteristics of the training and validation cohorts.
Intra and Inter Observer Agreement
The intra observer consistency showed the intra class
correlation coefficients was 0.850, and the inter observer
correlation coefficients was 0.838. The results showed good
intra- and inter observer agreement of the feature extraction.
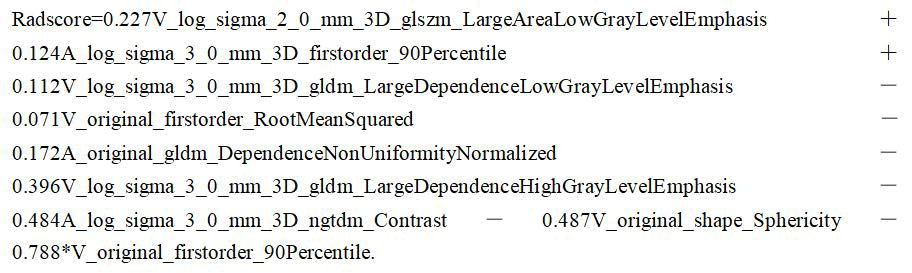
Important Radiomics Feature Selection and Radiomics
Signature Construction
Totally, 293 × 2 radiomics features were extracted from AP
and PVP CT images separately. We used the LASSO regression
model for feature selection (Figures 2A and 2B). Finally, nine
important features were selected as follows (Figure 2C).

Figure 2: The optimal subset of radiomics features were
extracted as shown. (A) The hyperparameter/lambda was
determined using the partial likelihood deviation as the
standard. (B) The optimization/lambda (vertical dotted line)
was utilized to choose the features with non-zero coefficients.
(C) The LASSO algorithm chose nine radiomics features that
contributed the most to the prognosis prediction model.
Then the radscore were calculated as follows:
The Kaplan-Meier analysis of the radiomics model was plotted
to analyze the survival time between the patients from the
high-risk group and the low-risk group in the training and validation sets, respectively. The results of the log rank test
showed that there were significant differences between the
two risk groups in the training set (p<0.01, log-rank test), but
a trend to a significant result in the validation set (p=0.056,
log-rank test).
Development of the Combined Nomogram and its
Evaluation Performance
For all clinical data, we used the univariate Cox regression
analysis model to select the significant predictor with P<0.05,
and then utilized the multivariate Cox regression
analysis model to construct the clinical nomogram (Figure
3A). The Kaplan-Meier curve showed that the combined
model could effectively distinguish between high and lowrisk
patients in the test cohort (p<0.0001, log-rank test)
(Figure 3B), but there was no statistical significance
between low and high-risk group in the validation cohort
(Figure 3C, p=0.31, log-rank test), which could be attributed
to overfitting.

Figure 3: (A) A clinical logistic regression model for prediction
of 1-3 years overall survival for ICC patients. (B) The Kaplan-
Meier curve showed that the model could effectively
distinguish between high and low-risk patients in test cohort
(p<0.0001, log-rank test), (C) But there was no statistical
significance in validation cohort (p=0.31, log-rank test).
Combining the radscore with the clinically significant
predictors, a combined model was constructed based on
multivariate Cox regression analysis (Figure 4A). In the
training and validation cohorts, the C index of the combined
model was 0.912 and 0.696, respectively (Table 2). The
Kaplan-Meier curve demonstrated that the model score
could effectively distinguish between high and low-risk
patients in both the train cohort (Figure 4B, p<0.0001, logrank
test) and validation cohort (Figure 4C, p=0.01, log-rank
test). The result of calibration curve indicated that the
predicted probability was very close to the actual survival
time of ICC patients (Figure 4D). The decision curve
analysis showed that thecombined nomogram was better
than the radiomics and clinical models and had a higher
overall net benefit (Figure 4E).

Figure 4: (A) A combined logistic regression model for prediction
of 3 years overall survival for ICC patients. The Kaplan-Meier
curve showed that the model could effectively distinguish
between high and low-risk patients in test cohort (B) p<0.0001,
log-rank test and validation cohort (C) p=0.01, log-rank test. (D)
The result of calibration curve showed that the prediction
probability was very close to the actual survival time of patients.
(E) The decision curve analysis of each model showed that the
combined nomogram was better than radiomics and clinical
model, and had a higher overall net benefit.
| C-index |
| |
Training set |
Test set |
| Radiomics |
0.869 (se=0.026) |
0.632 (se=0.072) |
| Clinical |
0.873 (se=0.026) |
0.628 (se=0.073) |
| Combined |
0.912 (se=0.018) |
0.696 (se=0.067) |
Table 2: The comparison of prognostic accuracy between the combined model and two other prediction models.
Discussion
ICC is the second most prevalent malignancy of primary liver
cancer, only second to hepatocellular carcinoma [20].
Although its incidence is increasing in many geographic
regions, its prognosis is generally poor, with a high rate of
postoperative recurrence and high mortality [21]. In this
study, we developed a combined model based on AP and PVP
CT radiomics features combined with clinical factors to
preoperative predict OS in patients with ICC after resection,
with the aim of helping identify the patient who might benefit
most from the surgical methods and guide personalized
treatment.
In our study, the radiomics nomogram had a good predictive
effect on the survival results of ICC patients, with the C-index
0.912 and 0.696 in the training and the validation set
respectively. The results of this study indicated that compared
with clinical features, radiomics signature was of great
significance in evaluating the internal characteristics of
tumors. It also indicated the potential of radiomics in
predicting the survival outcome of preoperative ICC. We also found independent risk factors related to postoperative
survival of ICC. Our combined model indicated that radscore
and several clinical variables, including clinical symptoms, ALT,
PLT, CEA, and TNM stages, were independent predictors of OS.
The clinical characteristics of the survival and death cohorts
highly suggested that radscore and some clinical factors,
including clinical symptoms, CEA, and TNM stages, were
closely related to the survival status of ICC patients after
surgery.
Currently, surgery is still the first-line treatment for ICC, and it
is also the best cure opportunity for ICC. However, most ICC
patients usually had no symptoms in the early stages. When
they developed symptoms such as abdominal pain, fatigue,
malaise, and biliary obstruction, they were already in the
advanced stage [19,22]. Our study also showed that the
prognosis of ICC patients with first clinical symptoms was
poor, which might be related to the poor physical condition
and the late stage or metastasis of tumor.
Tumor markers are well-established tools for assisting in
diagnosis, predicting prognosis, and detecting recurrence
[23,24]. In our study, we found that serum biomarkers Alb, CEA, and CA125 were related to the prognosis of patients.
Among them, the level of Alb was considered to be the most
important factor in assessing liver reserve, and decreased Alb
indicated hepatocyte damage. According to a literature
review, hypoproteinemia was an independent risk factor for
increasing mortality and complications in critically ill patients
[25]. Also, some studies found that hypoalbuminemia was
associated with low survival in ICC patients [26], which was
consistent with our research. As for tumor markers, it was
considered that serum CA125 might have better clinical
application in adenocarcinoma. A recent study has shown that
preoperative serum CA125 could be used to predict the
prognosis of hilar cholangiocarcinoma after radical resection
[27]. A previous study showed that higher levels of CA19-9
and CEA were related to the advanced TNM stages and poor
prognosis of ICC patients [28]. Nevertheless, there were some
contradicting studies [29,30], a meta-analysis indicated that
serum tumor markers did not help predict postoperative
prognosis in patients with ICC [31]. But we also found the
serum CA19-9 had no significant contribution in the clinical
model and combined model.
Recently, several preoperative prediction models based on
pretreatment enhanced CT have been developed for ICC
patients, especially those who have undergone curativeintent
resection, which suggested that artificial intelligence
based on enhanced CT images had potential value in
predicting the prognosis of some human diseases [32-34]. In
addition, additional information extracted from radiomics can
reveal the spatial heterogeneity within tumors and can be
used to predict tumor type, tumor stage and prognosis [35].
Our study also found that the prognosis of patients with a
high TNM stage was poor, and previous studies have
confirmed that tumor size, multiple tumors, lymph node
metastasis, vascular infiltration and poor tumor
differentiation were related to the prognosis of ICC. Our
findings have revealed more preoperative independent
predictors of ICC, with clinical symptoms, ALT, and PLT not
mentioned in other radiomics based studies. Our results also
indicated that patients classified as high-risk group had higher
risk of death events and worse prognosis than patients in lowrisk
group. These findings were consistent with previous
radiomics studies [36]. Therefore, preoperative prediction of
survival in ICC patients may facilitate clinical decision making.
In this case, the prediction models and nomograms proposed
in clinical practice or future clinical trials may help to identify
the optimal candidates for surgery or high-risk patients.
Our study had several limitations. First, this study used a small
sample and a retrospective design, so there may be potential
selection bias. Moreover, the sample size was not large
enough which alse caused the problem of overfitting in the
test cohort. Second, this study was conducted in a single
center. Both the overfitting problem and the single center
study need the external validation using retained testing
datasets or datasets from other hospital’s to evaluate the
predictive performance [37]. Third, there is no stratified
analysis of some clinical indicators of ICC patients pre- and
post- operation, such as preoperative CA 19-9 level,
postoperative AT, prediction of postoperative tumor recurrence, which may lead to some discrepancies. In the
follow-up study, we will increase the sample size, conduct
multicenter and prospective researches, and design hierarchical
analysis of relevant clinical, pathological, and radiomicss
features in order to obtain more conclusive data on the
prognosis of ICC patients.
Conclusion
In conclusion, a radscore based on enhanced CT combined
with clinicopathological factors can predict the postoperative
survival outcomes of ICC patients. The prediction result of the
radiomicss nomogram might contribute to clinical decision
making and identify the subgroups of patients who benefit
most from surgery.
Author's Contributions
All authors contributed to the study conception and design.
Material preparation, data collection and analysis were
performed by WJ, MH, XZ, XW and ZX. The first draft of the
manuscript was written by WJ and all authors commented on
previous versions of the manuscript. All authors read and
approved the final manuscript.
Funding
This study was funded by the horizontal project of Zhejiang
university (Grant No. K-20212766).
Data Availability
The datasets analyzed in this study are available from the
corresponding author on request.
Conflict of Interest
The authors declare that they have no competing interests.
Ethical Approval
All procedures performed in the study were in accordance
with the Helsinki declaration and guidelines. The Clinical
Research Ethics of the First Affiliated Hospital, Zhejiang
University School of Medicine approved this retrospective
study.
Consent to Participate
The requirement for patient informed consent was waived
due to its retrospective nature.
Consent for Publication
All authors have read, reviewed, and approved of this
manuscript for publication in its present form.
References
- Krasinskas AM (2018) Cholangiocarcinoma. Surg Pathol Clin. 11(2):403-429.
[Crossref] [Google Scholar] [PubMed]
- Liver cancer study group of Japan (1990) Primary liver cancer in Japan: Clinicopathologic features and results of surgical treatment. Ann Surg. 211(3):277-287.
[Google Scholar] [PubMed]
- Kaczynski J, Hansson G, Wallerstedt S (1998) Incidence, etiologic aspect and clinicopathologic features in intrahepatic cholangiocellular carcinoma-A study of 51 cases from a low-endemicity area. Acta Oncol. 37(1):77-83.
[Crossref] [Google Scholar] [PubMed]
- Spolverato G, Vitale A, Cucchetti A (2015) Can hepatic resection provide a long term cure for patients with intrahepatic cholangiocarcinoma? Cancer. 121(22):3998-4006.
[Crossref] [Google Scholar] [PubMed]
- Bridgewater J, Galle PR, Khan SA, Llovet JM, Park JW, et al. (2014) Guidelines for the diagnosis and management of intrahepatic cholangiocarcinoma. J Hepatol. 60(6):1268-1289.
[Crossref] [Google Scholar] [PubMed]
- Chun YS, Javle M (2017) Systemic and adjuvant therapies for intrahepatic cholangiocarcinoma. Cancer Control. 24(3).
[Crossref] [Google Scholar] [PubMed]
- Lee AJ, Chun YS (2018) Intrahepatic cholangiocarcinoma: The AJCC/UICC 8th edition updates. Chin Clin Oncol. 7(5):52.
[Crossref] [Google Scholar] [PubMed]
- Hwang S, Lee YJ, Song GW, Park KM, Kim KH, et al. (2015) Prognostic impact of tumor growth type on 7th AJCC staging system for intrahepatic cholangiocarcinoma: A single-center experience of 659 cases. J Gastrointest Surg. 19(7):1291-1304.
[Crossref] [Google Scholar] [PubMed]
- Joo I, Lee JM, Yoon JH (2018) Imaging diagnosis of intrahepatic and perihilar cholangiocarcinoma: Recent advances and challenges. Radiol. 288(1):7-13.
[Crossref] [Google Scholar] [PubMed]
- Aherne EA, Pak LM, Goldman DA, Gonen M, Jarnagin WR, et al. (2018) Intrahepatic cholangiocarcinoma: can imaging pheno-types predict survival and tumor genetics? Abdom Radiol (NY). 43(10):2665-2672.
[Crossref] [Google Scholar] [PubMed]
- Parmar C, Grossmann P, Bussink J, Lambin P, Aerts HJ (2015) Machine learning methods for quantitative radiomics biomarkers. Sci Rep. 5:13087.
[Crossref] [Google Scholar] [PubMed]
- Yang CM, Shu J (2021) Cholangiocarcinoma evaluation via imaging and artificial intelligence. Oncol. 99(2):72-83.
[Crossref] [Google Scholar] [PubMed]
- Balachandran VP, Gonen M, Smith JJ, deMatteo RP (2015) Nomograms in oncology: More than meets the eye. Lancet Oncol. 16(4):e173–e180.
[Crossref] [Google Scholar] [PubMed]
- Huynh E, Coroller TP, grawal V, Hou Y, Hou Y, et al. (2016) CT-based radiomics analysis of stereotactic body radiation therapy patients with lung cancer. Radiother Oncol. 120(2):258-266.
[Crossref] [Google Scholar] [PubMed]
- Yushkevich PA, Piven J, Hazlett, HC, Hazlett HC, Smith RG, et al. (2006) User-guided 3D active contour segmentation of anatomical structures: Significantly improved efficiency and reliability. NeuroImage. 31(3):1116-1128.
[Crossref] [Google Scholar] [PubMed]
- Guo Y, Chen X, Lin X, Chen L, Shu J, et al. (2021) Non-contrast CT-based radiomic signature for screening thoracic aortic dissections: A multicenter study. Eur Radiol. 31(9):7067-7076.
[Crossref] [Google Scholar] [PubMed]
- Griethuysen JJM, Fedorov A, Parmar C, Hosny A, Aucoin N, et al. (2017) Computational radiomicss system to decode the radiographic phenotype. Cancer Research 77(21): e104-e107.
[Crossref] [Google Scholar] [PubMed]
- Huang YQ, Liang CH, He L, Tian J, Liang CS, et al (2016) Development and validation of a radiomicss nomogram for preoperative prediction of lymph node metastasis in colorectal cancer. J Clin Oncol 34(18):2157-2164.
[Crossref] [Google Scholar] [PubMed]
- Yang L, Yang J, Zhou X, Huang L, Zhao W, et al. (2019) Development of a radiomicss nomogram based on the 2D and 3D CT features to predict the survival of non-small cell lung cancer patients. Eur Radiol 29(5):2196–2206.
[Crossref] [Google Scholar] [PubMed]
- Granata V, Grassi R, Fusco R (2021) Intrahepatic cholangiocarcinoma and its differential diagnosis at MRI: How radiologist should assess MR features. Radiol Med. 126:1584-1600.
- Jin KP, Sheng RF, Yang C, Zeng MS (2022) Combined arterial and delayed enhancement patterns of MRI assist in prognostic prediction for Intrahepatic Mass-forming Cholangiocarcinoma (IMCC). Abdom Radiol (NY). 47(2):640-650.
[Crossref] [Google Scholar] [PubMed]
- Blechacz B (2017) Cholangiocarcinoma: Current knowledge and new developments. Gut Liver 11(1):13-26.
[Crossref] [Google Scholar] [PubMed]
- Fang T, Wang H, Wang Y, Lin X, Cui Y, et al. (2019) Clinical significance of preoperative serum CEA, CA125, and CA19-9 levels in predicting the resectability of cholangiocarcinoma. Dis Markers 2019:6016931.
[Crossref] [Google Scholar] [PubMed]
- Moro A, Mehta R, Sahara K, Tsilimigras DI, Paredes AZ, et al. (2020) The impact of preoperative ca19-9 and cea on outcomes of patients with intrahepatic cholangiocarcinoma. Ann Surg Oncol. 27(8):2888-2901.
[Crossref] [Google Scholar] [PubMed]
- Wen J, Chen X, Wei S, Ma X, Zhao Y (2022) Research progress and treatment status of liver cirrhosis with hypoproteinemia. Evidence based complementary and alternative medicine. 2245491.
[Crossref] [Google Scholar] [PubMed]
- Li H, Wu JS, Wang XT, Lv P, Gong LS, et al. (2014) Factors predicting surgical resection in patients with intrahepatic cholangiocarcinoma and cirrhosis. J Invest Surg 27(4):219-225.
[Crossref] [Google Scholar] [PubMed]
- Xu ZL, Ou Y, Dai HS, Wan K, Bie P, et al. (2021) Elevated preoperative CA125 levels predicts poor prognosis of hilar cholangiocarcinoma receiving radical surgery. Clin Res Hepatol Gastroenterol 45(6):101695.
[Crossref] [Google Scholar] [PubMed]
- Tian M, Liu W, Tao C, Tang Z, Zhou Y, et al. (2020) Prediction of overall survival in resectable Intrahepatic cholangiocarcinoma: ISICC-applied prediction model. Cancer Sci. 111(4):1084-1092.
[Crossref] [Google Scholar] [PubMed]
- Loosen SH, Roderburg C, Kauertz KL, Koch A, Vucur M, et al. (2017) CEA but not CA19-9 is an independent prognostic factor in patients undergoing resection of cholangiocarcinoma. Sci Rep. 7(1):16975.
[Crossref] [Google Scholar] [PubMed]
- Bergquist JR, Ivanics T, Storlie CB, Groeschl RT, Tee MC, et al. (2016) Implications of CA19-9 elevation for survival, staging, and treatment sequencing in intrahepatic cholangiocarcinoma: A national cohort analysis. J Surg Oncol. 114(4):475-482.
[Crossref] [Google Scholar] [PubMed]
- Mavros MN, Economopoulos KP, Alexiou VG, Pawlik TM (2014) Treatment and prognosis for patients with intrahepatic cholangiocarcinoma: Systematic review and meta-analysis. JAMA Surg. 149(6):565-574.
[Crossref] [Google Scholar] [PubMed]
- Chu H, Liu Z, Liang W, Zhou Q, Zhang Y, et al. (2021) Radiomics using CT images for preoperative prediction of futile resection in intrahepatic cholangiocarcinoma. Eur Radiol. 31(4):2368-2376.
[Crossref] [Google Scholar] [PubMed]
- Park HJ, Park B, Park SY, Choi SH, Rhee H, et al. (2021) Preoperative prediction of postsurgical outcomes in mass-forming intrahepatic cholangiocarcinoma based on clinical, radiologic, and radiomics features. Eur Radiol. 31(11):8638-8648.
[Crossref] [Google Scholar] [PubMed]
- Tang Y, Zhang T, Zhou X, Zhao Y, Xu H, et al. (2021) The preoperative prognostic value of the radiomics nomogram based on CT combined with machine learning in patients with Intrahepatic cholangiocarcinoma. World J Surg Oncol. 19(1):45.
[Crossref] [Google Scholar] [PubMed]
- King MJ, Hectors S, Lee KM, Omidele O, Babb JS, et al. (2020) Outcomes assessment in intrahepatic cholangiocarcinoma using qualitative and quantitative imaging features. Cancer Imaging 20(1):43.
[Crossref] [Google Scholar] [PubMed]
- Zhang J, Wu Z, Zhang X, Liu S, Zhao J, et al. (2020) Machine learning: an approach to preoperatively predict PD-1/PD-L1 expression and outcome in intrahepatic cholangiocarcinoma using MRI biomarkers. ESMO Open. 5(6):e000910.
[Crossref] [Google Scholar] [PubMed]
- Luo Y, Chen S, Valdes G (2020) Machine learning for radiation outcome modeling and prediction. Med Phys. 47(5):e178-e184.
[Crossref] [Google Scholar] [PubMed]
Citation: Wei Y (2024) CT-Based Radiomics Nosmogram for Preoperative Evaluation of Overall Survival in Intrahepatic
Cholangiocarcinoma after Surgical Resection. J Clin Gastroenterol Hepatol. 8:12.
Copyright: © 2024 Wei Y. This is an open-access article distributed under the terms of the Creative Commons Attribution
License, which permits unrestricted use, distribution, and reproduction in any medium, provided the original author and source
are credited.