Introduction
Cocaine addiction is a disorder characterized by repeated selfadministration of cocaine despite aversive consequences. Because self-administration is a decision, a great deal of work has focused on the sources of decision-making biases that maintain addictions (Lucantonio et al., 2012) [1]. A large body of work suggests that the loss of executive, top-down control over behavior is the primary mechanism underlying the decisionmaking biases in cocaine addiction (Bechara, 2005; Everitt et al., 2008; Iacono et al., 2008) [2, 3, 4]. One of the most valuable tools in documenting these impairments has been the delay discounting task, which measures participants’ preference for smaller-sooner rewards compared to larger-later rewards. Because cocaine users generally prefering smaller-sooner rewards compared to controls this has been interpreted as indicating impatience and impulsivity rather than considered reflection and the ability to represent long-term gains (Johnson et al., 2007) [5]. Underlying this interpretation of the data has been the practice, adapted from economics, of using a single parameter, in this case a hyperbolic, function to summarize participants’ preferences and interpreting the parameter narrowly as time preference or a discounting rate and therefore impulsivity (Coffey et al., 2003; Heil et al., 2006; Kirby and Petry, 2004) [6,7,8]. However this approach overlooks another important decision-making bias in cocaine users.
Imaging studies and psychopharmacological studies have highlighted the importance of deficits in reward processing circuits in addiction. While hypersensivity to reward may be a vulnerability to the development of addiction (Flagel et al., 2010) [9], reward sensitivity and increased requirements for reward may characterize addiction (Volkow et al., 2010) [10]. Further, the decreased sensitivity is a response not only to drug, but also to monetary rewards (Parvaz et al., 2012; Goldstein et al., 2007) [11,12]. Thus, the dysfunction in reward sensitivity can be vulnerability or a result of reward associated learning (Volkow et al., 2010) [10]. Furthermore, individual differences in reward valuation are known to affect delay discounting curves (Ballard and Knutson, 2009; Kable and Glimcher, 2010; McClure et al., 2004; Peters and Büchel, 2009) [13,14,15,16]. This work suggests that delay discounting choices reflect not only discounting but also reward sensitivity. The current study is therefore designed to assess the importance of this heretofore neglected influence on decisions made in this paradigm generally interpreted as a measure of impulsivity. The study will also be able to examine convergence with risky decisions without a temporal component, how these parameters relate to addiction severity, and whether these impairments are characteristic of other putative impulsive disorders, such as binge & eating disorder.
Deficits in Executive Controls and Hyperbolic Model
Impulsivity, and its behavioral correlates (i.e. inattention, behavioral disinhibition, and impulsive decision making), has been conceptualized as a major pathway of developing drug addiction (Iacono et al., 2008, 2003; Dalley et al., 2007; Diergaarde et al., 2008) [17,18,19]. Using hyperbolic model, the delay discounting task has been widely used as an assessment for impulsive decision making, especially in the substance use literature (Johnson et al., 2007) [5]. The hyperbolic discounting function refers to a decrease in discounting rate when the delay is increased (Green & Myerson, 2004) [20]. The discounting rate is steep when the delay is relatively short, and it is shallow when the delay is relatively long. This function can be represented by the following formula:

In this classic formula, V refers to the subjective value of a delayed outcome, A represents the objective amount of the delayed outcome, d refers to the delay time for the outcome, and k represents the delay discounting rate (Mazur, 1987) [21]. A higher k means there is a steeper discounting function and stronger preference for more immediate and smaller outcome (or greater impulsivity). This model supposes that individuals have the same immediate valuation of the objective reward choices and this value is discounted when processing different delays. This function has been found to fit reasonably well in both human and animal studies (Kirby and Santiesteban, 2003; Madden et al., 1999) [22,23].
Deficits in Reward Processing and Individual Difference in Reward Valuation
As noted earlier, decreased reward sensitivity is another hypothesized underlying mechanism associated with addiction (Volkow et al., 2010) [10]. The decreased sensitivity is associated with the hypodopaminergic state and decreased valuation of non-drug reinforcers (Volkow et al., 2010; Goldstein et al., 2007; Volkow et al., 2012) [10,12,24]. How individual values a reinforcer may depend on specific reinforcement learning systems, which include Pavlovian association (only assign values to a small set of response), habitual response (assign values to many actions through learning), and goal-directed decision systems that is flexible and open to changes in environment (Rangel et al., 2008) [25]. In this context, previous studies have indicated that habitual learning is important in drug addiction. A Pavlovian association between stimulus and response can become habitual with training over time through the hedonic effect of repeated drug use, impact on neuropharmacological level, and neural circuits (Cardinal et al., 2003; Everitt and Robbins, 2005; Niv et al., 2006) [26,27,28]. This change may also represent the transition between initial drug use and drug addiction (Everitt, & Robbins, 2005) [27].
Two Decision Components and Two-Parameter Models
Animal studies suggested that both genetic vulnerability to behavioral disinhibition and sensitivity to reward related cues are associated with development of addictions (Flagel et al., 2010) [9]. Dopamine receptor activation and valuation bias are also thought to be involved (Van Gaalen et al., 2006) [29]. Given increased evidence about connections between these domains, two parameter models of delay discounting may need to be more nuanced, allowing differentiation between the decision factor associated with valuation of reward (monetary utility) and the factor associated with discounting due to time delay (Ballard and Knutson, 2009; Kable and Glimcher, 2010; McClure et al., 2004; Peters and Büchel, 2009) [13, 14, 15, 16].
Doya’s review (Doya, 2008) [30] of decision making models considered both executive control and valuation biases in describing delay discounting. Specifically, he showed that the valuation of reward or reward utility follows a saturating function which can be used to reflect a decrease of the valuation of the reinforcer due to habitual learning in addition to any impact of differences in discounting. A higher saturation index means a lower subjective value given an objective amount, indicating a higher threshold for feeling satisfied and therefore a higher demand of objective reward. For example, a high grade on a paper would be less rewarding for a strong student compared to an average student because strong students generally are used to and expect to have high grades (i.e. have a higher saturation index for the value of a grade). The equation for the saturating function is listed below, where A is the amount of the objective reward, and Q (saturation index) determines the amount with which the utility curve saturates:

Further, the saturation index can be combined with a hyperbolic function to incorporate the discounting associated with time delay (Doya, 2008) [30], such that the contributions of discounting and valuation bias to the subjective value (V) can be parsed:

To differentiate the discounting parameter in this model (k) from the delay discounting rate in the standard hyperbolic model, we will refer the discounting parameter in this model as the “time discounting parameter”. It should be noted that this saturatinghyperbolic model is a generalization of the hyperbolic model. It reduces to the hyperbolic model when Q = 0. However, when Q > 0, the delay discounting curve starts at a value that is lower than the objective reward and produces a shallower curve than the hyperbolic model when the delay is relatively long. Therefore, this saturating-hyperbolic model allows a direct comparison of the sources of individual differences in subjective value.
These theoretical considerations raise the possibility, but do not conclusively show that a simplified, single parameter model could misrepresent a more complicated set of psychological processes. Therefore, we used a simulation method to determine whether a difference in the saturation index could be mistaken for a discounting parameter difference when no discounting difference actually existed. To explore a dramatic but plausible scenario, two samples were randomly assigned k-values from the same distribution derived from pilot data with undergraduate students. The groups were also assigned Q-values from distributions whose means differed by 1 SD (effect size d = -1.0). Indifference points were generated for each simulated subject based on these parameters, and a standard hyperbolic model was fit to the resulting data. The effect size of the calculated group difference in k was 0.60. Thus, a moderately large effect size in k was induced where none existed before simply by fitting the data using the over-simplified one parameter model. Thus the potential of fitting an oversimplified model to the data could have important consequences to our interpretation of the nature of any group differences that are detected.
The Uniqueness of Valuation or Discounting Bias in Cocaine Addiction
Impatience and risk-taking can be operationalized by choice behaviors evident during delay discounting and probability discounting tasks (Green and Myerson, 2010; Rustichini, 2009) [31,32]. Some studies suggest a commonality of delay discounting performance and probability discounting performance in gamblers(Holt et al., 2003) [33] and undergraduate students (Weber and Chapman, 2005) [34]. However, there is also evidence that smokers showed higher delay discounting rates but not lower probability discounting rates than controls (Mitchell, 1999) [35]. Given that these studies used a single parameter (i.e., hyperbolic discounting model) to analyze delay discounting performance, the inconsistent results may in part come from an inability to differentiate subcomponents associated with delay discounting and probability discounting. The current study attempted to disentangle the unique aspects of delay discounting associated with decision-making bias in cocaine users by applying a two parameter, saturating-hyperbolic model.
Some researchers suggest that the preference of sooner and smaller rewards is a general feature of all impulsive disorders, and that a steep delay discounting rate is a short-hand definition of impulsivity (Madden et al., 1997; Perry et al., 2005) [36,37]. However, this remains to be demonstrated. One putative impulsive disorder without the involvement of substance use is binge eating disorder (BED), which is characterized by uncontrollable overeating. Literature on BED studies suggests a commonality between BED and cocaine addiction such that both are related to habits and preferences that are learned through the reinforcement of powerful and repetitive rewards (Volkow and Wise, 2005) [38]. However, the association between discounting performance and binge eating disorder remains unclear. A recent study failed to detect a group effect among binge eaters, obese women, and normal controls on delay discounting after controlling for education level (Davis et al., 2010) [39]. However, another study indicated that obese women have significantly lower delay discount AUC (area-under-curve) scores than controls (Weller et al., 2008) [40]. Thus, one goal of the present study was to compare cocaine users and binge eaters based on their performance on the same decision making tasks to determine whether any decision-making bias found in chronic cocaine users is a general feature of both disorders.
Current Study
The aim of current study was to examine the impact of a twoparameter model in specifying the nature of several decision-making biases in cocaine users. To this end, we wanted to systematically compare the associated components at the parameter level (saturation index and discounting index), the task level (delay discounting and probability discounting), and the model level (hyperbolic and saturating-hyperbolic), across disorders (cocaine dependence and binge eating disorder). We anticipated that we would replicate findings from previous studies if we applied a hyperbolic model to our current data. That is, chronic cocaine users would have significantly higher delay discounting rates than controls when analyzed with hyperbolic model. When applying the saturatinghyperbolic model, we expected that cocaine users would have a significantly higher saturation index than controls given that higher saturation index indicates a valuation bias reflecting reduced reward sensitivity, perhaps due to habitual learning processes. Further, we also assumed that cocaine users may still have higher delay discounting rates than controls after accounting for the valuation bias given that impatience has been considered an important underlying mechanism of cocaine addiction. In addition, we anticipated that cocaine users would have lower probability discounting rates than controls because a low probability discounting rate indicates a tendency to risk taking, an important construct that has been associated with some impulsive disorders. To the extent that both disorders are associated with impulsivity, we hypothesized that binge eaters would also share these features.
Methods
Participants
Participants were recruited through postings and newspaper advertisements. All participants were told that they would be paid 180 dollars for completing all three sessions. The final samples included 36 active cocaine users, 37 matched healthy, non-cocaine using controls, 20 female adults with binge eating disorder, 16 normal, non-binge eating female controls, and 19 overweight non-binge eating female controls. To rule out the association between weight and decision-making bias, both normal controls and overweight controls were included, and their responses were compared to those of the binge eaters. All participants were between age 18 and 46 years.
For the cocaine users, inclusion criteria were: 1) meeting DSMIV (4th ed.) diagnostic criteria for cocaine dependence for at least 1 year; 2) meeting that criterion within the month prior to enrollment in the study; and 3) having used cocaine at least 6 times in the month prior to enrollment in the study. Exclusion criteria were: 1) a prior history of neurological illness, bipolar, or psychosis, 2) depressive disorder in the last month, 3) HIV seropositivity; 4) current medication that may alter gammaaminobutyric acid brain levels (a criterion related to a different assessment procedure); 5) current alcohol use > 10 drinks/week for women and 12 for men; and 6) current dependence on any psychoactive substance (with the exception of cocaine, caffeine, or nicotine). For the binge eater group, only female participants were enrolled. The inclusion criterion was meeting DSM-5 proposed diagnostic criteria for binge eating disorder. Exclusion criteria were: 1) No substance use disorders over the previous six months; 2) No bulimia nervosa and cocaine exclusionary criteria as listed above. For healthy controls, exclusion criteria were: 1) Any diagnosed psychiatric disorder in the past 3 months prior to enrollment; and 2) A history of substance dependence or substance abuse within the past year (with the exception of caffeine or nicotine). These control participants were matched with either active cocaine users or binge eaters on demographic variables listed in (Table 1).
| Characteristics |
|
|
Group |
|
|
| CDs |
CD Controls |
BEDs |
BED Normal Controls |
BED Overweight Controls |
| n |
36 |
37 |
20 |
16 |
19 |
| Age |
38.81 (7.25) |
38.79 (7.12) |
33.50 (8.22) |
31.44 (7.65) |
32.74 (7.55) |
| Gender (% female) |
18.91 |
23.07 |
100 |
100 |
100 |
| Race (% Caucasian) |
36.1 |
76.9 |
72.7 |
81.2 |
89.5 |
| Education (in years) |
13.14 (1.82) |
14.59 (1.52) |
15.60 (1.82) |
15.19 (1.76) |
14.89 (2.19) |
| Mother’s Education level |
2.46 (1.77) |
2.85 (1.50) |
3.00 (1.21) |
3.44 (2.06) |
2.89 (1.28) |
| Father’s Education level |
2.83 (2.06) |
3.26 (1.76) |
3.20 (2.02) |
3.63 (2.39) |
3.22 (2.07) |
| Years of use (cocaine) |
14.53 (7.48) |
-- |
-- |
-- |
-- |
| Days of use (per week) |
3.42 (1.68) |
-- |
-- |
-- |
-- |
| BMI |
-- |
-- |
34.64 (3.68) |
23.10 (1.87) |
34.27 (4.47) |
Note: BMI refers to Body Mass Index, a measure of body fat based on height and weight. A BMI of 30 or higher is considered as overweight. Parents’ Education Levels were rated with a Likert scale in which 1=8th Grade, 2=12th Grade, 3=Associate's degree, 4=Bachelor's degree, 5=Professional degree, 6=Master's degree, and 7=Doctorate.
Table 1: Demographics for Cocaine-Dependent Participants (CD), CD Controls, Participants with Binge Eating Disorder (BED), BED Overweight Controls, and BED Normal Controls.
Measures & Procedures
Discounting Measures (Richards et al., 1999) [41]
The delay discounting task measured subjective values after certain, hypothetical delays. The current version was a computerized random adjusting-amount procedure in which the smaller and immediate reward was adjusted until the value of the small reward was equal to the subjective value of the large and delayed reward (which indicated that an indifference point was reached). The task allowed participants to choose from $10 after a delay (1, 2, 30, 180, or 365 days) or an immediate and smaller reward. For example, participants were offered the following choice: Would you rather have $5 now or $10 in 30 days? After the participant made a choice, the answer was used by the program to narrow the range of the immediate rewards for the subsequent questions. A series of alternatives was presented until an indifference point at a certain delay time was reached. In addition, the adjusting nature of the task was masked by mixing the delay discounting questions and probability discounting questions. Because there were 5 delay times, completing the task would lead to 5 indifference points which yielded a delay discounting curve. A steeper delay discounting curve indicated a stronger preference for more immediate and smaller rewards.
The probability discounting task measured the subjective values with certain probability against receiving the reward. In the task, participants were asked to choose from $10 with a probability (95%, 90%, 75%, 50%, 25%) and a smaller, guaranteed amount of money. For example, one of the questions was “Would you rather take $5 for sure or $10 with a 50% chance?” Again, the smaller and assured reward was adjusted until an indifference point was reached for each probability level. The adjusted procedure was masked by mixing the probability questions with the delay questions. The 5 indifference points generated from the 5 probability levels were used to generate a probability discounting curve. A steeper probability discounting curve meant a stronger preference for more certain and smaller rewards (or higher risk aversion).
Participants completed the study in three sessions, with the third session consisting of an MRI scan, which is not discussed further. During the first session, participants underwent informed consent and a clinical interview to assess whether or not they met certain DSM-IV criteria using a Structured Clinical Interview for Axis I disorders. The cocaine users also completed a cocaine craving questionnaire (Tiffany et al., 1993) [42], brief substance craving questionnaire (Somoza et al., 1995) [43], and eating disorders examination questionnaire (EDE, Fairburn, 2008) [44]. Binge eaters and controls for both groups also completed the EDE and Stunkard-Messick Eating Questionnaire (SMEQ, Stunkard and Messick, 1985) [45]. During the second session, all participants completed the discounting tasks as part of a broader battery of computer-administered cognitive tasks counter-balanced across participant.
Data Analysis
Data check
The final samples were determined after a data check based on an algorithm developed by Johnson and Bickel (Johnson and Bickel, 2008) [46]: 1) an indifference point was greater than the preceding point for more than 20% of the largest delayed reward; 2) the last indifference point was not less than the first indifference point for at least 10% of the largest delayed reward. We modified the second criteria to no discounting at all given that our longest delay was shorter than that in Johnson & Bickel (2008) [46]. Nonsystematic discounting data from 3 cocaine users, 3 cocaine controls, 3 binge eaters, 3 normal binge eater controls, and 4 overweight binge eater controls were excluded from further analysis. Follow-up analyses consisting of a t-test, one-way analysis of variance (ANOVA) and χ2 and summarized on Table 1 showed there were no significant differences on the demographic variables between the clinical groups and their matched control groups.
Calculation of discounting
When fitting discounting data, the first step was to generate the indifference points at which the subject had equal chances of selecting either of a pair of alternatives (e.g. $5 now or $10 in 30 days). These indifference points form a series of delay or probability choices that were used to form a discount curve from which parameter estimates could be extracted. The delay and probability discounting parameters were first analyzed using a hyperbolic function to replicate the results from previous studies and then were analyzed using a saturating-hyperbolic function to test the hypotheses of the current study.
Comparison of model fitting
The relative goodness-of-fit was evaluated using sums of individual Akaike Information Criterion (AIC) scores. There were different numbers of parameters (thus different numbers of degree of freedom) involved in these models. Thus, AIC was used because it is a method for guiding model selection that penalizes on number of parameters (Burnham and Anderson, 2004; Motulsky and Christopoulos, 2004) [47,48]. The sum of individual AIC scores had been used as the primary index for model comparison (Pine et al., 2009) [49]. In addition, paired wise t tests were conducted to compare individual AIC scores for each group to provide additional evidence for the robustness of the model superiority.
Group differences and correlations
Indifference points at each scale of discounting tasks were first compared to provide some evidence for group difference without applying the model fitting. The t tests with bootstrap resampling were used to compare group means of indifference point at each delay time (1, 2, 30, 180, and 365) and each probability scale (95%, 90%, 75%, 50%, and 25%). This method was appropriate in this context to avoid parametric assumptions. Because nonindependent tests were performed, type I error rate was set at .01. After applying the hyperbolic model or saturating-hyperbolic model, the nonparametric tests (the Mann-Whitney U test or the Kruskal-Wallis test) were used to detect group differences on discounting parameters given that the distribution of discounting parameters were nonparametric. Unfortunately, the nature of the data precluded tests of group by parameter interactions (Sawilowsky, 1990) [50]. Further, a Mann-Whitney U test was used to detect differences on parameters between the severe users (n=17, use cocaine more than 3 days per week) and less severe users (n=18, use cocaine equal or less than 3 days a week) within the cocaine group. To avoid parametric assumptions, Spearman correlations were calculated to test the correlations between parameters. To compare the correlation coefficients, Pearson correlation coefficients were calculated based on the Spearman correlation coefficients, and the differences were tested using Fisher’s Z-transformation according to (Myers and Sirois, 2004) [51].
Results
Model fitting
The saturating-hyperbolic model appeared to be a better fit than the hyperbolic model in both cocaine group and control group. The sum of individual AIC scores in cocaine group was 506.50 for the saturating-hyperbolic model, in comparison to 626.57 for the hyperbolic model. In addition, the paired wise t test result indicated that the individual AIC scores for the saturatinghyperbolic model were significantly lower than the individual AIC scores for the hyperbolic model (t= 3.78, df=35, p=.001). Similarly, the sum of individual AIC scores in the control group was 423.19 for the saturating-hyperbolic model and 455.44 for the hyperbolic model, although the paired wise t test on individual AIC scores for these two models was not significant (t=1.18, t=36, p=.24).
Group Effect on Indifference Points and Discounting Parameters for Cocaine Users versus Controls
As shown in table 2, the cocaine group showed significantly lower indifference points at day 1, 2, 30, 180, but not at day 365. The cocaine group also showed significantly lower indifference points at probability of 95%, but not at probability scale of 90%, 75%, 50%, and 25%. (Table 2)
| Delay (days) |
Cocaine
M(SD) |
Control
M(SD) |
Group difference (cocaine-control) |
t |
p value* |
Effect size (Cohen's d) |
| Delay Discounting |
| 1 |
8.19 (2.34) |
9.71 (.51) |
-1.522 |
-3.811 |
<0.001 |
-.90 |
| 2 |
7.61 (2.31) |
9.38 (1.10) |
-1.767 |
-4.160 |
<0.001 |
-.98 |
| 30 |
4.39 (2.83) |
6.76 (3.04) |
-2.368 |
-3.445 |
<0.001 |
-.81 |
| 180 |
2.57 (2.30) |
5.03 (3.37) |
-2.458 |
-3.643 |
0.001 |
-.85 |
| 365 |
1.99 (1.91) |
3.57 (3.28) |
-1.581 |
-2.526 |
0.014 |
-.59 |
| Probability Discounting |
| 95% |
7.49 (2.77) |
8.83 (1.33) |
-1.352 |
-2.644 |
0.009 |
-.57 |
| 90% |
7.06 (2.85) |
8.15 (1.86) |
-1.093 |
-1.936 |
0.054 |
-.24 |
| 75% |
5.72 (2.92) |
5.86 (2.10) |
-0.143 |
-0.239 |
0.805 |
-.06 |
| 50% |
4.11 (2.59) |
3.33 (1.90) |
0.381 |
0.715 |
0.453 |
.34 |
| 25% |
2.29 (1.98) |
1.99 (1.07) |
0.305 |
0.815 |
0.420 |
.19 |
Note: p-values ascertained using a bootstrap method.
Table 2: T-test results of indifference points (cocaine VS controls) at each time scale.
When analyzed with the hyperbolic model, results of Mann- Whitney U tests showed that the cocaine users had higher delay discounting rates than matched controls (z=-3.13, p=.002, d=.79). However, there was no significant group difference between cocaine users and matched controls on the probability discounting rates (z=-.68, p=.50, d=.16).
When analyzed with the saturating-hyperbolic model, the cocaine users had higher saturation index than the controls (z=- 2.32, p=.02, d=.56) on the delay discounting task, but not the time discounting index (z=-1.62, p=.11, d=.39). That is, the time discounting effect size from the saturating hyperbolic model was approximately 50% smaller than with the single parameter model. Consistent with these observations, cocaine users also had a higher saturation index than the controls on the probability discounting task (z=-2.24, p=.025, d=.56). This appeared as a trend for the probability discounting index (z=-1.89, p=.06, d=.46).
To illustrate the group difference on delay discounting parameters, mean indifference points and confidence intervals were calculated with bootstrap resampling at each time scale and were fit with hyperbolic and saturating-hyperbolic models. (Figure 1)
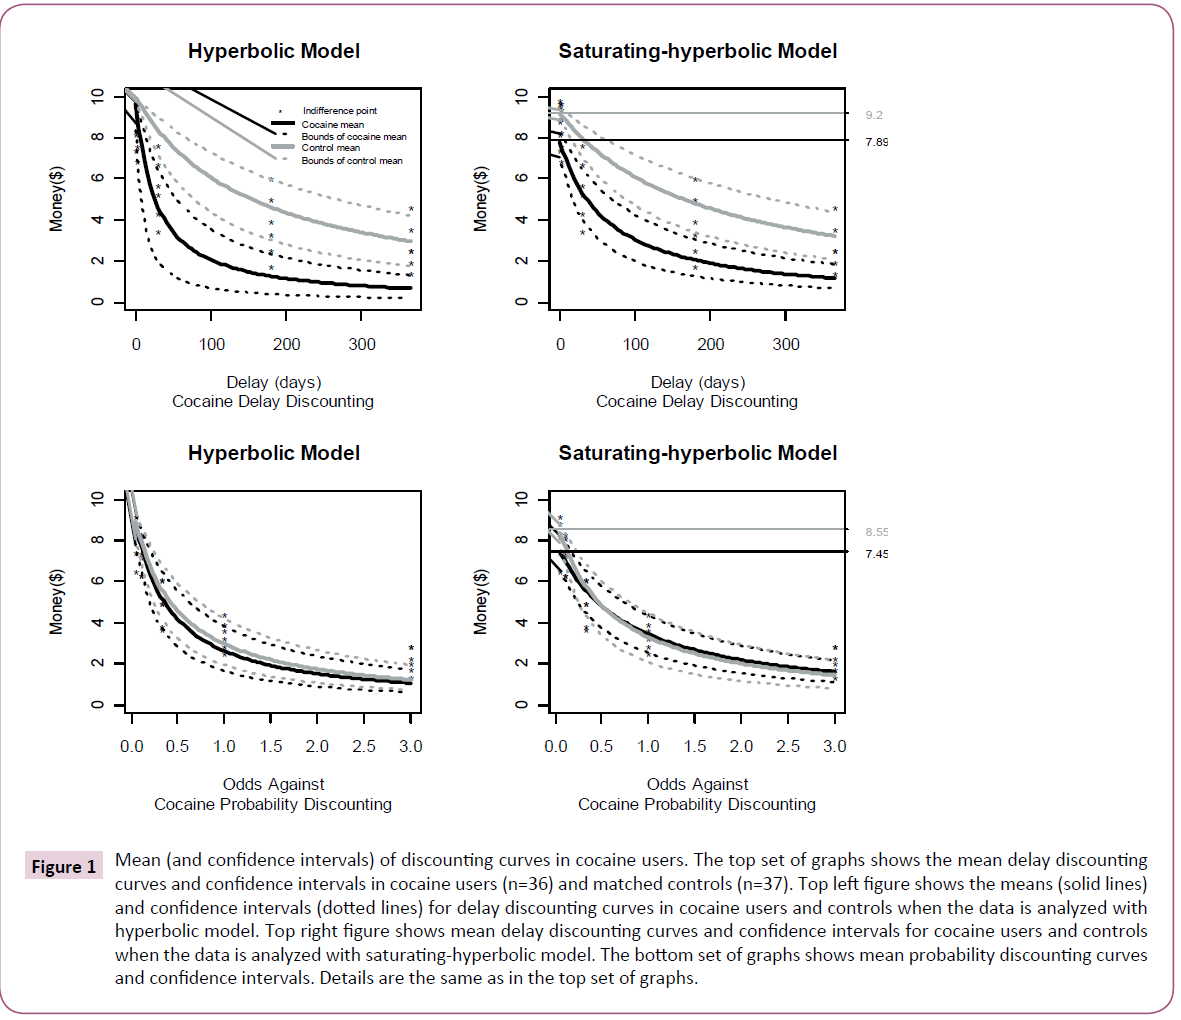
Figure 1: Mean (and confidence intervals) of discounting curves in cocaine users. The top set of graphs shows the mean delay discounting curves and confidence intervals in cocaine users (n=36) and matched controls (n=37). Top left figure shows the means (solid lines) and confidence intervals (dotted lines) for delay discounting curves in cocaine users and controls when the data is analyzed with hyperbolic model. Top right figure shows mean delay discounting curves and confidence intervals for cocaine users and controls when the data is analyzed with saturating-hyperbolic model. The bottom set of graphs shows mean probability discounting curves and confidence intervals. Details are the same as in the top set of graphs.
As shown in Figure 1, the cocaine group showed steeper discounting on decisions associated with delay rewards when the data was analyzed with the hyperbolic model (top left), but not on decisions associated with probabilistic rewards (bottom left). However, when the data was analyzed with the saturatinghyperbolic model, the cocaine group showed a consistently lower start point of discounting than the controls for decisions associated with delay rewards (top right) while the actual slopes of the curves were not too dissimilar. The cocaine group also showed a lower start point of discounting than the controls for decisions associated with probability rewards (bottom right), but the curve was slightly flatter than for the controls. This commonality across tasks suggested the observed decision bias in cocaine addicts is more strongly associated with the decision factor related to immediate valuation bias of the reward rather than the discounting effect.
Regarding the parameter difference between the severe users and less severe users in cocaine group, there were no differences in delay discounting rate (z=-.41, p=.68, d = .12) from the hyperbolic model. Where using the saturating-hyperbolic model, there was no difference in the time discounting parameter (z=-1.23, p=.22, d = .43) but there was a significantly higher saturation index in more severe users than in less severe users in the predicted direction (z=-2.27, p=.02, d = .83).
Correlations between Parameters
For controls and cocaine users, the delay discounting rate from the hyperbolic model was highly correlated with the time discounting parameter from the saturating-hyperbolic model (ρ =.83, p<.001), although this rate was significantly greater for the controls relative to the cocaine users (ρ=.98 vs ρ=.57, respectively, z = 7.2, p<.001). The correlation between the delay discounting rate from the hyperbolic model and the saturation index was not significant (ρ=.06, ρ=.59), whereas between time discounting and saturation indices from the saturating-hyperbolic model were negatively correlated (ρ=-.43, p<.001) such that the more one devalued the reward at the outset, the less likely he or she was to discount the value of that reward over time. Group status did not significantly affect these latter correlations.
When examining the association between the delay discounting paradigm and probability discounting paradigm using saturatinghyperbolic model, the time discounting parameter was somewhat correlated with probability discounting parameter (ρ=.19, p=.03) and were similar across groups. The saturation index from delay discounting task was also significantly correlated with the saturation index from probability discounting task (ρ=.33, p<.001), with a nearly significantly higher correlation in controls than in cocaine users (ρ=.48 vs ρ=.06, respectively, z = 1.96, p=.05).
Group Effect on Discounting Rates for Binge Eaters versus Controls
Results of Kruskal Wallis Tests indicated that binge eaters did not show significantly higher or lower discounting parameters than either normal weight controls or over-weight controls when using either the hyperbolic or the saturated hyperbolic models. The significant level ranged from .15 to .98. Mann-Whitney U test for the group difference between binge eaters and normal controls also yield nonsignifciant results with significant level ranged from .28-.97. The effect sizes (d) ranged from .37 (delay discounting saturation) to .02 (probability discounting). As shown in Figure 2, the discounting curves of the three groups overlapped. (Figure 2)
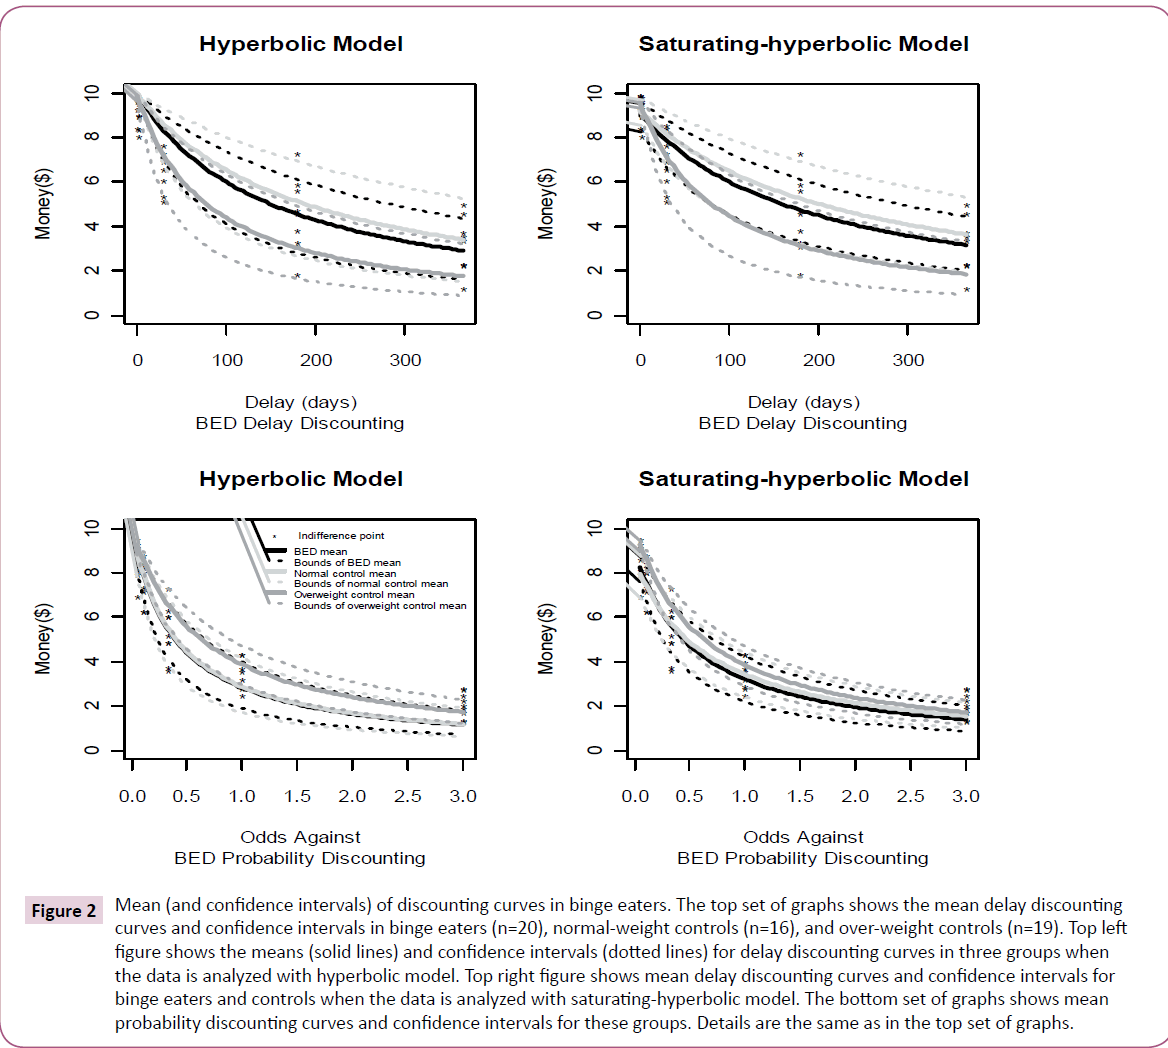
Figure 2: Mean (and confidence intervals) of discounting curves in binge eaters. The top set of graphs shows the mean delay discounting curves and confidence intervals in binge eaters (n=20), normal-weight controls (n=16), and over-weight controls (n=19). Top left figure shows the means (solid lines) and confidence intervals (dotted lines) for delay discounting curves in three groups when the data is analyzed with hyperbolic model. Top right figure shows mean delay discounting curves and confidence intervals for binge eaters and controls when the data is analyzed with saturating-hyperbolic model. The bottom set of graphs shows mean probability discounting curves and confidence intervals for these groups. Details are the same as in the top set of graphs.
Conclusion and Discussion
The present study examined the specificity of decision-making bias in cocaine dependence when the discounting data were analyzed using both the standard hyperbolic function and saturating-hyperbolic model. When applying the hyperbolic function, current results replicated findings from previous studies that cocaine users had significantly higher delay discounting rates than controls. In addition, cocaine users did not show lower probability discounting rates than controls. However, when the data was examined using the saturating-hyperbolic function, which contained an additional parameter to fit, the cocaine users showed markedly more normal delay discounting rates that were no longer reliably different from controls. Instead, cocaine users showed significantly higher saturation indices on both the delay and probability discounting tasks. In contrast to cocaine users, the binge eaters did not show significant differences from either the normal controls or over-weight controls on any discounting parameters.
The findings from the hyperbolic model have replicated the results of previous studies, indicating that cocaine users have higher delay discounting rates than controls (Heil et al., 2006; Kirby and Petry, 2004; Bornovalova et al., 2005) [7,8,52]. Based on these results, one is led to believe the decision-making bias observed in cocaine users is specific to the difficulty with executive functions (i.e. impatience). However, findings from saturating-hyperbolic model challenge this interpretation, and highlight the importance of a decrease of valuation of rewards (high saturation index) in the decision-making bias. With regard to the statistical power, the current study included a total of 73 cocaine users and controls, thus making our power to detect effects comparable to that of other important experimental studies in this area (e.g. Heil, Johnson, Higgins, & Bickel, 2006; 63 cocaine users and controls). In the event, the effect size derived from the k parameter in the saturating hyperbolic model was .39, which would general require 160 subjects to obtain power of .80 (assuming α = .05 and a parametric distribution).
The hyperbolic model is a special case of the saturating-hyperbolic model and assumes that each participant has the same saturation index equal to zero. While this assumption may generally be appropriate in normal population, it was not appropriate for this cocaine group. Results of the current study indicated that the saturation indices were close to zero for the majority of controls, but it was higher and much more variable in the cocaine group. These findings point to the importance of examining individual differences using the saturation index.
The saturation index may be particularly important when describing cocaine users. Results of the current study showed that the time discounting parameter in cocaine users was only moderately correlated with the delay discounting rate from the hyperbolic model, although this correlation was close to 1 in the control group. This may indicate that although the time discounting parameter could be explained by the delay discounting rate in a normal population, this assumption does not apply to chronic cocaine users. Our data further showed that one can be led to very different conclusions depending on whether one assumes that the saturation index reflects no individual differences relevant to delay discounting decisions in chronic cocaine users.
The finding of a valuation bias of nearly the same magnitude in cocaine users in both the delay and probability discounting tasks suggests that chronic cocaine users may require greater rewards to feel the same level of satisfaction. This was also the only index that differentiated the severe use group from the less severe use group. Thus, the frequency of drug use appeared to be associated with a stronger valuation bias and therefore a higher threshold to be satisfied. This may be associated with the dysfunction of dopaminergic system. In the literature of drug addiction, the dopaminergic system has been found to play an important role in evaluating choices through trial and error learning process (Niv et al., 2006; Waelti et al., 2001) [28,53]. Previous studies suggested that dopamine levels in drug users showed an increase in the initial phase of drug use and then a decrease with repeated exposure to drugs (Kiyatkin and Rebec, 2001; Kalivas and Duffy, 1993; Nader et al., 2006) [54,55,56]. Reward encoding is based on the magnitude and unpredictability of rewards (Fields et al., 2007) [57]. With repeated exposure to addictive drugs and the decrease of unpredictability of rewards, drug users may need a higher level of rewards to maintain a stable dopamine level. This change has been considered as a homeostatic regulation (Fields et al., 2007; Paulus, 2007) [57,58]. This process also highlights the importance of habitual decision making and a decrease of goal-directed decision making in chronic cocaine users. There is evidence suggesting that long-term cocaine users show increased behavioral rigidity and compulsive drug consumption which is associated with loss of gray matter in the orbitofrontal cortex (Ersche et al., 2011) [59], a region previously identified as one of the regions associated with “β” parameter that represents “the special value placed on immediate rewards” (McClure, et al., 2004) [15]. The cocaine users in current study have an average use of cocaine for about 15 years. At this stage, the decisionmaking bias appears to be more associated with valuation bias.
Furthermore, these findings provide some evidence for the commonality of delay discounting and probability discounting. Theoretically, these two tasks share some commonalities, which include a similar conceptual framework and mathematical function (Green and Myerson, 2004) [20]. Correlational studies indicate the delay discounting rate and probability discounting rate are either not significantly correlated (Reynolds et al., 2004; Olson et al., 2007) [60, 61] or they are significantly and positively correlated (Myerson et al., 2003; Estle et al., 2007) [62,63]. Neuroimaging studies suggest there is a common neural system (Ventral striatum and orbitofrontal cortex) that encodes monetary utility for decisions associated with both delayed rewards and probability rewards (Peters & Büchel, 2009) [16]. This neural system is consistent with the subject specific evaluation system. However, there is also evidence that delay discounting and probability discounting involve at least some distinct processes. There are opposite magnitude effects on delay discounting and probability discounting in that a smaller reward magnitude leads to steeper delay discounting rate and shallower probability discounting rate (Du et al., 2002; Green et al., 1999; Myerson, 2003) [64,65]. Factor analyses indicate that delay discounting and probability discounting load on different factors (Estle et al., 2007) [63]. Current findings suggest there are common and distinct factors involved in delay discounting and probability discounting.
Another finding from this study was that the cocaine users did not share the decision biases with binge eaters, consistent with other results (Davis et al., 2010) [39]. There is evidence indicating dopaminergic dysfunction also plays a role in eating disorders (Volkow and Wise, 2005; Wang et al., 2001) [38,67]. However, there appear to be different mechanisms associated with the dopamine involvement in drug users and binge eaters (Wang et al., 2011) [68]. While Wang et al. endorsed the importance of habitual learning in drug addiction; their study indicated that binge eating is more associated with reward sensitivity to food specifically. Further, discounting for food has been found to be associated with body fat in normal population (Rasmussen, Lawyer, & Reilly, 2010). Thus, it is also possible that binge eaters only have valuation bias or problems with executive controls associated with food, which remains to be studied.
This study has several limitations. First, although participants were selected using stringent inclusion and exclusion criteria, the statuses of cocaine dependence, binge eating disorder, and healthy controls were based on self-report information. Further, the cocaine users reportedly had an average of about 15 years of cocaine use. Some results from the present research may not be generalizable to cocaine users with a shorter use history, nor was it possible to distinguish the risk factors for cocaine use from the sequelae of habitual use. Finally, the sample sizes of participants with binge eating disorder, over-weight controls, and normalweight controls were relatively small, and only female participants were involved, although the female subgroup in cocaine users did show a trend of group difference from normal controls. Further studies with larger and more heterogeneous samples are needed to replicate the findings from this study.
In summary, the current study expands the research of decisionmaking bias in cocaine users by applying a novel model that differentiates the monetary utility and time utility. The results indicate that the decision-making bias in long-term cocaine users is more associated with the deficit of reward evaluation system than the impatience or a sense of urgency. The valuation bias is likely associated with habitual learning and neuro-adaptation in dopamine functioning. Our study further supports the treatment that aims to increase the dopaminergic function in chronic cocaine users (Nader et al., 2006) [56]. Future studies may focus on the impact of this evaluation bias on the intervention efficacy. Treatments that focus on modifying the factors associated with valuation bias may be particularly useful for the most severe users. In addition, binge eating disorder does not appear to share this feature with cocaine dependence, suggesting different underlying mechanisms associated with decisions in binge eaters.
Authors’ Note
This work was supported through National Institute of Drug Abuse P20DA024196 awarded to KOL. The authors declare that they have no material conflicts of interest directly or indirectly related to this work. We thank Edward Patzelt, Samantha Collum, Autumn Rydberg, & Ann Person for assistance in running these experiments and the analysis, and all the participants for their cooperation.
References
- Lucantonio F, Stalnaker TA, Shaham Y, Niv Y, Schoenbaum G (2012) The impact of orbitofrontal dysfunction on cocaine addiction. Nature Neuroscience 15:358-366.
- Bechara A (2005) Decision making, impulse control and loss of willpower to resist drugs: a neurocognitive perspective. Nature Neuroscience 8:1458-1464.
- Everitt BJ, Belin D, Economidou D, Pelloux Y, Dalley JW, et al. (2008) Review. Neural mechanisms underlying the vulnerability to develop compulsive drug-seeking habits and addiction. Philosophical transactions of the Royal Society of LondonSeries B, Biological sciences 363:3125-3135.
- Iacono WG, Malone SM, McGue M (2008)Behavioraldisinhibition and the development of early-onset addiction: common and specific influences. Annu Rev ClinPsychol4:325-348.
- Johnson MW, Bickel WK, Baker F (2007) Moderate drug use and delay discounting: A comparison of heavy, light, and never smokers. ExpClinPsychopharmacol 15:187-194.
- Coffey SF, Gudleski GD, Saladin ME, Brady KT (2003) Impulsivity and rapid discounting of delayed hypothetical rewards in cocaine-dependent individuals. ExpClinPsychopharmacol 11:18-25.
- Heil SH, Johnson MW, Higgins ST, Bickel WK (2006) Delay discounting in currently using and currently abstinent cocaine-dependent outpatients and non-drug-using matched controls. Addictive Behaviors 31:1290-1294.
- Kirby KN, Petry NM (2004) Heroin and cocaine abusers have higher discount rates for delayed rewards than alcoholics or non drug using controls. Addiction 99:461-471.
- Flagel SB, Robinson TE, Clark JJ, Clinton SM, Watson SJ, et al.(2010) An animal model of genetic vulnerability to behavioraldisinhibition and responsiveness to reward-related cues: implications for addiction. Neuropsychopharmacology 35:388.
- Volkow ND, Wang GJ, Fowler JS, Tomasi D, Telang F,et al. (2010) Addiction: decreased reward sensitivity and increased expectation sensitivity conspire to overwhelm the brain's control circuit. Bioessays 32:748-755.
- Parvaz MA, Maloney T, Moeller SJ, Woicik PA, Alia-Klein N, et al. (2012) Sensitivity to monetary reward is most severely compromised in recently abstaining cocaine addicted individuals: a cross-sectional ERP study. Psychiatry Research: Neuroimaging.
- Goldstein RZ, Alia-Klein N, Tomasi D, Zhang L, Cottone LA, et al. (2007) Decreased prefrontal cortical sensitivity to monetary reward is associated with impaired motivation and self-control in cocaine addiction. The American Journal of Psychiatry 164:43.
- Ballard K, Knutson B (2009) Dissociable neural representations of future reward magnitude and delay during temporal discounting. NeuroImage 45:143-150.
- Kable JW, Glimcher PW (2010)An “as soon as possible” effect in human intertemporal decision making: behavioral evidence and neural mechanisms. Journal of neurophysiology 103:2513.
- McClure SM, Laibson DI, Loewenstein G, Cohen JD (2004) Separate neural systems value immediate and delayed monetary rewards. Science 306:503-507.
- Peters J, Büchel C (2009) Overlapping and distinct neural systems code for subjective value during intertemporal and risky decision making. The Journal of Neuroscience 29:15727.
- Iacono WG, Malone SM, McGue M (2003) Substance use disorders, externalizing psychopathology, and P300 event-related potential amplitude. International Journal of Psychophysiology 48:147-178.
- Dalley JW, Fryer TD, Brichard L, Robinson ESJ, Theobald DEH, et al. (2007) Nucleus accumbens D2/3 receptors predict trait impulsivity and cocaine reinforcement. Science's STKE 315:1267.
- Diergaarde L, Pattij T, Poortvliet I, Hogenboom F, de Vries W,et al. (2008) Impulsive Choice and Impulsive Action Predict Vulnerability to Distinct Stages of Nicotine Seeking in Rats. Biol Psychiatry 63:301-308.
- Green L, Myerson J (2004) A discounting framework for choice with delayed and probabilistic rewards. Psychological bulletin 130:769.
- Mazur JE (1987)An adjusting procedure for studying delayed reinforcement.
- Kirby KN, Santiesteban M (2003) Concave utility, transaction costs, and risk in measuring discounting of delayed rewards. Journal of Experimental Psychology: Learning, Memory, and Cognition 29:66-79.
- Madden GJ, Bickel WK, Jacobs EA (1999) Discounting of delayed rewards in opioid-dependent outpatients: Exponential or hyperbolic discounting functions? ExpClinPsychopharmacol 7:284-293.
- Volkow ND Wang GJ, Fowler JS, Tomasi D (2012) Addiction circuitry in the human brain. Annual review of pharmacology and toxicology 52:321.
- Rangel A, Camerer C, Montague PR (2008) A framework for studying the neurobiology of value-based decision making. Nature Reviews Neuroscience 9:545-556.
- Cardinal RN, Robbins TW, Everitt BJ (2003) Choosing Delayed Rewards: Perspectives from Learning Theory, Neurochemistry, and Neuroanatomy. In: Rudy, E.V.; Nick, H., editors, Choice, Behavioural Economics and Addiction. Amsterdam: Pergamon183-218.
- Everitt BJ, Robbins TW (2005) Neural systems of reinforcement for drug addiction: from actions to habits to compulsion. Nature Neuroscience 8:1481-1489.
- Niv Y, Daw ND, Dayan P (2006) Choice values. Nat Neurosci 9:987-988.
- Van Gaalen MM, Brueggeman RJ, Bronius PF, Schoffelmeer AN, Vanderschuren LJ (2006)Behavioraldisinhibition requires dopamine receptor activation. Psychopharmacology 187:73-85.
- Doya K (2008) Modulators of decision making. Nat Neurosci 11:410-416.
- Green L, Myerson J (2010) Experimental and correlational analyses of delay and probability discounting. In: Madden, G.J.; Bickel, W.K., editors, Impulsivity: The behavioral and neurological science of discounting: Washington, DC, US: American Psychological Association67-92.
- Rustichini A (2009)Neuroeconomics: what have we found, and what should we search for. Current Opinion in Neurobiology 19:672-677.
- Holt DD, Green L, Myerson J (2003) Is discounting impulsive?: Evidence from temporal and probability discounting in gambling and non-gambling college students. Behav Processes 64:355-367.
- Weber BJ, Chapman GB (2005)The combined effects of risk and time on choice: Does uncertainty eliminate the immediacy effect? Does delay eliminate the certainty effect? Organizational Behavior and Human Decision Processes 96:104-118.
- Mitchell SH (1999) Measures of impulsivity in cigarette smokers and non-smokers. Psychopharmacology 146:455-464.
- Madden GJ, Petry NM, Badger GJ, Bickel WK (1997) Impulsive and Self-Control Choices in Opioid-Dependent Patients and Non-Drug-Using Control Participants: Drug and Monetary Rewards. ExpClinPsychopharmacol 5:256-262.
- Perry JL, Larson EB, German JP, Madden GJ, Carroll ME (2005) Impulsivity (delay discounting) as a predictor of acquisition of IV cocaine self-administration in female rats. Psychopharmacology 178:193-201.
- Volkow ND, Wise RA (2005) How can drug addiction help us understand obesity? Nature Neuroscience 8:555-560.
- Davis C, Patte K, Curtis C, Reid C (2010) Immediate pleasures and future consequences. A neuropsychological study of binge eating and obesity. Appetite 54:208-213.
- Weller RE, Cook Iii EW, Avsar KB, Cox JE (2008) Obese women show greater delay discounting than healthy-weight women. Appetite 51:563-569.
- Richards JB, Zhang L, Mitchell SH, De Wit H (1999) Delay or probability discounting in a model of impulsive behavior: effect of alcohol. Journal of the Experimental Analysis of behaviour 71:121.
- Tiffany ST, Singleton E, Haertzen CA, Henningfield JE (1993)The development of a cocaine craving questionnaire. Drug and Alcohol Dependence 34:19-28.
- Somoza E, Dyrenforth S, Goldsmith J, Mezinskis J, Cohen M (1995) In search of a universal drug craving scale. Paper presented at the Annual Meeting of the American Psychiatric Association, Miami Florida.
- Fairburn CG (2008) Cognitive behavior therapy and eating disorders. New York, NY: Guilford Press.
- Stunkard AJ, Messick S (1985)The three-factor eating questionnaire to measure dietary restraint, disinhibition and hunger. J Psychosom Res 29: 71-83.
- Johnson MW, Bickel WK (2008)An algorithm for identifying nonsystematic delay-discounting data. ExpClinPsychopharmacol 16:264-274.
- Burnham KP, Anderson DR (2004)Multimodel inference. Sociological Methods & Research 33:261.
- Motulsky H, ChristopoulosA (2004) Fitting models to biological data using linear and nonlinear regression: a practical guide to curve fitting: Oxford University Press, USA.
- Pine A, Seymour B, Roiser JP, Bossaerts P, FristonKJ,et al. (2009) Encoding of marginal utility across time in the human brain. The Journal of Neuroscience 29:9575-9581.
- Sawilowsky SS (1990) Nonparametric tests of interaction in experimental design. Review of Educational Research 60:91-126.
- Myers L, Sirois MJ (2004) Spearman Correlation Coefficients, Differences between. Encyclopedia of statistical sciences: John Wiley & Sons, Inc.
- Bornovalova MA, Daughters SB, Hernandez GD, Richards JB, Lejuez CW (2005) Differences in impulsivity and risk-taking propensity between primary users of crack cocaine and primary users of heroin in a residential substance-use program. ExpClinPsychopharmacol 13:311-318.
- Waelti P, Dickinson A, Schultz W (2001) Dopamine responses comply with basic assumptions of formal learning theory. Nature 412:43-48.
- Kiyatkin E, Rebec G (2001) Impulse activity of ventral tegmental area neurons during heroin self-administration in rats. Neuroscience 102:565-580.
- Kalivas PW, Duffy P (1993) Time course of extracellular dopamine and behavioral sensitization to cocaine. I. Dopamine axon terminals. The Journal of Neuroscience 13:266-275.
- Nader MA, Morgan D, Gage HD, Nader SH, Calhoun TL, et al.(2006) PET imaging of dopamine D2 receptors during chronic cocaine self-administration in monkeys. Nature Neuroscience 9:1050-1056.
- Fields HL, Hjelmstad GO, Margolis EB, Nicola SM (2007) Ventral tegmental area neurons in learned appetitive behavior and positive reinforcement. Annu Rev Neurosci30:289-316.
- Paulus MP (2007) Decision-making dysfunctions in psychiatry—altered homeostatic processing? Science 318:602-606.
- Ersche KD, Barnes A, Jones PS,Morein-Zamir S, Robbins TW,et al. (2011) Abnormal structure of frontostriatal brain systems is associated with aspects of impulsivity and compulsivity in cocaine dependence. Brain 134:2013-2024.
- Reynolds B Richards JB, Horn K, Karraker K (2004) Delay discounting and probability discounting as related to cigarette smoking status in adults. Behav Processes 65:35-42.
- Olson EA, Hooper CJ, Collins P, Luciana M (2007) Adolescents' performance on delay and probability discounting tasks: Contributions of age, intelligence, executive functioning, and self-reported externalizing behavior. Personality and Individual Differences 43:1886-1897.
- Myerson J, Green L, Scott Hanson J, Holt DD, Estle SJ (2003) Discounting delayed and probabilistic rewards: Processes and traits. Journal of Economic Psychology 24:619-635.
- Estle SJ, Green L,Myerson J, Holt DD (2007) Discounting of monetary and directly consumable rewards. Psychological Science 18:58-63.
- Du W, Green L, Myerson J (2002) Cross-cultural comparisons of discounting delayed and probabilistic rewards. Psychological Record 52:479-492.
- Green L, Myerson J, Ostaszewski P (1999) Amount of Reward Has Opposite Effects on the Discounting of Delayed and Probabilistic Outcomes. J ExpPsychol Learn MemCogn 25:418-427.
- Myerson J (2003) Discounting delayed and probabilistic rewards: Processes and traits. Journal of Economic Psychology 24:619-635.
- Wang GJ, Volkow ND, Logan J, Pappas NR, Wong CT, et al. (2001) Fowler, J.S. Brain dopamine and obesity. The Lancet 357: 354-357.
- Wang GJ, Geliebter A, Volkow ND, Telang FW, Logan J, et al. (2011) Enhanced striatal dopamine release during food stimulation in binge eating disorder. Obesity 19:1601-1608.