Keywords
Arginine; Fibrosis; Immunohistochemistry; Pancreatic Stellate Cells; Pancreatitis, Chronic
Abbreviations
CP Chronic pancreatitis; GSH Glutathione; IHC Immunohistochemistry; MT Masson Trichrome; PSC Pancreatic stellate cell; LPO lipid peroxidation
INTRODUCTION
Chronic pancreatitis (CP) is an inflammatory, progressive disease of the pancreas which leads to the progressive destruction of the pancreatic acinar cells that ultimately leading on to development of pancreatic fibrosis [1]. CP is an irreversible process characterized by chronic inflammation and progressive fibrosis of the pancreas. Destruction of the gland leads to eventual loss of exocrine and endocrine functions [2]. One of the accepted theories is that chronic pancreatitis results from repeated episodes of acute pancreatitis [3].
It is well documented that high dose of arginine induces dose-dependent pancreatic acinar cell necrosis without causing any damage to the langerhans islets [4, 5, 6, 7, 8]. It has also been observed that intraperitoneal injection of arginine can be easily administered and selectively damages acinar cells [9]. However, repetitive injections of cerulein or intraductal infusion of sodium taurocholate caused transient pancreatitis, and the pancreatic injury returned histologically normal within 14 days. On the other hand, intraductal infusion of oleic acid induced persistent pancreatic damage proceeding to insufficiency of pancreas with replacement of almost all pancreatic parenchymal tissues by fatty tissues without fibrosis. In all these animal models, histological features are different from those of CP in human because pancreatic fibrosis is rarely seen and pancreatic parenchyma is replaced by fatty tissue.
Long-term administration of arginine has been suggested to study chronic pancreatitis [6, 8, 9]. Mizinuma et al. reported severe pancreatic damage secondary to intraperitoneal administration of arginine [4]. In this study male rats were given I.P injection of 500 mg of arginine/100 gb. wt Pancreatic acinar cells were destroyed selectively, without any morphological change of Langerhans' islets. As early as 24 hours after the injection, necrotic changes of the acinar cells were noted. After 3 days, atrophy of pancreatic lobules was evident. This change correlated closely with the marked necrosis of the pancreas. A study was designed by Delaney et al. to assess whether serial injections of arginine would induce reproducible chronic pancreatic damage [6]. Intra-peritoneal injections of 500 mg/100 gb. wt of arginine were given to forty rats followed by three injections of 250 mg/100 gb. wt for 10 days. Rats were killed after 24 hr after each injection and then at intervals of up to 6 months. Pancreatic examination at 24 hr showed a severe oedematous pancreatitis. By day 5 there was up to 90% destruction of acinar cells with adipose tissue replacement but appearance of islet cells, vascular and ductal cells was as normal. Even at 6 months after injection these changes were present. This model has been put forward as a simple, reproducible and new method of inducing chronic pancreatic damage in the rats.
When a single dose of 500 mg/100 gb. wt of arginine was injected, 70-80% of the pancreatic acinar cells were necrotized within 3 days [5]. When rats were given additional 3 injections of 250 mg/100 gb. wt over 10 days, there was up to 90% acinar destruction [6]. Weaver et al. experimented daily dose of 350 mg/100 gb. wt of arginine for 30 days resulted in severe pancreatic necrosis by week 4 [8]. They also reported that excess arginine treated animals may serve as a model for the study of acute and chronic pancreatitis [8]. Most of the authors, who studied the pathomechanism of pancreatitis, used 250 mg/100 gb. wt of arginine twice at an interval of one hour [10, 11, 12]. On the other hand, when the regenerative processes were studied after pancreatitis, a smaller dose of arginine (200 mg/100 gb. wt of arginine, I.P twice at an interval of 1 hr) was used [7, 13]. The dose and time dependency of the effects of arginine gives an excellent opportunity to study the different phases of pancreatitis. A higher dose of arginine is suggested to study the pathomechanism of acute pancreatitis, while a smaller dose of arginine seems more suitable to characterize the regenerative processes. Long-term administration of arginine is suggested to study chronic pancreatitis.
However, despite our repeated attempts to reproduce these protocols with the same dose of L-arginine. We could not develop sufficient pancreatic fibrosis and histological features. In these models of pancreatitis histological appearances were quite different from those in humans. Therefore, the aim of the present work was to develop non-surgical, chronic pancreatitis model of rat using repeated intraperitoneal injection of L-arginine hydrochloride. We have successfully developed a protocol for induction of severe chronic pancreatitis in rats by intraperitoneal injections of L-arginine and reported here the dose required, the method followed, and its effect on the different markers of pancreatic injury.
MATERIAL AND METHODS
Animals
Animals used in the study were wistar rats of either sex in the weight range of 200±50 g and were acclimatized for one week prior of subjecting them to different treatments. They were kept in polypropylene cages under standard laboratory conditions of temperature and 12 hour light/ dark cycle. Rats were fed standard laboratory diet and water ad libitum throughout the period of experimental protocol.
Chemicals
Chemicals used in present study were of analytical grade (AR) and laboratory grade (LR) received from various companies like BDH Chemicals, Merck, Ranbaxy, Sigma chemicals. All molecular biology reagents were obtained from Fermentas life sciences (Canada), New England Bio labs (USA), Sigma-Aldrich Chemicals (India). L-arginine monohydrochloride (Cat. No. A5131) and PCR primers were procured from Sigma-Aldrich chemicals (India). Primary antibodies were procured from Abcam laboratories and secondary antibodies were procured from Dako, Denmark. Serum TNF-α kit (Cat. No. 865000096) was procured from Diaclone, France and serum IL-10 kit (Cat. No. RBMS-629R) from Biovendor, Czech Repuplic.
Experimental Protocol
30 Wistar rats of either sex were obtained from central animal house, PGIMER and divided equally into following 5 experimental groups (Figure 1).
Figure 1. Experimental design.
Group 1- Rats in this group were given I.P injections of normal saline on day 1, 4, 7, 10, 13, 16 and 19 which was used as the vehicle for giving arginine, these rats served as control group and were sacrificed on day 21.
Group 2- Rats were given two I.P injections of arginine, 250 mg/100 gb. wt/day (40%. wt/vol., pH 7.4) in normal saline at 1 hr interval on day 1. Rats of this group were sacrificed on day 3.
Group 3- Rats were given two I.P injections of arginine, 250 mg/100 gb. wt/day (40%. wt/vol., pH 7.4) in normal saline at 1 hr interval on day 1. I.P injections were repeated with a single and same dose of arginine (250 mg/100 gb. wt/day) on day 4, 7. Rats of this group were sacrificed on day 9.
Group 4- Rats were given two I.P injections of arginine, 250 mg/100 gb. wt/day (40%. wt/vol., pH 7.4) in normal saline at 1 hr interval on day 1. I.P injections were repeated with a single and same dose of arginine (250 mg/100 gb. wt/day) on day 4, 7, 10 and 13. Rats of this group were sacrificed on day 15.
Group 5- Rats were given two I.P injections of arginine, 250 mg/100 gb. wt/day in normal saline at 1 hr. interval on day 1 and were repeated with a single and same dose of arginine (250 mg/100 gb. wt/day) on day 4, 7, 10, 13, 16 and 19. Rats of this group were sacrificed on day 21.
Food consumption and physical activities of rats were recorded daily. All the animals were weighed at the beginning of the experiment and at weekly intervals till the end of experiment. Rats were kept fasting overnight before sacrifice. Rats were sacrificed by I.P injection of thiopentone sodium (50 mg/kg). A midline incision was given. Heart was identified and blood was drawn into plain and EDTA vials by cardiac puncture. The blood was allowed to clot and serum was separated. The samples were stored at -8°C till the time of analysis. Serum was used for estimation of serum amylase, lipase, TNF-α and IL-10. RBCs hemolysate was prepared by adding 2.5 mL of whole EDTA blood in a graduated centrifuge tube and centrifuged at 1000 g for 15 minutes. Supernatant (plasma) was separated. Cells were washed twice with 2.5 mL physiological saline and tubes were re-centrifuged at 3000 g for 10 minutes. Clear upper layer was discarded and 1 mL of erythrocyte suspension was pipetted out in storage vial. It was diluted in 1:1 ratio with distilled water and mix properly so that all RBCs were properly ruptured. Hemolysate was stored at -20°C and used for the estimation of LPO and GSH.
Pancreas was dissected from its attachment to the stomach, duodenum and spleen. Fat and peri-pancreatic tissues were trimmed away and pancreatic tissue was properly rinsed with saline. For histology and immunohistochemistry (IHC), one portion of pancreatic tissue was fixed in 10% buffered formaldehyde. Another portion of the pancreas was stored at -8°C and used for preparation of pancreatic tissue homogenate. Pancreatic tissue homogenates (10%) were prepared in ice cold tris buffer (pH 8.0), using mechanically driven fitted Potter-Elvejhem type homogenizer for a few minutes till total disruption of cells. Homogenates were centrifuged at 10,000 g for 10 minutes at 4°C. Aliquots of the post mitochondrial supernatants (PMS) were prepared and stored at -20°C for determination of LPO and GSH. One portion of pancreatic tissue was kept in RNA later for molecular analysis.
Serum Amylase
Estimation of serum amylase level was done by amyloclastic method [14]. In this method, iodine gives blue coloured complex when it comes in contact with starch. Thus, amylase activity of samples was evaluated by recording time in which known amount of starch was hydrolysed by amylase. Thus the end point of the reaction is absence of any substrate capable of forming the starch-iodine blue coloured complex. The serum amylase activity was expressed as S.U/100 mL (Somogyi unit/100 mL).
Serum Lipase
Lipase levels were measured using method of MacDonald and LeFave [15]. This test involves incubation of sample containing lipase with olive oil emulsion. The fatty acids released during this reaction is then neutralized or titrated with 0.05 N sodium hydroxide. Amount of lipase present in sample is expressed as ml of 0.05 N sodium hydroxide required to neutralize the fatty acids produced by hydrolysis under the conditions of the test.
Lipid Peroxidation
Lipid peroxidation is a marker to assess oxidative damage caused by reactive oxygen species. Malondialdehyde (MDA) is taken as an index to measure the extent of lipid peroxidation. Iron ascorbate catalyzed lipid peroxidation which was analysed by method of Ohkawa et al. [16]. Units for LPO are nmoles MDA formed/ min/100 mg protein for pancreatic tissue and μmols MDA formed/min/gHb for hemolysate.
Glutathione
Estimation of reduced glutathione was carried out in the tissue and hemolysate according to the method of Ellman [17]. In this method 5, 5' dithio (2-nitrobenzoic acid) (DTNB) is reduced by sulphydryl groups to form one mole of 2-nitro 5-mercaptobenzoic acid per mole of SH group. The nitromercaptobenzoic acid anion has an intense yellow colour, which absorbed maximum at 412 nm. Units for GSH are μmols non protein –SH/g for tissue homogenate and μmols non protein –SH/gHb for hemolysate.
Estimation of Pro-Inflammatory Cytokine (TNF-Α) and Anti-Inflammatory Cytokine (IL-10)
Serum tumor necrosis factor-α (TNF-α) estimations were done according to the manufacturer protocol provided (Diaclone, France). Serum IL-10 estimations were done in accordance to the manufacturer protocol provided in rat IL-10 ELISA kit (BioVendor, Czech Republic). Units for TNF-α and IL-10 are expressed as pg/mL.
HISTOPATHOLOGICAL EXAMINATION
Haematoxylin and Eosin stain
Light microscopic studies were done to analyse histoarchitecture of the pancreas in all the groups. Samples of pancreatic tissues were fixed in buffered 10% formalin for at least 24 hours before processed through serial changes of alcohol, xylene and then embedded in paraffin. Paraffin sections were cut at 3 μm thick. The slides were then de-paraffinized in xylene, rehydrated through decreased concentration of alcohol. The slides were then placed in haematoxylin stain for 15 minutes followed by water wash and dip in acid alcohol and then kept under running water for 15 minutes. This was followed by eosin treatment for 5 minutes, washed with water and dehydrated in ascending concentrations of alcohol and cleared in xylene. The slides were than mounted in DPX.
Histologic scoring of necrosis, inflammation, edema, acinar atrophy, fibrosis, and fat infiltration were performed as follows: 0, 0%; 1, 0-25%; 2, 25-50% and 3, >50%, in the total area of the specimen [18].
Masson Trichrome Stain
MT stain was used for the detection of collagen fibers in pancreatic tissues. Nuclei stained black colour, while muscle, cytoplasm, keratin were in red colour and collagen, mucus were in blue or green colour. Histopathological scoring of MT stain slides were done by the already used criteria [19].
Collagen Deposition
1. Absent
2. Thin fibrous band around acini
3. Moderate thickened fibrous band around acini
4. Marked homogenous collagen around acini
5. Immunohistochemistry Staining for α-SMA
It was carried out on 3 μm thick paraffin sections mounted on poly lysine coated slides. Activated pancreatic stellate cell were evaluated using mouse anti-actin, smooth muscle monoclonal antibody. Sections on the slide were encircled and fixed for one hour at 60°C in hot air oven. De-paraffinized in xylene (four grades for 5 minute each). Then sections were rehydrated by keeping in descending concentrations of alcohol. Endogenous peroxide activity of leukocytes and erythrocytes of sections was blocked in endogenous block solution for 20 minutes in 0.03% H2O2. Slides were then rinsed in distilled water and washed in PBS for 5 minutes. Slides were laid flat in humid chamber and diluted primary antibody (1:100 anti-actin, smooth muscle monoclonal antibody) was added onto the sections and incubated for 2 hours. After this slides were washed with PBS for five minutes in three grades. Again excess of buffer were wiped off and secondary antibody was added onto the sections and allowed to incubate for 40 minutes in humid chamber. Then slides were washed with PBS and treated with chromogenic substrate of peroxidase a solution of 0.05% 3,3 diaminobenzidine tetrachloride, 0.03% H2O2 in 0.05M tris buffer (PH 7.6). After that slides were again washed with PBS and counterstained lightly with haematoxylin for two minute. Then slides were dipped in acid alcohol followed by distilled water for five minute for bluing. Slides were dried and cleared in xylene and mounted in DPX.
Reverse Transcription-Polymerase Chain Reaction
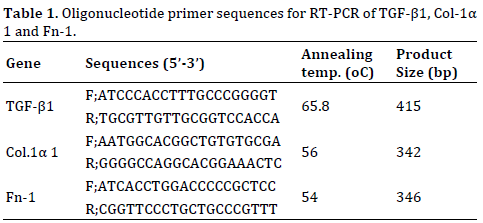
Total RNA was isolated from pancreatic tissue by TRIzol method. Single stranded- RNA was reverse transcribed into cDNA using Thermo scientific RevertAid first strand cDNA synthesis kit. The cDNA synthesized from mRNA was used as a template for PCR amplification using specific oligonucleotide primers. The templates were subjected to initial denaturation at 95°C followed by cycles of denaturation, annealing and extension using thermal cycler. Primer sequences, annealing temperature and product size are given in Table 1. Each reaction was carried out in a total volume of 25 μL containing 1X Taq buffer, 0.2 mM dNTPs, 0.5 mM MgCl2, 0.5 pmol/μL of forward and reverse primers, 1U of Taq DNA polymerase and 2 μL of cDNA template. PCR products were resolved on a 1-2% agarose gel, stained in ethidium bromide, according to the size of the product along with 100bp DNA ladder.
Agarose Gel Electrophoresis
Agarose gel electrophoresis was performed by the method of Sambrook et al. (1989). The percentage of gel varied from 1.5-2.0% depending on the size of the PCR product to be visualized. Gel was cast and run in 1X TBE (45 mM Tris/Boric acid pH 8.0 containing 1 mM EDTA) at 8-10 V/cm. Concentrated (6X) gel loading dye (0.25% bromophenol blue, 0.25% xylenecynol and 30% glycerol) was used for loading the samples (final concentration 1X). Ethidium bromide (0.5 μg/ml) was used for staining the agarose gel. The gel picture was then taken on gel documentation system (Alpha Innotech). The resulting bands were quantified with Image-J software and the results were compared with the control.
Statistical Analysis
All values were presented as mean ± standard deviation (SD). Statistical analysis of the data was accomplished using either student’s t-test for comparison of two groups or analysis of variance (ANOVA) with Newman-Keuls post hoc test for comparison of more than two groups. Chi square test was applied for comparison of the categorical data. Histopathological differences of scores were tested using Man-Whitney U test. Probability Values less than 0.05 were considered statistically significant. Statistical analyses were performed by using SPSS version 10.0 for Windows (SPSS, Inc., Chicago, IL).
RESULTS
Animals
It has been observed that rats were sluggish and they were lethargic with administration of second dose of L-arginine. This phase remain same for 1-3 hr after that they gradually become active again. As far as condition of rats, we observed that after 72 hr of L-arginine injection they were less active compared with control rats. These changes were not observed in the control group of rats, which were injected with comparable doses of saline alone.
Weight of Animals in Different Groups
Baseline weight (mean±SD) of control animals group 1, arginine treated animals group 2, group 3, group 4 and group 5 were 194±10.5 g, 198±12.5 g, 195±8.7 g, 210±11.8 and 200±7.4 g respectively. There were reduction in the body weight of the animals following arginine treatment however significant reduction were observed only in group 4 (185.5±15.0 g) and in group 5 (170.5±8.0 g). There was no reduction in the body weight of the animals in control group (215±13.6 g) although there was slight increase in their body weight which was not statistically significant (Figure 2).
Figure 2. Weight of animals in different groups.
Weight of Pancreas, Serum Amylase and Lipase Levels in Different Groups
Weight of pancreas (mean ± SD) were 3.0±0.19 g in control rats i.e group 1, 2.5±0.33 g in group 2, 2.2±0.25 g in group 3, 1.9±0.23 g in group 4, 1.8±0.19 g in group 5. Arginine treated animals in all the groups have significantly reduced pancreatic weight as compared to control rats (Table 2).
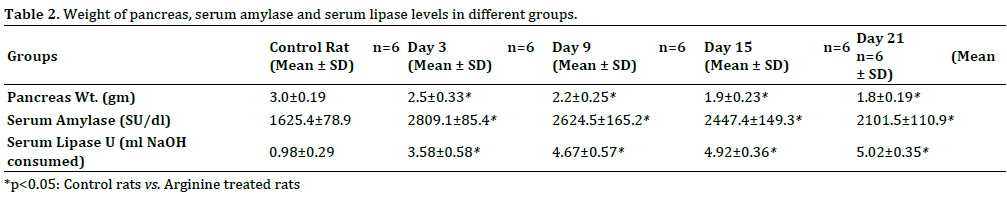
Levels of serum amylase were 1625.4±78.9 S.U in group 1 (control), whereas 2809.1±85.4 S.U in group 2, 2624.5±165.2 S.U in group 3, 2447.4±149.3 S.U in group 4 and 2101.5±110.9 S.U at day 21 in arginine treated animals (Table 2; Figure 3a). There were significant increase in the levels of serum amylase in arginine treated animals in all the groups when compared with control animals however maximum increase was observed on day 15.
Figure 3. (a). Levels of serum amylase in different groups. (b). Levels of serum lipase in different groups.
Levels of serum lipase were 0.98±0.29 in group 1, 3.58±0.58 in group 2, 4.67±0.57 in group 3, 4.92±0.36 in group 4 and 5.02±0.35 in group 5. There was significant increase in the levels of serum lipase followed arginine treatment in all the groups (Table 2; Figure 3b).
ANTIOXIDANT DEFENSE SYSTEM
Lipid Peroxidation Levels at Different Time Intervals
In the present study, MDA levels acted as a direct indicator of lipid peroxidation (LPO). Levels of pancreatic tissue LPO are expressed as nmoles MDA formed/min/100 mg protein. Pancreatic LPO was increased significantly (p<0.001) in the pancreas of rats in arginine group 7.23±0.63 on day 3, 8.52±1.22 on day 9, 8.0±1.14 on day 15 and 8.12±0.69 on day 21 as compared to levels in pancreas of control animals i.e 3.52±0.35. Peak pancreatic LPO levels were observed in group 3 (Figure 4).
Figure 4. LPO and GSH levels in pancreatic tissue and RBCs hemolysate of rats subjected to arginine treatment at different time intervals.
Data presented as mean±SD, n=6, *p<0.05: Control rat’s vs. Arginine treated rats
Values of pancreatic LPO were expressed in nmoles MDA formed / min/100 mg protein.
Values of hemolysate LPO were expressed in μmol MDA formed/g Hb.
Values of pancreatic tissue GSH were expressed in μmols of non-protein -SH/g tissues.
Values of hemolysate GSH were expressed in μmols of nonprotein –SH/g Hb.
Levels of LPO in hemolysate are expressed as μmoles of MDA formed/g Hb. LPO levels were increased significantly (p<0.001) in the hemolysate of rats in arginine treated groups on day 3 (6.86±0.78), on day 9 (7.25±1.0), on day 15 (7.23±0.65) and on day 21 (6.88±0.93) when compared to hemolysate of control animals i.e 3.2±0.48 (Figure 4).
Reduced Glutathione Levels at Different Time Intervals
Levels of pancreatic tissue GSH are expressed as μmoles of nonprotein-SH/g tissue. In the present study, arginine treatment to rats showed a significant decrease (p<0.001) in GSH levels on day 3 (0.58±0.12), on day 9 (0.54±0.21), on day 15 (0.60±0.14) and on day 21 (0.58±0.15) as compared to pancreatic GSH of control rats (2.47±0.36) (Figure 4).
Values of GSH in hemolysate reflected almost similar changes as in pancreatic tissue because the oxidative stress also increased in the blood stream. Levels of GSH in hemolysate are expressed as μmoles of nonprotein-SH/g Hb. In the present study, arginine treatment to rats showed a significant decrease (P<0.001) in GSH levels on day 3 (0.65±0.16), on day 9 (0.56±0.14), on day 15 (0.52±0.16) and on day 21 (0.51±0.18) as compared to GSH level in hemolysate of control rats i.e 3.65±0.23 (Figure 4).
Serum Tumor Necrosis Factor (TNF-Α) and Serum IL- 10 Levels
Serum TNF-α level in arginine group showed gradual increase till day 21. Compared to values of control group i.e 7.50±2.89, statistically significant difference was observed till day 21. Mean serum values of TNF- α were 25±4.08 on day 3, 31.25±4.79 on day 9, 33.75±8.54 on day 15 and 40±8.3 on day 21. Peak TNF-α level in serum were observed at day 21 (Figure 5a).
Figure 5. Levels of serum tumor necrosis factor (TNF-α) and serum IL-10 subjected to arginine treatment at different time intervals.
In control group, low levels of IL-10 are found in serum. But once pancreatitis is induced, the serum levels are increased as a defence mechanism. Levels of IL-10 are expressed as pg/ml. In arginine group, levels of serum IL- 10 were significantly higher compared to levels of control group i.e 122.5±35.94 till day 21 (Figure 5b). Mean serum values of IL-10 in arginine group were 592.25±85.39 on day 3, 635±145.20 on day 9, 602.5±149.30 on day 15 and 591.25±110.87 on day 21. Peak IL-10 levels in serum were observed at day 9 after that the levels declined.
Histopathological Changes
Experimental acute pancreatitis was seen histopathologically on day 3 in all animals who received intraperitoneal injection of arginine. The scores of histological grades for each rat were added up in each group separately and used for the purpose of mean histopathological score of the group (Figure 6a). On day 3, arginine treatment caused necrosis, inflammation and edema in pancreatic acinar cells (Figure 6b). The exocrine pancreas of 6/6 animals showed necrosis and their score was 2.83±0.41, 3/6 animals showed inflammation with score 2.33±0.51 and 6/6 animals showed edema with score 2.0±0.89. These histopathological scores were significantly higher as compare to control animals (group 1).
Figure 6. Histoarchitecture of rat pancreas showing; (a). Control group; showing normal histological appearance depicting pancreatic acini and islets of langerhans (b). Arginine group sacrificed on day 3; showing acinar necrosis, edema and inflammation. (c). Arginine group sacrificed on day 9; showing acinar necrosis, edema and inflammation. (d). Arginine group sacrificed on day 15; showing inflammation, fibrosis, acinar atrophy and fat infiltration. (e). Arginine group sacrificed on day 21; showing fat infiltration, fibrosis, inflammation and acinar atrophy [H and E; (a-e), X40]; (f). Comparison of individual mean histopathological scores in different groups.
Changes of the pancreatitis were seen histopathologically in all animals, who received intraperitoneal injection of arginine and sacrificed on day 9. In arginine treated group, exocrine pancreas of 6/6 animals showed necrosis and their score was 1.83±0.41, 3/6 animals showed inflammation with score 2.16±0.40 and 6/6 animals showed edema with score 0.50±0.83 (Figure 6c). Mean individual histopathological scores of necrosis and inflammation were significantly higher (p<0.05) as compared to control group.
On day 15 after 5 episodes of repeated (every 3rd Day) acute injury to pancreas, resulted interlobular and intralobular fibrosis which replaced 30% of exocrine pancreas (Figure 6d). Fat infiltration (5-10%) was seen only in one animal on day 15. In arginine treated group, 4/6 animals showed inflammation and their score was 1.16±0.98, 6/6 animals showed fibrosis with score 1.6±0.82, 1/6 animal had mild fat infiltration with score 0.5±0.83 and 5/6 animals showed acinar atrophy with score 1.33±0.51. Individual histopathological scores for inflammation, fibrosis and acinar atrophy in group 4, were significantly higher (p<0.05) as compared to group 1.
With continuation of repeated acute injury till day 19, exocrine pancreas showed extensive fat infiltration (30- 50%) and fibro inflammatory changes (Figure 6e). Only 5-10% of normal exocrine parenchyma persisted till day 21. In arginine treated group exocrine pancreas of 3/6 animals showed inflammation and their score was 0.66±0.82, 6/6 animals showed fibrosis with score 2.3±0.52, 6/6 animal had fat infiltration with score 2.5±0.55 and 5/6 animals showed acinar atrophy with score 1.33±0.51. Individual histopathological scores for inflammation, fibrosis, fat infiltration and acinar atrophy were significantly higher (p<0.05) as compared to control group (Figure 6f).
Islets and blood vessels were normal at all stages. However, normal histoarchitecture of acinar cells, were observed in control rats (Figure 6a). So, it is clearly indicated that repeated episodes of acute pancreatitis (every 3rd day) cause severe chronic pancreatitis on day 21.
Collagen Deposition Studies
Masson-Trichrome (MT) stain was used to detect collagen deposition in pancreatic tissue. Significant fibrosis was observed only on day 15 and day 21 in arginine treated animals which is a typical feature of chronic pancreatitis. However, there is no fibrosis on day 3 and 9.
MT stained slides showed a marked homogenous deposition of collagen content in interlobular and intralobular area of the pancreas in arginine treated animals on day 15. Their score were significantly higher (p<0.01) as compared to control animals (Figure 7a) on day 15. Collagen deposition in pancreatic tissue was also observed on day 21, exocrine pancreas showed extensive fat infiltration (30-50%) and fibro inflammatory changes. MT stain slides showed moderate to marked collagen content in interlobular and intralobular area of the pancreas in arginine treated group. Their scores were significantly higher (p<0.01) as compared to control group (Figure 7a). Collagen deposition scores in group 4 and group 5 was significantly elevated when compared with group 1 (control animals) (Figures 7 b-f).
Figure 7. Histoarchitecture of rat pancreas showing; (a). Control group; pancreatic parenchyma showing normal histological appearance depicting normal pancreatic acini. (b). Arginine group sacrificed on day 3; showing necrosis, edema and inflammation but no collagen deposition. (c). Arginine group sacrificed on day 9; showing acinar necrosis, edema and inflammation but no collagen deposition. (d). Arginine group sacrificed on day 15; showing interlobular and intralobular collagen deposition. (e). Arginine group sacrificed on day 21; showing interlobular and intralobular collagen deposition [MT Stain; (a-e), X20]; (f). Comparison of collagen deposition scores in different groups.
Immunohistochemistry
Pancreatic fibrosis is driven by the activated PSCs and α-SMA expression is the most commonly used marker for activation of PSCs. No expression of α-SMA (+) activated PSCs was observed in the pancreas of control animals except around the vascular structure (Figure 8a). On day 3 and on day 9, expression of α-SMA (+) activated PSCs was not observed in any group animals except around the vascular structure (Figure 8b, 8c). On day 15 (group 4), α-SMA (+) activated PSCs were present in more than 75% of acini in arginine treated all animals i.e 6/6 (Figure 8d). In group 5 (day 21), α-SMA (+) activated PSCs were present in 25-50% of acini in arginine treated all animals i.e 6/6 (Figure 8e).
Figure 8. Histoarchitecture of rat pancreas showing; (a). Control group; showing normal pancreas, lobular organization is intact and α-SMA (+) PSCs can be seen only around the vessel walls but not in pancreatic parenchyma. (b). Arginine group sacrificed on day 3; showing α-SMA (+) PSCs only around the vessel walls. (c). Arginine group sacrificed on day 9; showing α-SMA (+) PSCs only around the vessel walls. (d). Arginine group sacrificed on day 15; showing α-SMA (+) activated PSCs in >75% area of pancreas. (e). Arginine group sacrificed on day 21; showing α-SMA (+) PSCs in 25-50% of acini. [IHC: α-SMA Stain; (a-e), X20].
Transcript Levels of TGF-β1, Collagen 1α 1 and Fibronectin 1
The mRNA expression of TGF-β1, Collagen 1α 1 and Fn-1 genes were assessed in the pancreatic tissues, obtained from rats of different groups. Wide variations in the mRNA expression were observed. As under normal conditions, these genes are not expressed in pancreas. No expression or fainted bands were observed in control group, but induction of pancreatitis lead to expression of these genes (Figures 9, 10).
Figure 9. Representative agarose gel photograph of TGF-β 1, Col-1α1 and Fn-1 mRNA expression showing ethidium bromide stained bands obtained after electrophoresis.
Figure 10. Fold increase of TGF-β 1, Col-1α1 and Fn-1 mRNA expression relative to control mRNA following arginine treatment in pancreatic tissue of rats in different groups.
In arginine treated animals, maximum fold increase of TGF-β1 mRNA expression relative to control mRNA was observed in group 5 i.e on day 21 (6 fold) when compared to group 1 (control) however there was significant elevation in fold increase at all study time points i.e 1.76±0.15 on day 3, 2.35±0.24 on day 9, 3.45±0.21 on day 15 and 5.47±0.22 on day 21 (Figure 10a).
In arginine treated groups (group 2, 3, 4 and 5), maximum fold increase of Collagen 1α 1 relative to control mRNA was observed in group 4 i.e on day 15 when compared to control. There was elevation in fold increase at all study groups i.e 1.28±0.1 in group 2, 1.82±0.29 in group 3, 11.1±0.46 in group 4 and 10.95±0.33 in group 5 as compared to group 1 but significant elevation were observed only in group 4 and group 5 (Figure 10b).
In arginine treated groups (group 2, 3, 4 & 5), maximum fold increase of Fn-1 relative to control mRNA was observed in group 4 i.e on day 15 when compared to group 1 (control). There was elevation in fold increase at all study groups i.e 1.48±0.16 in group 2, 2.65±0.46 in group 3, 13.4±2.55 in group 4 and 11.42±2.87 in group 5 as compared to group 1 but significant elevation were observed only in group 4 and group 5 (Figure 10c).
DISCUSSION
This study developed a new non-surgical, chronic pancreatitis model of rat that uses repeated intraperitoneal injection of L-arginine hydrochloride. In the present study, it was observed that body weight increased gradually in control rats up to day 21. However, in arginine treated rats, it was observed that mean body weight, of the animals was significantly less on day 15 and day 21. Reduction in the body weight of arginine treated rats could possibly be due to increase in peroxidation of lipids as a consequence of arginine induced oxidative stress. There are various reports which have confirmed that oxygen free radicals play an important role in the pathomechanism of arginine induced pancreatitis [12, 13].
Serum enzymes i.e amylase and lipase are the diagnostic biochemical tests for pancreatitis [20]. These investigations are technically simple and readily available that’s why they are continued to be used routinely in clinical settings [21]. As far as experimental studies are concerned, estimation of these two enzymes are important parameters in establishing the efficacy of investigational agents and markers for development of pancreatitis. After an acute attack, serum levels of amylase rise within first 12 hours, thus amylase being one of early biochemical marker [22]. In the present study also, a rise in serum levels of amylase was observed after induction of pancreatitis. The significant elevation in serum amylase was observed from day 3 till day 21. Levels of serum lipase were also elevated after arginine treatment compared to control group in present study. Arginine group had significant higher serum lipase values as compared to control. Peak elevation in serum lipase was observed on day 21.
At high concentrations free radicals and ROS preferentially react with the phospholipids of cell membranes inducing lipid peroxidation chain reactions, disintegration of membrane structure and irreversible cell damage [23]. They can also damage other important cellular molecules including DNA and proteins, provoking changes in physiochemical characteristics and subsequently, impairment in functional properties of intracellular proteins [24]. Alterations in membrane integrity by lipid peroxidation and/or protein denaturation could account for the onset of AP and CP. Moreover, ROS are involved in the development of pancreatitis owing to their cytotoxic capacity to damage tissue and are also able to activate neutrophils and macrophages and thus contribute to enhancing the initial inflammatory process [25, 26]. It has been reported in literature that in patients of acute and chronic pancreatitis, levels of LPO increased while levels of GSH decreased when compared to healthy controls [27].
In the present study, increased levels of LPO and reduced level of GSH were observed in the pancreas of rats subjected to arginine treatment. Elevated levels of pancreatic LPO and reduced level of pancreatic GSH content were observed from day 3 till day 21. This finding is consistent with the finding of Schoenberg et al. [23], who reported significant elevation in MDA concentration in pancreatic tissue of acute and chronic pancreatitis individuals. It was also observed in their study that level of reduced glutathione was significantly lower suggesting glutathione depletion due to oxidative stress. Enhanced expressions of MDA as a result of membrane LPO may indirectly reflect oxygen free radicals (OFR) activity [28]. Arginine is responsible for production of OS, which may be the reason for elevation of pancreatic LPO in our study. It has been reported by many of the researchers that arginine produce OS [7, 12, 29]. Increased LPO is associated with a decrease in GSH levels as reduced glutathione would have been consumed by the glutathione related enzymes to detoxify peroxides produced because of increased LPO [30].
Large doses of arginine reduce polyamine biosynthesis and thus inhibit the synthesis of nucleic acids and proteins. As the pancreatic acinar cells are the most active protein synthesizing factory of the body, excessive dose of arginine injures the pancreas. The proposed mechanisms by which arginine causes pancreatitis include generation of oxygen free radicals that may lead to activation of PSCs. It can cause acinar necrosis that lead to activation of cytokine that may lead to activation of PSCs. All have a key role in the development of the pancreatitis [31].
TNF-α is a proinflammatory cytokine and is expressed in pancreatic acinar cells and inflammatory macrophages in rat acute pancreatitis [32]. Cytokines are produced by stimulated macrophages and T Cells [33]. It has been reported that in early phase of acute pancreatitis, TNF-α overexpressed and its expression is related to severity of pancreatitis [34, 35]. In the present study, level of serum TNF-α was found to be significantly elevated in arginine treated group. Significant elevation was observed at all study time points. There was gradual increase in the level of serum TNF-α from day 3 to day 21 and maximum elevation of serum TNF-α was observed on day 21. Czako et al. also reported significant increase in the levels of serum TNF-α in arginine-induced acute necrotizing pancreatitis [36]. Clinical and experimental studies have shown that serum TNF-α is increased in patients with AP [37, 38]. Results of present study clearly indicate that ROS generated by arginine would have activated NF-κB which would have resulted in upregulation of TNF-α in the circulation as well as LPO levels.
IL-10 is an anti-inflammatory cytokine which inhibits the production of proinflammatory cytokines. An elevation in serum IL-10 levels has been observed in experimental acute pancreatitis studies [39]. By down regulating the release of pro-inflammatory mediators, IL-10 limits the severity of acute pancreatitis [40, 41]. Findings of the present study are in agreement with these observations. Induction of pancreatitis caused a marked increase in the serum levels of IL-10 in arginine group compared to controls. Peak serum levels of IL-10 were observed on day 9. Although with time, levels of IL-10 decreased, but were significantly higher compared to controls till day 21. Elevated levels of serum IL-10 compared to controls clearly indicate the occurrence of acinar injury in pancreas by arginine. Possibly, elevated TNF-α levels is involved in upregulation of it’s antagonist IL- 10 in arginine group. Platzer et al. reported that NF- κB-independent mechanism is responsible for TNF-α induced IL-10 gene activation [42]. They also reported that TNF-α and cAMP elevating mediators via induction of IL-10 are part of a negative feedback circuit that control acute inflammatory response.
In the present study gradual increase in the ratio of serum TNF-α/IL-10 found in arginine treated group over the time may be a possible reason for activation of PSCs. Gradual increase in the ratio also indicates that anti-inflammatory cytokine (IL-10) fail to inhibit proinflammatory cytokine response. It may be due to the repeated episodes of acute pancreatitis in the present study.
Histopathological examination is the confirmatory test for establishing the severity of the disease. Histopathological changes in the pancreatic tissue of rats were studied in control and treatment groups. The individual histological scores in control group was zero, indicating normal pancreatic architecture without any damage to pancreatic parenchyma. Administration of arginine caused acute pancreatitis changes as depicted by infiltration of inflammatory cells, edema, necrosis and acinar cell destruction. It has also been already reported that arginine induced pancreatic injury started after 6 hrs and histopathological changes observed in pancreatic acinar cells at 48 hrs and maximum at 72 hrs. But most appropriate time for estimation of pancreatic injury and biochemical parameters is 48 hrs as both plasma amylase and pancreatic MPO activities are observed at 48 hrs [43]. Czako et al. reported that pancreatic MDA levels significantly elevated at 24 hrs and peaked at 48 hrs after administration of 2×250 mg/100 gb. wt arginine over 1 hr gap [36]. Similarly in the present study, animals were sacrificed after 48 hrs of arginine injection to observe the maximum pancreatic changes in pancreatic tissue. All animals in arginine group who were sacrificed on day 15, has shown acinar cell atrophy with altered ductal morphology, inflammatory cell infiltration and intense fibrosis. This is a typical feature of chronic pancreatitis. In continuation of repeated episodes of pancreatitis by giving arginine on day 16 and day 19, animals clearly showed that majority of acinar cells were replaced by fatty infiltration, fibrosis and mild inflammation on day 21. As per results of present work, it is indicated that fibrosis was maximum at day 15 after 5 episodes of acute pancreatitis and fatty infiltration was maximum at day 21 after 7 episodes of arginine induced pancreatitis.
PSCs have been reported to play a vital role in ECM formation. In experimental studies, it has been reported that balance between newly synthesized ECM and it’s degradation is involved in regeneration process of the pancreas [44]. α-SMA is an excellent marker of activated PSCs [1]. Therefore, it was selected in present study as a marker of activated PSCs. In the present study, α-SMA positive cells were observed in arginine group only after 5 episodes of acute pancreatitis on day 15. α-SMA positive activated PSCs were observed in >75% cells. However on day 21 after 7 episodes of acute pancreatitis, moderate i.e 25%-50% α-SMA positive acinar cells were obtained. It is because on day 21 majority of the acinar cells are replaced with fatty infiltration. Similarly, Van Westerloo et al. reported significant increase in α-SMA positive cells in cerulein model of chronic pancreatitis using an IHC staining technique [45]. Yamamoto et al. also reported presence of α-SMA positive cells which represent activated PSCs, in periductal, periacinar and interlobular areas of the pancreas [46].
Kihara et al. reported that peak values of TGF-β1 and fibronectin mRNA expression were obtained on day 2.5 after L-arginine induced AP. These values decreased on day 3 and reached to the level of control on day 7 [44]. It has also been reported that TGF-β1 is a key cytokine that regulates fibrosis and it is persistently elevated in chronic pancreatitis [47]. In the present study, mRNA expression of TGF-β1 increased 4 folds on day 15 and 6 folds on day 21 in arginine treated group. Significantly increased α-SMA positive activated PSCs were also observed in arginine treated group on day 15 and day 21. Therefore, it seems that TGF-β1 is the principal source of activated PSCs in present study. Nathan et al. studied fibrosis related genes like mRNA for Col.1α1, Fn-1, and TGF-β1. They reported that levels of gene expression of procollagen I, Fn1 and TGF-β1 were increased 13, 18 and 6 folds, respectively in cerulein-treated nontransgenic mice [48]. Vogelmann et al. found that ECM in TGF-β1 transgenic mouse pancreas contained mainly collagen type 1 and type III whereas on the level of mRNA, TGF-β1 was overexpressed [49]. At early time point when TGF- β1 was the predominant fibrotic factor, the matrix was mainly composed of Collagen type I and III. However in older mice collagen and fibronectin were the principal component of ECM. In the present study also mRNA expression of Col.1α1 and Fn-1 found to be significantly elevated on day 15 and day 21. It has been reported that collagen synthesis by PSCs get stimulated by TNF-α and IL-10 [32].
To conclude, animal model of CP was developed by I.P injection of arginine (250 mg/100 gb. wt/day) in 2 repeated doses at 1 hour interval on day 1 and repeated I.P injections of arginine (250 mg/100 gb. wt/day) on day 4, 7, 10, 13, 16 and 19. Significant fibrosis with mild fat infiltration was observed on day 15 (after 5 episodes of pancreatitis) and extensive fibrosis with massive fat infiltration was observed on day 21 (after 7 episodes of pancreatitis). This model might be highly advantageous to understand the events related to the pathophysiology of chronic pancreatitis. This is a relatively easy model for development of chronic pancreatitis. This model is having potential of generating information to afford a complete understanding of the molecular mechanisms responsible for the development and progression of chronic pancreatitis.
Core Tip
At present most of the studies have reported fatty infiltration and necrosis in animal model of pancreatitis. But none of them reported significant fibrosis which is a classical feature of chronic pancreatitis. Presently reported method to develop chronic pancreatitis might be highly advantageous to understand the events related to the pathophysiology of development of chronic pancreatitis. as we successfully developed pancreatic fibrosis in pancreatic acinar cells.
Author Contributions: Sharma S Performed experimentation, Acquisition of data and prepared the manuscript, Completion of practical aspects of study, Study analysis and statistical analysis; Nada R Practitioner Histopathologist, reviewed all histological slides and their scoring; Rana SV Study concept and design, Critical revision of the manuscript for important intellectual content, study interpretation; Malhotra S Practitioner Pharmacologist provided help in dose calculation and toxicological analysis; Rana SS and Bhasin DK Practitioner Gastroenterologist and provided valuable feedback of the study & Interpretations of data, Manuscript writing help. Supported by Department of Gastroenterology, PGIMER, Sector-12, Chandigarh, India.
Institutional Review Board Statement: The study was reviewed and approved by the Institute’s Ethics Committee (I.E.C) of PGIMER, Chandigarh.
Institutional Animal Care and Use Committee Statement: The experimental protocols (IAEC protocol number: 49/IAEC/236 and 51/IAEC/252) were approved by Institutional Animal Ethics Committee of Post Graduate Institute of Medical Education and Research, Sector-12, Chandigarh, India.
Conflict-of-Interest Statement
All authors have declared that there is no conflict of interests.
References
- Apte MV, Keogh GW, Wilson JS. Chronic pancreatitis: complication and management. J Clin Gastroenterol 1999; 29:225-240. [PMID: 10509949]
- Witt H, Apte MV, Keim V, Wilson JS. Chronic pancreatitis: challenges and advances in pathogenesis, genetics, diagnosis and therapy. Gastroenterology 2007; 132:1557-1573. [PMID: 17466744]
- Lohr JM. What are the useful biological and functional markers of early-stage chronic pancreatitis? J Gastroenterol 2007; 42:66-71. [PMID: 17238031]
- Mizinuma T, Kawamura S, Kishino Y. Effects of injecting excess arginine on rat pancreas. J Nutr 1984; 114:467-471. [PMID: 6199486]
- Tani S, Itoh H, Okabayashi Y, Nakamura T, Fujii M, Fujisawa T, Koide M, et al. New model of acute necrotizing pancreatitis induced by excessive doses of arginine in rats. Dig Dis Sci 1990; 35:367-374. [PMID: 2307082]
- Delaney CP, McGeeney KF, Dervan P, Fitzpatrick JM. Pancreatic atrophy: a new model using serial intra-peritoneal injections of L-arginine. Scand J Gastroenterol 1993; 28:1086-1090. [PMID: 8303212]
- Hegyi P, Takacs T, Jarmay K, Nagy I, Czako L, Lonovics J. Spontaneous and cholecystokinin-octapeptide-promoted regeneration of the pancreas following L-arginine induced pancreatitis in rat. Int J Pancreatol 1997; 22:193-200. [PMID: 9444550]
- Weaver C, Bishop AE, Polak JM. Pancreatic changes elicited by chronic administration of excess L-arginine. Exp Mol Pathol 1994; 60:71-87. [PMID: 8070543]
- Fredstrom SB, Jessurun J, Gallaher DD. Pancreatitis induced in rats by repetitive administration of L-arginine. Pancreas 2009; 38:344-345. [PMID: 19307932]
- Takacs T, Czako L, Jarmay K, Farkas G, Mandi Y, Lonovics J. Cytokine level changes in L-arginine-induced acute pancreatitis in rat. Acta Physiol Hung 1996; 84:147-156. [PMID: 9046361]
- Varga IS, Matkovics B, Czako L, Hai DQ, Kotorman M, Takacs T, Sasvari M. Oxidative stress changes in L-arginine-induced pancreatitis in rats. Pancreas 1997; 14:355-359. [PMID: 9163781]
- Czako L, Takacs T, Varga IS, Tiszlavicz L, Hai DQ, Hegyi P, Matkovics B, et al. Involvement of oxygen-derived free radicals in L-arginine-induced acute pancreatitis. Dig Dis Sci 1998; 43:1770-1777. [PMID: 9724167]
- Takacs T, Hegyi P, Jarmay K, Czako L, Gog C, Rakonczay Z, Németh J, et al. Cholecystokinin fails to promote pancreatic regeneration in diabetic rats following the induction of experimental pancreatitis. Pharmacol Res 2001; 44:363-372. [PMID: 11712866]
- Somogyi M. Modifications of two methods for the assay of amylase. Clin Chem 1960; 6:23-35. [PMID: 13832788]
- MacDonald RP, LeFave RO. Serum lipase determination with an olive oil substrate using a three-hour incubation period. Clin Chem 1962; 8:509-519.
- Ohkawa H, Ohishi N, Yagi K. Assay for lipid peroxides in animal tissues by thiobarbituric acid reaction. Anal biochem1979; 95:351-358. [PMID: 36810]
- Ellman G. Tissue sulphydryl groups. Arch Biochem Biophys 1959; 82:70-77. [PMID: 13650640]
- Su SB, Motoo Y, Xie MJ, Sakai J, Taga H, Sawabu N. Expression of pancreatitis-associated protein (PAP) in rat spontaneous chronic pancreatitis: effect of herbal medicine Saiko-keishi-to (TJ-10). Pancreas 1999; 19:239-247. [PMID: 10505754]
- Tasci I, Mas MR, Vural SA, Comert B, Alcigir G, Serdar M, Mas N, et al. Rat liver fibrosis regresses better with pegylated interferon alpha2b and ursodeoxycholic acid treatments than spontaneous recovery. Liver Int 2006; 26:261-268. [PMID: 16448466]
- Greenberger NJ, Toskes PP. Acute and chronic pancreatitis. In: Hauser K, Longob B, Jamson F, editors. Harrison’s principles of internal medicine. New York: Mc Graw- Hill; 2005. p.1895-1906. [Book]
- Yadav D, Agarwal N, Pitchumoni CS. A critical evaluation of laboratory tests in acute pancreatitis. Am J Gastroenterol 2002; 97:1309-1318. [PMID: 12094843]
- Matull WR, Pereira SP, O’Donohue JW. Biochemical markers of acute pancreatitis. J Clin Pathol 2006; 59:340-344. [PMID: 16567468]
- Schoenberg MH, Dieter B, Beger HG. Oxidative stress in acute and chronic pancreatitis. Am J Clin Nutr 1995; 62:1306S-1314S. [PMID: 7495225]
- Reinheckel T, Nedelev B, Prause J, Augustin W, Schulz HU, Lippert H, Halangk W. Occurrence of oxidatively modified proteins: an early event in experimental acute pancreatitis. Free Radic Biol Med 1998; 24:393-400. [PMID: 9438551]
- Malfertheiner P, Domínguez-Muñoz JE, Büchler MW. Chronic pancreatitis: management of pain. Digestion 1994; 55 Suppl 1:29-34. [PMID: 7510657]
- Poch B, Gansauge F, Rau B, Wittel U, Gansauge S, Nussler AK, Schoenberg M, et al. The role of polymorphonuclear leukocytes and oxygen-derived free radicals in experimental acute pancreatitis: mediators of local destruction and activators of inflammation. FEBS Lett 1999; 461:268-272. [PMID: 10567709]
- Czeczot H, Majewska M, Skrzycki M, Podsiad M. Activity of GSHdependent enzymes in blood serum of patients with acute and chronic pancreatitis. Wiad Lek 2009; 62:87-92. [PMID: 20141055]
- Sevillano S, de la Mano AM, Manso MA, Orfao A, De Dios I. N-acetylcysteine prevents intra-acinar oxygen free radical production in pancreatic duct obstruction-induced acute pancreatitis. Biochim Biophys Acta 2003; 1639:177-184. [PMID: 14636949]
- Jacewicz D, Dabrowska A, Wyrzykowski D, Pranczk J, Wozniak M, Kubasik-Juraniec J, Knap N, et al. A novel biosensor for evaluation of apoptotic or necrotic effects of nitrogen dioxide during acute pancreatitis in rat. Sensors (Basel) 2010; 10:280-291. [PMID: 22315540]
- Cathcart RF. Vitamin C: the nontoxic, nonrated-limited, antioxidant free radical scavenger. Med Hypothesi 1985; 18:61-77. [PMID: 4069036]
- Hegyi P, Rakonczay Z, Sari R Góg C, Lonovics J, Takács T, Czakó L. L-arginine induced experimental pancreatitis. World J Gastroenterol 2004; 10:2003-2009. [PMID: 15237423]
- Mews P, Phillips P, Fahmy R, Korsten M, Pirola R, Wilson J, Apte M. Pancreatic stellate cells respond to inflammatory cytokines: potential role in chronic pancreatitis. Gut 2002; 50:535-541. [PMID: 11889076]
- Fink GW, Norman JG. Intrapancreatic interleukin-1 beta gene expression by specific leukocyte populations during acute pancreatitis. J Surg Res 1996; 63:369-373. [PMID: 8661228]
- Brivet FG, Emilie D, Galanaud P. Pro-and anti-inflammatory cytokines during acute severe pancreatitis: an early and sustained response, although unpredictable of death. Crit Care Med 1999; 27:749-755. [PMID: 10321665]
- Kaufmann P, Tilz GP, Lueger A, Demel U. Elevated plasma levels of soluble tumor necrosis factor receptor (sTNFRp60) reflect severity of acute pancreatitis. Intensive Care Med 1997; 23:841-848. [PMID: 9310801]
- Czako L, Takacs T, Varga IS, Tiszlavicz L, Hai DQ, Hegyi P, Matkovics B, et al. Oxidative stress in distant organs and the effects of allopurinol during experimental acute pancreatitis. Int J Pancreatol 2000; 27:209-216. [PMID: 10952403]
- Kim H, Seo JY, Kim KH. NF-kappaB and cytokines in pancreatic acinar cells. J Korean Med Sci 2000; 15:S53-S54. [PMID: 10981515]
- Osman MO, Gesser B, Mortensen JT, Matsushima K, Jensen SL, Larsen CG. Profiles of pro-inflammatory cytokines in the serum of rabbits after experimentally induced acute pancreatitis. Cytokine 2002; 17:53-59. [PMID: 11886171]
- Rongione AJ, Kusske AM, Reber HA, Ashley SW, McFadden DW. Interleukin-10 reduces circulating levels of serum cytokines in experimental pancreatitis. J Gastrointest Surg 1997; 1:159-165. [PMID: 9834343]
- Kusske AM, Rongione AJ, Ashley SW, McFadden DW, Reber HA. Interleukin-10 prevents death in lethal necrotizing pancreatitis in mice. Surgery 1996; 120:284-288. [PMID: 8751594]
- Van Laethem JL, Robberecht P, Resibois A, Deviere J. Transforming growth factor beta promotes development of fibrosis after repeated courses of acute pancreatitis in mice. Gastroenterology 1996; 110:576-582. [PMID: 8566606]
- Platzer C, Meisel C, Vogt K, Platzer M, Volk HD. Up-regulation of monocytic IL-10 by tumor necrosis factor-alpha and cAMP elevating drugs. Int Immunol 1995; 7:517-523. [PMID: 7547677]
- Dawra R, Sharif R, Phillips P, Dudeja V, Dhaulakhandi D, Saluja AK. Development of a new mouse model of acute pancreatitis induced by administration of L-arginine. Am J Physiol Gastrointest Liver Physiol 2007; 292:G1009-G1018. [PMID: 17170029]
- Kihara Y, Tashiro M, Nakamura H, Yamaguchi T, Yoshikawa H, Otsuki M. Role of TGF-beta1, extracellular matrix, and matrix metalloproteinase in the healing process of the pancreas after induction of acute necrotizing pancreatitis using arginine in rats. Pancreas 2001; 23:288-295. [PMID: 11590325]
- Van Westerloo DJ, Florquin S, de Boer AM, Daalhuisen J, de Vos AF, Bruno MJ, van der Poll T. Therapeutic effects of troglitazone in experimental chronic pancreatitis in mice. Am J Pathol 2005; 166:721-728. [PMID: 15743784]
- Yamamoto M, Otani M, Otsuki M. A new model of chronic pancreatitis in rats. Am J Physiol Gastrointest Liver Physiol 2006; 291:G700-G708. [PMID: 16959955]
- Gomez JA, Molero X, Vaquero E, Alonso A, Salas A, Malagelada JR. Vitamin E attenuates biochemical and morphological features associated with development of chronic pancreatitis. Am J Physiol Gastrointest Liver Physiol 2004; 287:G162-G169. [PMID: 15001429]
- Nathan JD, Romac J, Peng RY. Protection against chronic pancreatitis and pancreatic fibrosis in mice overexpressing pancreatic secretory trypsin inhibitor. Pancreas 2010; 39:e24-e30. [PMID: 19904222]
- Vogelmann R, Ruf D, Wagner M, Adler G, Menke A. Effects of fibrogenic mediators on the development of pancreatic fibrosis in a TGF-beta1 transgenic mouse model. Am J Physiol Gastrointest Liver Physiol 2001; 280:G164-G172. [PMID: 11408269]