Keywords
Costs and Cost Analysis; Pancreatitis
INTRODUCTION
Health care spending for digestive diseases in the United States has climbed to unprecedented heights. In 2011, aggregate costs for inpatient management of digestive diseases totaled $36 billion [1]. This represents roughly 4.7% of the total U.S. health care expenditure [2]. It ranks as the fourth most costly Major Diagnostic Category [1] behind diseases of the circulatory system, musculoskeletal and connective tissues, and respiratory system.
Among all hospital admissions for digestive diseases, acute pancreatitis is the most common principle diagnosis [3]. Over the last 20 years, the number of hospitalizations for acute pancreatitis has increased [1, 4]. The associated aggregate costs also increased to an estimated $9.8 billion in 2011 [1]. Hospital and facility charges remain the largest contributor to spending in acute pancreatitis accounting for $2 billion every year [5].
Within the U.S health care system, spending varies considerably across state lines. This discrepancy is consistently demonstrated in higher per capita spending in states located within New England and the Mideast versus those in the Southwest and Rocky Mountain region [6]. Understanding these state-by-state differences in costs is critical for developing effective policies geared toward delivery of more efficient care [7].
Acute pancreatitis serves as a suitable model for understanding regional cost variation in health care spending. Such variation is notable because the inpatient management of acute pancreatitis is relatively standardized: supportive care, fluid resuscitation and nutritional support [8]. The aim of this study was to evaluate the determinants of costs for acute pancreatitis and assess the degree of state level variation in inpatient costs.
MATERIALS AND METHODS
Data Source and Study Population
The Health Care and Utilization Project Nationwide Inpatient Sample (HCUP-NIS) from 2010 was utilized for cost determination and regional variation analysis. HCUPNIS is an inpatient care database derived from a 20% stratified sample of discharges from community hospitals in the United States. In 2010, HCUP-NIS covered 1051 hospitals across 45 states, excluding Alabama, Delaware, Idaho, New Hampshire and North Dakota [9].
The study population was selected by using the principle diagnosis of acute pancreatitis from coding by the International Classification of Disease, Ninth Revision, Clinical Modification (ICD-9 CM). All inpatient hospitalizations for acute pancreatitis with ICD-9 CM code 577.0 were identified from 2010.
Cost Determinants: Patient and Hospital Level Covariates
To evaluate the impact of state-level factors, costs were first adjusted for patient demographics, hospital characteristics as well as case-mix variables. Continuous variables were described using means and categorical variables using percentages.
Patient Demographics
Patient demographic variables included age, gender and race. Patient age was included as a continuous variable expressed in years. Gender was expressed as a categorical variable: male or female. Race and ethnicity comprised six categories: White, Black, Hispanic, Asian or Pacific Islander, Native American and other.
Patient income and type of insurance were also incorporated in the analysis of regional costs. The median household income in a given state was grouped into 4 categories: $1-38,999, $39,000-47,999, $48,000-62,999 and $63,000 or greater. Insurance type included Medicare, Medicaid, private including HMO, self-pay, no charge and other.
Hospital Characteristics
Hospital level variables of interest included bed size, ownership and teaching status. HCUP classified hospital bed size as small, medium or large. The categories for bed size were determined by region with consideration of location (rural versus urban) and teaching status. Hospital ownership and control was designated as public, private non-profit and private for profit. Teaching and nonteaching status of hospitals were identified.
Case-Mix Variables
Case-mix variables included the All Patient Refined Disease Related Group (APRDRG) severity index. The APRDRG severity index is a graded system describing functional impairment from pre-existing comorbidities and consists of five categories: no class specified, minor, moderate, major and extreme loss of function. The APRDRG does not provide an itemized list of individual patient comorbidities, but rather reflects the degree of clinical and physiologic decompensation resulting in increased resource consumption and costs of patient care.
Data Analysis
The costs for inpatient management of acute pancreatitis were derived from the HCUP-NIS for available states with state location serving as the primary independent variable. Costs were obtained from hospital charges by applying the HCUP cost-to-charge ratio, a conversion factor derived from all-payer inpatient financial reports obtained by the Centers for Medicare and Medicaid Services [10].
Multivariable linear regression analysis was performed to identify independent cost determinants associated with increased costs per hospitalization. The covariates of interest included patient demographics, hospital characteristics and case mix variables as detailed above. The F test was used to assess one-way variance of each cost determinant.
Given the skewed distribution of costs, linear regression was performed using log-transformation of inpatient costs. Subsequently smearing retransformation was used to obtain a non-parametric estimate of costs on the untransformed scale [11]. Serial adjustments were performed including all suspected cost determinants since they were presumed to be potential confounders.
States were ranked in terms of both unadjusted and adjusted cost per hospitalization and divided into tertiles for further analyses. Within each cost tertile, hospitalizations for acute pancreatitis were evaluated for the administration of enteral or parenteral nutrition, mechanical ventilation, length of stay and in-hospital mortality.
Hospitalizations requiring enteral or parental infusions of concentrated nutritional substances and mechanical ventilation were identified by their respective ICD-9 CM procedure codes. Mechanical ventilation served as a surrogate for identifying severe sepsis resulting in endorgan dysfunction [12]. Other outcome measures included length of stay, a continuous variable in days, and mortality, a categorical variable reflecting patient vital status at discharge.
All statistical analysis was performed in SAS statistical software, version 9.2. All reported p-values are 2 sided with a level of significance of 0.05. Geographic representation of regional cost variation was generated using DIYMaps.Net.
RESULTS
There were 288,597 (Standard Error 6,516) admissions for acute pancreatitis in 2010. The mean unadjusted cost per hospitalization was $10,069 (S.E. $192). Baseline characteristics of the study population are provided in Table 1. The mean age of patients hospitalized with acute pancreatitis was 51 ± 0.20 years. The majority were between the ages of 45 to 64 (40.82%) and male (51.63%). Most of the patients were White (64.79%), followed by Black (19.14%) and Hispanic (11.07%).
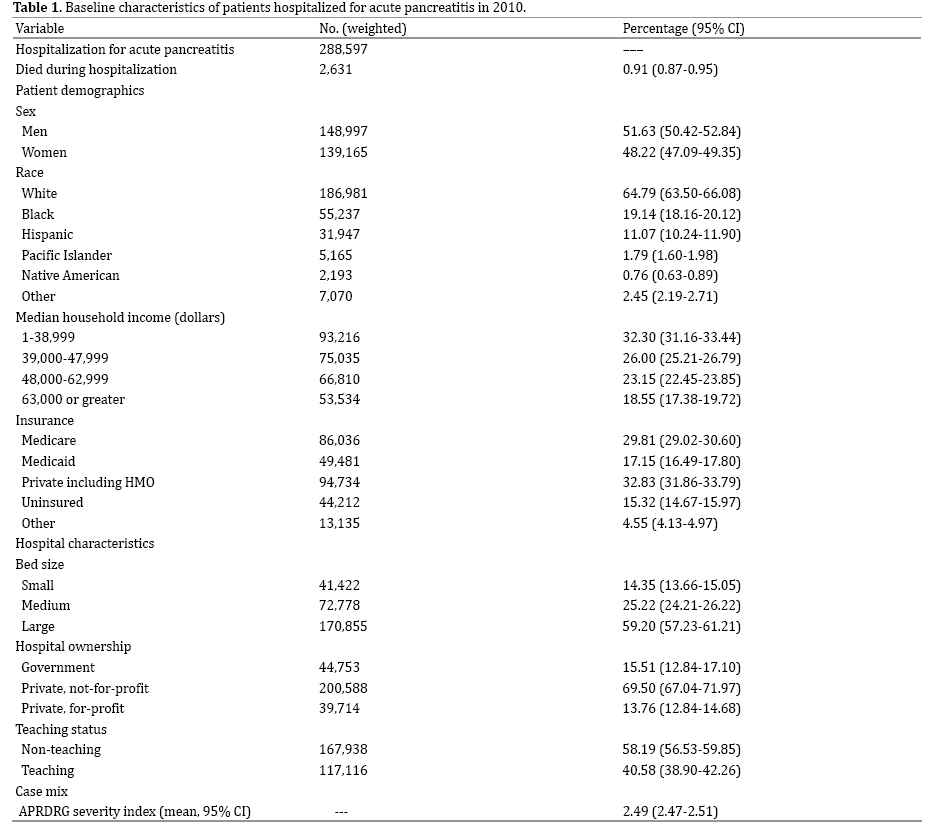
Private insurance covered the majority of hospitalizations (32.84%), followed by Medicare (29.81%). An estimated 170,855 ± 5,699 hospitalizations (59.20%) were in large hospitals and in metropolitan areas. Most acute pancreatitis hospitalizations were in private, not-for-profit facilities (69.50%). The majority of these hospitalizations were in non-teaching hospitals (58.19%). The mean APR DRG severity index score was 2.49 ± 0.02.
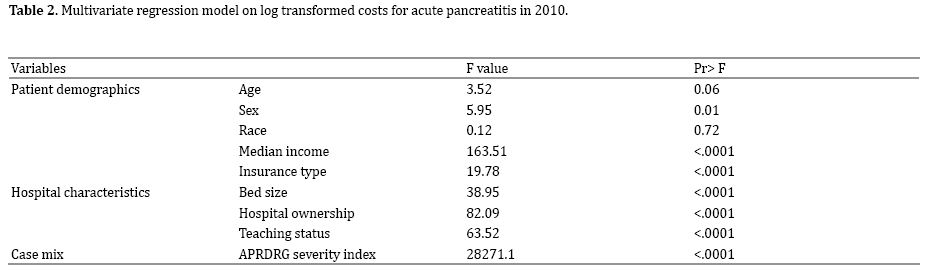
Multivariable linear regression analysis of individual patient and hospital level covariates are shown in Table 2. Patient demographics associated with hospitalization costs for acute pancreatitis include higher median household income (p<0.0001) and private insurance (p<0.0001). Larger hospitals, private ownership and nonteaching hospitals were also associated with increased costs. The case mix variable or APRDRG severity index had the strongest association with cost per hospitalization (p<0.0001).
After serial adjustment for suspected cost determinants, thirty seven available states were ranked by adjusted cost per hospitalization for acute pancreatitis (Table 3). The mean adjusted cost per hospitalization was $12446.48. Beside Vermont and California, the ordinal ranking of the remaining states (94.6%) changed after adjustment. The majority of states (64.9%) demonstrated an increase in post-adjustment cost per hospitalization.
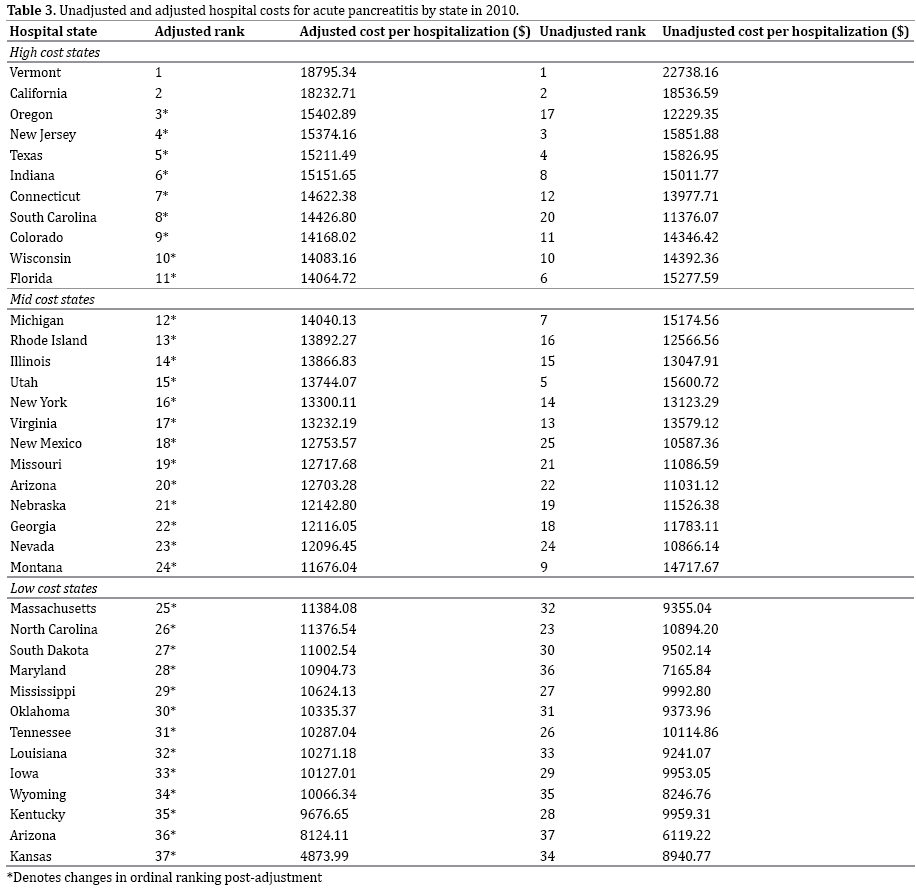
The mean adjusted cost per hospitalization was highest in Vermont ($18,795), followed by California ($18,232) and Oregon ($15,402). Kansas and Arkansas represented the states with lowest mean cost, $4,873 and $8,124, respectively. Mapping of regional cost variation is shown in Figure 1. Low cost states were clustered in the Midwest and Southeast, but included the outliers Maryland and Massachusetts. Mid cost states were concentrated in the Southwest and Midwest. High cost states were located along both coasts, the Northeast and the Great Lakes.
Figure 1. Regional variation by post adjustment cost tertiles for cute pancreatitis in 2010.
The states ranked by adjusted cost per hospitalization were divided into tertiles for further analysis. The highest cost tertile was comprised of Vermont, California, Oregon, New Jersey, Texas, Indiana, Connecticut, South Carolina, Colorado, Wisconsin and Florida. There were significantly more hospitalizations (61,787) in this tertile. High cost states had a greater percentage of Hispanic patients (16.5%), fewer Black patients (15.3%) and higher median household income compared to low cost states.
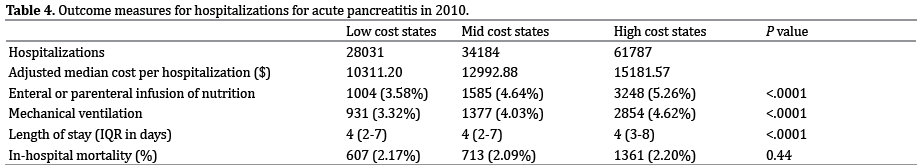
The median cost per hospitalization for high cost states was $15,181.57. Comparatively, the median cost per hospitalization for low and mid cost states was $10,311.20 and $12,992.88, respectively. There was greater use of enteral or parenteral infusion of nutrition and mechanical ventilation (p<0.0001) in high cost states. Although the median length of stay was four days across tertiles, longer hospitalizations were seen in high cost states (p<0.0001). Despite these differences, in-hospital mortality remained similar across tertiles (p=0.44) (Table 4).
DISCUSSION
Inpatient costs for acute pancreatitis varied widely by state. This regional variation persisted after adjusting for patient demographics, hospital characteristics and case mix variables. There was a difference of $4,870 per hospitalization for acute pancreatitis between states from high cost and low cost tertiles. More impressively, the largest difference between individual states was $13,922 per hospitalization.
High costs per hospitalization were expected in certain states, such as those in New England, based on trends in state health care spending per capita [6]. However, changes in the ordinal ranking between states were not always predictable after adjustment for suspected cost determinants. Thirty four states in this study changed ranks after adjustment. Prior regional cost analyses for radical prostatectomy [13], diabetic lower extremity amputation [14] and trauma care [15] demonstrated similar variation suggesting inefficiency in the health care market.
Differences in the consumption of health care resources can drive cost variability. Murata et al [16] identified the use of an intensive care unit (OR 6.44, p<0.001) as the single most significant contributor to hospitalization costs for acute pancreatitis after controlling for length of stay. The administration of antibiotics, continuous intraarterial infusion and enteral nutrition also independently increased the mean cost per hospitalization. Similarly, high cost states were associated with longer hospitalizations, mechanical ventilation usage and supplemental nutrition infusion despite similar case-mix and patient profiles.
From population-based studies, the impact of hospital volume on outcome measures has been demonstrated [17-19]. Hospitals with higher case volumes tend to have better outcomes with lower in-hospital mortality and medical costs [17]. This likely reflects differences in health care team experience, treatment algorithms and organizational efficiency. Centers with high volume of hospitalizations for acute pancreatitis may be better equipped to manage complications with more readily available specialists, interventions and intensive care [18].
More recently, Hamada et al [19] failed to confirm this inverse volume-outcome relationship in acute pancreatitis hospitalizations after adjusting for disease severity. In the present study, cost variation persisted after adjustment for hospital size and teaching status. This suggests that hospital volume is not solely responsible for regional variability. Resource allocation and processes of care, such as the adequacy of early fluid resuscitation [20-22] and the number of hospital transfers, warrants further investigation across cost tertiles.
Examples of successful cost containment strategies can be found by examining low cost states that were outliers in high cost areas. Unlike their regional peers in higher cost tertiles, Maryland and Massachusetts ranked in the low cost tertile after adjustment. There are several potential explanations for this finding. Maryland developed a “macro-oriented” approach whereby all costs for hospital services are set by the Maryland Health Services Cost Review Commission (HSCRC) [23]. Established in 1971, the HSCRC regulates hospital rates.
Massachusetts has implemented other specific strategies in an effort to curb health care costs. In 2008, legislation standardized billing and coding practices within the state. The same legislation also mandated the adoption of electronic medical records by 2015 and banned the acceptance of physician gifts from pharmaceutical companies. A Special Commission on the Health Care Payment System was created to develop payment transparency and a global payment system [24]. Similar efforts could potentially be implemented in high cost states.
The present study has several potential limitations. Individual case details, complications and management decisions were not available from the Nationwide Inpatient Sample. The dependence on identifying cases based on ICD-9 diagnoses is another limitation. Utilization of ICD-9 codes tends to overestimate the number of acute pancreatitis cases [25]. There were a number of potential sources for error at each level of the ICD-9 diagnostic coding process [26]. Additionally, the ICD-9 code for infusion of concentrated nutrition substances did not distinguish enteral from total parenteral nutrition.
The strengths of the study should also be recognized. The study population was drawn from a large, nationally represented database containing all types of patients and providers. Hospital costs rather than charges were calculated and used in analyses. The HCUP cost-tocharge ratio eliminates insurance reimbursements or payment related factors related to hospital charges. Cost adjustments were performed for multiple patient and hospital level covariates. Lastly, the selection of acute pancreatitis as a model for regional cost variation analysis is fitting because early management is largely algorithmic and inexpensive, comprised of supportive care and aggressive fluid resuscitation [20-22].
This study demonstrated persistence of regional variation in costs for inpatient acute pancreatitis care after adjustment for suspected cost determinants. This cost variation suggests inefficient and expensive practices in the delivery of patient care for acute pancreatitis that do not necessarily translate into better outcomes, such as inhospital mortality. Low cost exceptions in geographically high-cost areas such as Maryland and Massachusetts can potentially provide insight on cost effective care strategies without compromising quality.
Conflicts of Interest
The authors have no potential conflicts of interest.
References
- Healthcare Cost and Utilization Project. Updated 2013. Agency for Healthcare Research and Quality, Rockville, MD. Available at: https:// www.ahrq.gov/research/data/hcup/index.html. Accessed April 2014.
- Hartman M, Martin AB, Benson J, et al. National health spending in 2011: overall growth remains low, but some payers and services show signs of acceleration. Health Aff (Millwood). 2013; 32: 87-99. [PMID:23297275]
- Peery AF, Dellon ES, Lund J, et al. Burden of gastrointestinal disease in the United States: 2012 update. Gastroenterology 2012; 143: 1179-1187. [PMID:22885331]
- Fagenholz PJ, Castillo CF, Harris NS, et al. Increasing United States hospital admissions for acute pancreatitis, 1988-2003. Ann Epidemiol. 2007; 17: 491-497. [PMID:17448682]
- Everhart JE, Ruhl CE. Burden of digestive diseases in the United States part 1: overall and upper gastrointestinal diseases. Gastroenterology. 2009; 136: 376-386. [PMID:19124023]
- Cuckler G, Martin A, Whittle L, et al. Health spending by state of residence, 1991-2009. Medicare Medicaid Res Rev. 2011; 1. [PMID:22340779]
- Levit KR, Lazenby HC, Cowan CA, et al. Health spending by state: new estimates for policy making. Health Aff (Millwood). 1993; 12: 7-26. [PMID:8244248]
- Tenner S, Baillie J, DeWitt J, et al. American College of Gastroenterology guideline: management of acute pancreatitis. Am J Gastroenterol. 2013; 108: 1400-1415. [PMID:23896955]
- Introduction to the HCUP Nationwide Inpatient Sample. Updated 2013. Agency for Healthcare Research and Quality, Rockville, MD. Available at: https://www.hcup-us.ahrq.gov/db/nation/nis/NIS_Introduction_2011.jsp. Accessed April 2014.
- Cost-to-Charge Ratio Files: 2010 Nationwide Inpatient Sample User Guide. Updated 2013. Agency for Healthcare Research and Quality, Rockville, MD. Available at: https://www.hcup-us.ahrq.gov/db/state/ costtocharge.jsp. Accessed April 2014.
- Duan N. Smearing Estimate: A Nonparametric Retransformation Method. Journal of the American Statistical Association 2012; 78: 605- 610.
- Lagu T, Rothberg MB, Shieh MS, et al. What is the best method for estimating the burden of severe sepsis in the United States? J Crit Care. 2012; 27: 411-414. [PMID:22516143]
- Makarov DV, Loeb S, Landman AB, et al. Regional variation in total cost per radical prostatectomy in the healthcare cost and utilization project nationwide inpatient sample database. J Urol. 2010; 183: 1504- 1509. [PMID:20172559]
- Yin H, Radican L, Kong SX. A study of regional variation in the inpatient cost of lower extremity amputation among patients with diabetes in the United States. J Med Econ. 2013; 16: 820-827. [PMID:23675824]
- Obirieze AC, Gaskin DJ, Villegas CV, et al. Regional variations in cost of trauma care in the United States: who is paying more? J Trauma Acute Care Surg. 2012; 73: 516-522. [PMID:23019681]
- Murata A, Matsuda S, Mayumi T, et al. Multivariate analysis of factors influencing medical costs of acute pancreatitis hospitalizations based on a national administrative database. Dig Liver Dis. 2012; 44: 143-148. [PMID:21930445]
- Murata A, Matsuda S, Mayumi T, et al. Effect of hospital volume on clinical outcomes in patients with acute pancreatitis, based on a national administrative database. Pancreas. 2011; 40: 1018-1023. [PMID:21926541]
- Shen H, Lu C, Li C. The effect of hospital volume on patient outcomes in severe acute pancreatitis. BMC Gastroenterol. 2012; 12:112. [PMID:22901053]
- Hamada T, Yasunaga H, Nakai Y, et al. Impact of hospital volume on outcomes in acute pancreatitis: a study using a nationwide administrative database. J Gastroenterol. 2014; 49: 148-155. [PMID:24113818]
- Wu BU, Banks PA. Clinical management of patients with acute pancreatitis. Gastroenterology. 2013; 144: 1272-1281. [PMID:23622137]
- Baillargeon JD, Orav J, Ramagopal V, et al. Hemoconcentration as an early risk factor for necrotizing pancreatitis. Am J Gastroenterol. 1998; 93: 2130-2134. [PMID:9820385]
- Wall I, Badalov N, Baradarian R, et al. Decreased mortality in acute pancreatitis related to early aggressive hydration. Pancreas. 2011; 40(4): 547-550. [PMID:21499208]
- Moon M. Health Care Spending in Maryland: How Does it Differ from Other States and Why? Silver Spring: Maryland Health Care Commission, 2010.
- Massachusetts Health Care Reform: Six Years Later. Updated 2012. The Henry J. Kaiser Family Foundation. Available at: https:// kaiserfamilyfoundation.files.wordpress.com/2013/01/8311.pdf. Accessed April 2014.
- Saligram S, Saul M, Yadav D. Analyses of Hospital Administrative Data That Use Diagnosis Codes Overestimate the Cases of Acute Pancreatitis. Clin Gastroenterol Hepatol. 2012; 10: 805-811. [PMID:22504004]
- O'Malley KJ, Cook KF, Price MD, et al. Measuring diagnoses: ICD code accuracy. Health Serv Res. 2005; 40: 1620-1639.