Key words
choice experiment, ethnicity, gender,
renal transplant
Introduction
In March 2008, a total of 6784 patients in the UK
awaited renal transplants, but in 2007–2008 only 1249
patients received cadaveric (deceased donor) transplants,
and 831 patients received live donor transplants.
The growing imbalance between demand for and supply
of transplants led to the 2008 Transplant Workforce
Report (Department of Health, 2008), which outlined
initiatives to facilitate a 50% increase in cadaveric
transplants within five years. Despite this, demand will
exceed supply, especially among members of ethnicminority
groups who are more susceptible to diseases
linked to renal disease necessitating transplants (Raleigh,
1997; Churak, 2005; Davis and Randhawa, 2006; UK
Transplant, 2006). They are also less likely to obtain
closely matched transplants (Higgins et al, 1997; UK
Transplant, 2006). The increased risk among members
of ethnic-minority populations, compared with
white patients, of developing end-stage renal disease
(Churak, 2005) is partly related to the higher prevalence
of type 2 diabetes. A UK study indicates a prevalenceamong
black African and Caribbean patients that
is 3.5 times higher than that among white patients
(Raleigh, 1997). South Asians are also more susceptible
to diabetes and heart failure leading to renal disease
(Bennett and Savani, 2004). Greater demand for renal
transplants in these communities is matched by reduced
rates of organ donation (Bennett and Savani, 2004). Therefore, systems that prioritise on the basis of donor
and recipient tissue matching will disadvantage some
ethnic groups.
Improved anti-rejection drugs have reduced the
importance of tissue matching in determining transplant
success, so other criteria now merit greater consideration
(Koene, 2002).Moreover, by applying discrete
choice experiments (DCEs), it is possible to quantify
trade-offs between different priority criteria. A DCE
study of this kind has already been undertaken in
relation to liver transplantation (Ratcliffe and Buxton,
1999; Ratcliffe, 2000a). In this paper we report differences
in preferences between non-white ethnic-minority
patients and other patients, and between South Asian
patients and other patients. We also consider whether
these preferences vary according to gender.
Materials and methods
DCEs involve respondents making a series of choices
about which one of two hypothetical transplant
recipients who differ in their characteristics should
receive a kidney. Using DCEs, the weight that respondents
give to differences in characteristics can be
quantified. The steps involved in undertaking a DCE
are summarised below.
Pilot exercise
We interviewed 60 respondents (including eight
members of ethnic-minority groups), consisting of
41 patients, 16 healthcare professionals, one donor,
one carer and one renal consultant’s secretary. These
respondents completed aDCEquestionnaire and ranked
potential priority criteria for renal transplantation. All
60 respondents in the pilot exercise came from the
University Hospitals of Coventry and Warwickshire
(UHCW) NHS trust.
Figure 1 :Details of ethnicity categories presented to questionnaire respondents
Attributes and levels: the final DCE
Attributes relate to the different hypothetical characteristics
of transplant recipients, but these were based
on a qualitative exercise informed by discussions between
the lead researcher, other researchers, the grantholder
and UHCW medical staff. However, findings
from the pilot exercise, including the significance or
non-significance of attributes following data analysis,
respondents’ rankings of attributes in ranking exercises,
and their general feedback, informed the selection
of attributes and levels for the final questionnaire.
Final attributes and levels included the following:
Length of time spent waiting for a transplant:
levels included were one month, two years or ten
years. The coefficient on the variable waiting time
indicates utility for each 1-year reduction in
recipient waiting time.
• Quality of tissue match:
levels included:
– a non-favourable matchwith an average of 86%
12-month kidney survival post-transplant
– a favourable match with an average of 89% 12-
month kidney survival post-transplant
– a perfect match with an average of 90% 12-
month kidney survival post-transplant.
The coefficient on the variable tissue indicates utility
for each 1% improvement in kidney survival.
• The number of child or adult dependants of the
recipient:
levels included zero, one or four dependants.
The coefficient on the variable dependant
indicated utility from prioritising to people with
dependants, for each additional dependant.
• Recipient age:
levels included 20, 45 or 65 years.
The coefficient on the attribute age indicated utility
for each one-year reduction in recipient age.
• Recipient diseases that affect life expectancy:
– thevariabledisease1 indicated utility from transplanting
to a recipient having no diseases, other
than kidney disease, affecting recipient life expectancy
rather than a moderate disease such as
uncontrolled hypertension or obesity plus kidney
disease
– the variable disease2 indicated utility from
transplanting to a recipient having a moderate disease affecting life expectancy, such as uncontrolled
hypertension or obesity, rather than
a severe disease affecting life expectancy, such as
heart attack, diabetes with complications, or
stroke.
The difference between a person with no disease
affecting their life expectancy and one with severe
disease is the sum of significant coefficients on
disease1 and disease2.
• Recipient diseases that affect quality of life:
– the variable ill1 indicated utility from transplanting
to a recipient having no diseases other
than kidney disease affecting quality of life, rather
than a moderate disease such as mild asthma
with kidney disease
– the variable ill2 indicated utility from transplanting
to a recipient having a moderate disease
affecting quality of life, such as mild asthma
with kidney disease, rather than a severe disease
affecting quality of life, such as kidney disease
plus severe arthritis.
The difference between a person with no disease
affecting their quality of life and one with severe
disease is the sum of significant coefficients on ill1
and ill2.
Final questionnaire
The DCE design was sourced from leaders in the field
(Street et al, 2005). It is a ‘main effects’ design, and
preferences are inferred from 18 choices for specific
attributes. The design did not involve the use of a
constant comparator. Half of the choices went into
questionnaire version A, the remainder went into
version B, and we distributed equal numbers of each. It
was orthogonal, and checks (Spearman’s and Pearson’s
correlation coefficients) confirmed this. The questionnaire
was available in English, Pubjabi, Hindi, Bengali,
Gujarati and Urdu. The questionnaires elicited information
on gender and posed a question about ethnicity
(see Figure 1).
Questionnaire distribution
A total of 20 000 flyers with Freepost reply envelopes
were enclosed in the UK National Kidney Federation’s
publication Kidney Life, inviting people to request
questionnaires, including alternative-language versions
if required. As we did not receive a large enough sample
of ethnic-minority patients from the postal questionnaire,
a bilingual researcher (Dr AnilGumber) obtained
18 additional responses from members of ethnicminority
groups at EalingNHS Trust and five additional
responses from members of ethnic-minority groups at
University Hospitals of Coventry and Warwickshire
NHS Trust.
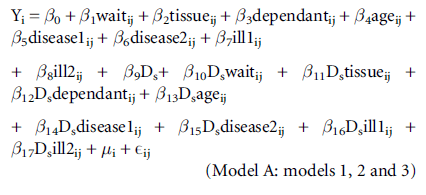
Data analysis
We used model A to compare patient preferences for
non-white ethnic-minority patients versus others
(model 1), South Asian patients versus others (model
2), and female patients versus others (model 3). Yij is a
binary dependent variable, from individuals i = 1...m,
for observations j = 1...ni. Observations ni vary because
the i individuals do not all complete every pairwise
choice (some respondents do not answer all choices),
�i is the random effects error term (which allows for
multiple responses from i respondents), and Eij is the
probit error term for individuals i for j observations.
Variables are defined in the Materials and Methods
section. Ds is a dummy variable and is equal to 1 if the
respondent is in the subgroup, otherwise it is equal to 0.
Establishing the marginal rate of
substitution (MRS)
MRS relates changes in attributes to a 1-year change in
waiting time as a ratio. We used the Delta method
(Wooldridge, 2002) to establish whether MRS was
significant. This was because the binary dependent
variable model that we used (random effects probit)
was non-linear, and the Delta method can be used to
establish confidence intervals for estimated parameters
for these types of models (Greene, 2000). Moreover,
the approach allows researchers to establish the significance
or otherwise of a ratio of coefficients. Since
MRS is a ratio, it allows clarification of whether MRS
for a given variable is significant both for the defined
subgroups of patients, and also for patients who are
not in the defined ethnic specific or female subgroups
(see Table 1). These tests for statistical significance
were performed using the command ‘nlcom’ in STATA.
We also performed Wald tests to establish whether
MRSin a subgroup differed in a statistically significant
manner from MRS among other patients, in other
wordswhether the non-white ethnic minorities, South
Asian ethnic minorities or female subgroups had a
different MRS to other patients who were not in that subgroup. So, for example, in relation to the variable
tissue, the test we conducted was whether β2/β1 = (β2
+ β11)/(β1 + β10). These tests were performed using
the command ‘testnl’ in STATA. Wald tests establish
whether there is a significant difference in MRS comparing
MRS for base groups, versus defined subgroups
for each attribute. Differences in MRS at the 5% level
are indicated by P-values of≤ 0.05.
Table 1: Calculation of MRS
Results
Sample characteristics
The UK National Kidney Federation, which publishes
Kidney Life, could not provide us with data that might
allow us to assess the representativeness of our sample,
so instead we used data from the UK Renal Registry
(Farrington et al, 2008a,b).
In total, 895 out of 908 respondents indicated their
ethnic origin. Of these, 799 out of 895 patients (89.3%)
were white (British), and 27 out of 908 (3%) were members
of white ethnic minorities, so overall 92.3% of our
sample was white. This compares with incidence data
(Farrington et al, 2008a) which suggest that, across the
UK, 79.8%of renal patients are white, so in our sample
white patients were over-represented.Moreover, 69 out
of 895 patients (7.7%) were members of non-white
ethnicminorities, comparedwith a 17.9% incidence rate
(Farrington et al, 2008a). Of the 69 members of nonwhite
ethnic minorities, 50 patients were of South
Asian origin. Therefore, 50 of the 895 patients in our
sample (5.6%) were of South Asian origin, compared
with a 10% incidence rate (Farrington et al, 2008a).
Members of non-white ethnic minorities consisted
of two out of 69 mixed (white/black Caribbean), one out of 69 mixed (white/black African), one out of 69
mixed (white South Asian), two out of 69 with any
other mixed background, including a Luso-Indian,
one out of 69 Anglo-Indian/English-Portugese. In total,
seven out of 69 were black or black British Caribbean,
three out of 69 were black or black British (African),
one out of 69 was black or black British (any other
background), and two patients were Chinese.
The 50 South Asian patients in the non-white
sample included 29 out of 69 South Asian or South
Asian British (Indian) patients, nine out of 69 South
Asian or South Asian British (Pakistani) patients,
two out of 69 South Asian or South Asian British
Bangladeshi patients, seven out of 69 South Asian or
South Asian British (any other background) patients,
plus one Filipina, one Persian and one Iranian patient.
In total, 508 out of 908 patients (55.9%) were male,
397 out of 908 patients (43.7%) were female, and three
out of 908 patients (0.3%) did not indicate their gender.
This is reassuring, as Renal Registry data that have been
presented graphically (Farrington et al, 2008a) show a
trend towards slightly higher proportions of men than
women among renal patients for all age groups.
The average patient age was 54.88 years (median 57
years). For members of white ethnic minorites the
average age was 55.65 years (median 57 years), for
those belonging to non-white ethnic minorities it was
54.12 years (median 56 years), and for patients of
South Asian origin it was 55.38 years (median 56.5
years). Among male patients (508/908) the average age
was 56.49 years (median 58 years), and among female
patients (397/908) it was 52.85 years (median 54 years).
Unfortunately the Renal Registry data (Farrington et al,
2008b) are not specific for ethnic origin or gender.
However, the median age for all patients is 56.9 years,
which is remarkably close to our figure of 57 years.
The sample consisted of 468 out of 908 patients
(51.5%) with successful transplants, 118 out of 908
patients (13%) whose transplant failed, and 279 out of
908 patients (30.7%) who were awaiting transplants,
with an average waiting period of 22.6 months. Some
patients whose transplant failed are also included in
the data for those awaiting transplants. This also
applies to all gender and ethnic-minority groups. A
total of 237 out of 908 patients (26.3%) were on dialysis
without transplantation, and 57 out of 908 patients
(6.3%) had kidney disease that did not require dialysis.
Renal Registry prevalence data (Farrington et al, 2008b)
suggest that 46.6% of patients have successful transplants
(as this is their current treatment modality),
which is reassuringly close to our figure. However,
there are no data for patients with failed transplants, or
for those awaiting transplants, on dialysis without
transplantation, or with kidney disease not requiring
transplantation. Among non-white ethnic minorities
there were 18 out of 69 patients (26%) with successful
transplants, 10 out of 69 patients (14.5%) whose transplant
failed, 35 out of 69 patients (50.7%) awaiting a transplant on dialysis (average waiting period 21.45
months), and three out of 69 patients (4.3%) with
kidney disease not requiring dialysis. Among those of
South Asian origin, 10 out of 50 patients (20%) had
successful transplants, eight out of 50 patients (16%)
had failed transplants, 28 out of 50 patients (56%)
were awaiting transplants (average waiting period 23.1
months), and three out of 50 patients (6%) were on
dialysis without transplantation. Unfortunately, the
available data (Farrington et al, 2008b) were not analysed
by ethnic origin. However, given the shortage of transplants
available to ethnic-minority groups, and their
lower success rates, because they are likely to be poorer
tissue matches, the lower percentage figure for transplant
successes and the higher percentage figure for
transplant failures might be expected.
Data analysis
The results for models 1 to 3 are presented in Tables 2,
3 and 4.
Table 2:Model 1: patients ÃÆÃâÃââÃÆââ¬Å¡Ã¢ââ¬Å¡Ã¬ÃÆââ¬Å¡Ã¢ââ¬Ã
â dummy variables for non-white ethnic-minority patients.
Table 3:Model 2: patients ÃÆÃâÃââÃÆââ¬Å¡Ã¢ââ¬Å¡Ã¬ÃÆââ¬Å¡Ã¢ââ¬Ã
â dummy variables for South Asian patients.
Non-white ethnic-minority patients vs.
other patients
The likelihood ratio test for model 1 (see Table 2) is
significant, which suggests that preferences do vary
between members of non-white ethnic minorities and
other patients. The Wald tests for three variables are
also significant, which suggests that MRS differs significantly
between the two patient groups for these
three variables. For non-white ethnic minorities, MRS
on the variable tissue is non-significant. This relates to
prioritising recipients with a good tissue match, so
members of non-white ethnic minorities would not
prioritise to recipients with better tissue matches. For
other patients it is positive and significant, implying a
preference for prioritising recipients with better tissue
matches. Another difference relates to age. Among
members of non-white ethnic minorities the variable
age is non-significant, so they would not prioritise
younger recipients, whereas among other patients this
variable is positive and significant, suggesting a preference
for prioritising younger recipients. Finally, there
is evidence that preferences vary in relation to prioritising those with diseases that affect life expectancy.
The variable disease2 relates to prioritising those with
moderate rather than severe diseases that affect life
expectancy. Members of non-white ethnic minorities
place less emphasis than do other patients on prioritising
those with moderate rather than severe diseases
that affect life expectancy (MRS = 8.25 vs. 15.93).
Table 4:Model 3: patients with female patient dummy variables.
South Asian patients vs. other patients
A similar pattern emerges in the South Asian patient
sample (see Table 3), which is not unexpected, as they
represented a large proportion (50 out of 69) of the
non-white ethnic-minority group. Once again likelihood
ratio tests suggest that preferences do vary
between the two patient groups, and the Wald tests
suggest that these differences relate to the same three
variables. There is no evidence that South Asian patients
would prioritise those with a better tissue match, as
the variable tissue is non-significant. However, among
other patients, the variable is positive and significant,
which suggests a preference for prioritising recipients
with better tissue matches. South Asian patients would not prioritise the young rather than the old, as the
variable age is non-significant, whereas among other
patients it is positive and significant. Finally, although
both South Asian patients and the rest of the patient
sample would prioritise those with moderate rather
than severe diseases that affect life expectancy, South
Asian patients would be less likely to prioritise on the
basis of this criterion (MRS = 7.57 vs. 15.78).
Preferences and gender
The results of the likelihood ratio test do not provide
evidence of a difference in preferences between male
and female patients (see Table 4). However, Wald tests
suggest that preferences may vary in relation to four
out of eight variables. These tests suggest that preferences
may vary in relation to prioritising on the basis
of tissue match (tissue). Both male and female patients
valued this criterion significantly. However, it appears
that females value it marginally more than do males
(MRS = 1.45 vs. 1.34). The Wald test also suggests that
preferences differwith regard to prioritising recipients
with child or adult dependants. The variable dependant
is significant for both groups, but female patients
appear to value this marginally more (MRS = 1.61 vs.
1.28). The Wald test suggests that preferences for
prioritising younger rather than older dependantsmight also differ. Female patients place marginally more emphasis
on this variable (age) than domales (MRS = 0.17
vs. 0.14). Finally, both female and male patients value
prioritising those with severe rather than moderate
diseases that affect life expectancy (disease2) significantly.
However, this variable seems to be valued marginally
less by female patients (MRS = 14.86 vs. 15.43).
These findings suggest that patients who are not
members of ethnic minorities value prioritising patients
with closer tissuematches, whereas South Asian patients
and those from non-white ethnic minorities do not.
Patients in general, including those who belong to
ethnicminorities, prioritise those who have had to wait a
long time for a transplant, and those with child or adult
dependants. However, prioritising younger people is
not valued among South Asians and non-white ethnic
minorities, whereas it is among other patients. Those
with moderate rather than severe diseases that affect
life expectancy are a priority for patients in general,
but less of a priority among South Asian patients and
non-white ethnic minorities. All ethnic groups value
prioritising those with moderate as opposed to no
diseases that affect quality of life. This may seem a
somewhat odd result, but it could be explained by
enlightened self-interest, in that many respondents
themselves would have moderate diseases, in addition to kidney disease, which affect their quality of life.Moreover,
there is no evidence that the ethnic-minority
groups value prioritising those with moderate rather
than severe diseases that affect quality of life differently.
Both groups would prioritise potential recipients with
moderate rather than severe diseases that affect quality
of life.
Although there is evidence that preferences vary
according to gender, these differences are not particularly
pronounced. However, women do have a slightly
greater tendency to prioritise recipients who are better
tissue matches to donors. Women are also slightly more
likely to prioritise those with child or adult dependants,
and younger people, and slightly less likely to
prioritise those with moderate rather than severe
diseases that affect life expectancy.
Discussion
Discrete choice experiments (DCEs), sometimes referred
to as conjoint analysis (Ryan and Farrar, 2000),
are increasingly used in health technology assessment
(Ryan, 1999) and health economics (Ryan and Gerard,
2003). Indeed, searches on PubMed have identified
several hundred health-relatedDCEs. However, although
some DCEs have addressed the concerns of ethnic
minorities (Bennett and Savani, 2004; Dwight-Johnson
et al, 2004; Byrne et al, 2006; Hall et al, 2006; Peacock
et al, 2006; Hawley et al, 2008; Sung-Jae et al, 2008;
Constantinesgu et al, 2009), the majority have assessed
preferences for respondents overall, rather than for
minority groups. Only a very few DCEs have looked at
gender-related issues (Brown et al, 2003; Mays and
Zimet, 2004; Tsang et al, 2004; Kjaer et al, 2006;
Hjelmgren and Anell, 2007; Gerard et al, 2008).
DCEs have strong theoretical foundations in economics.
They are compatible with Lancaster’s characteristics
theory of demand (Lancaster, 1966) and random
utility theory (McFadden, 1999). They are often used
to establish how much people are willing to pay for
different attributes of healthcare provision. However,
there are methodological issues which need to be
addressed before it can be assumed thatDCE estimates
of willingness to pay (WTP) are accurate (Ryan et al,
1998; Ratcliffe, 2000b; Ryan and Farrar, 2000; Ryan
et al, 2003). One major concern is that if they are
applied in a context in which healthcare is free at the
point of use, respondents may indicate an unrealistically
high WTP, because they know that they will
not in fact bear a cost, leading to hypothetical bias.
Alternatively, they may conceal WTP because they feel
the question may be a precursor to the introduction of
charging, leading to strategic bias.
We did not elicit WTP, thereby avoiding many of
these problems. However, it must be conceded that our results are sensitive to the choice of attributes
selected, and can only give an indication of trade-offs
in relation to the actual attributes included. Since there
are no definitive criteria for establishing the appropriate
attributes and levels to include in a DCE, researchers
simply have to consult a wide range of opinion, including
patients and professionals, before deciding upon
the attributes and levels, and ensure that the choice of
attributes is defensible.
Although DCEs have been applied to determine
priorities for liver transplants (Ratcliffe and Buxton,
1999; Ratcliffe, 2000a), that UK study did not collect
ethnicity data, only gender data. The study reported
differences in responses by gender, but the data were
not analysed to establish whether preferences varied
with gender. The only other DCE work in the area of
transplantation is another UK study of factors that
influence people’swillingness to donate body parts for
transplantation in the event of their death (Bennett
and Savani, 2004). This considered three groups (white,
South Asian and Afro-Caribbean), but concluded that
‘being of a particular ethnicity or gender did not affect
outcomes in anymeaningfulways’, so they only reported
results for respondents overall (Bennett and Savani,
2004, p. 76).
In the field of transplantation there are of course
other studies which do not use DCE methodology.
Other kidney allocation studies were conducted in
Australia and America (Louis et al, 1997; Browning
and Thomas, 2001), and may not be generalisable to
the UK. The Australian study (Browning and Thomas,
2001) involved 238 respondents ranking possible priority
criteria for transplantation, including age, gender,
occupation, education, work status, income, whether
potential recipients were parents, post-transplantation
prognosis, and length of time for which recipients had
been on the transplant list. They therefore avoided
addressing the issue of whether to prioritise on the
basis of ethnicity. They found that over 90% of 238
respondents considered that recipient gender, socioeconomic
status, employment status and occupation
should not influence decisions about kidney transplant
allocation. Instead, most of the respondents
(87.4%) considered that those who had been on the
transplant list for a long period of time should have
priority, and 79% would prioritise those with a good
prognosis, whilst 65% would prioritise younger recipients.
The American study (Louis et al, 1997) noted that
the American point-based allocation system disadvantaged
African Americans because of its emphasis on
antigen matching, as African Americans typically have
a disproportionatenumber of rare antigens. They used
semi-structured interviews with 33 patients who were
awaiting transplants, including some black Americans
who considered that discrimination in organ allocation
by antigen matching was unfair. However, there was a paradox in that they did not want to receive organs
that gave them a reduced likelihood of survival. So
these results differ from ours, but of course the rate of
graft survival has increased since the American study
because of improvements in anti-rejection drugs,
so this may explain the differences in findings. The
authors did not address the issue of gender-related
differences.
There is one other study (Geddes et al, 2005), which
was conducted in Scotland. A total of 295 respondents
were asked to choose one of two hypothetical patients
from eight scenarios to establish whether the patients
agreed with the current criteria for transplant allocation
in the UK. Ethnicity was not taken into consideration
in this research, although gender was addressed.
The findings suggested that neither age nor gender of
the recipient should be used when making decisions
about the allocation of kidneys. The latter finding is
somewhat at odds with our findings for the nonethnic-
minority patients, who, unlike the ethnic minorities,
would tend to prioritise younger recipients.
This research was conducted prior to the UK Transplant
2006 reforms to transplant allocation criteria.
It seemed to broadly support a shift away from the
previous emphasis on tissue matching. It showed that
only 24.6% of 295 respondents agreed with UK transplant
policy at a time when the survival advantage of
transplanting to a recipient whose transplant would be
a closer match to the donor justified transplanting to a
patient who had waited for only two years rather than
seven years. The main conclusion was that allocation
should favour respondents who had waited for longer,
and of course UK transplant policy did evolve to place
more emphasis on those who have waited a long time
for a transplant.
Conclusions
Our findings are broadly supportive of revisions toUK
transplant kidney allocation policy in 2006, which
reduced the emphasis on transplanting to patients
with good tissuematches.However, although the policy
shift places less emphasis on tissue matching as an
allocation criterion, current policy still retains quality
of tissue matching as an allocation criterion. Although
this might be supported by the majority of patients,
evidence from this research suggests that it would not
be supported by South Asians and members of nonwhite
ethnic minorities more generally. Non-white
ethnic minorities and South Asians would prefer the
quality of tissue type matching between donor and
recipient to be abandoned as a criterion for allocation.
They are disadvantaged if transplant allocation is based
on tissue matching, which no doubt accounts for this
finding.UK Transplant’s policy shift towards prioritising those who have waited a long time for a transplant is
supported by these findings for all ethnic-minority
groups, irrespective of gender. However, the other
shift in emphasis, towards prioritising younger patients,
does not appear to be supported by ethnic-minoritiy
groups, although it is supported by other patients.
Although we have found some evidence that preferences
do vary with gender, these differences are not
particularly pronounced, which suggests that an attempt
to facilitate the preferences of people according
to gender is a low priority, and that addressing the
specific needs and disadvantages of ethnic-minority
groups should be a more urgent consideration when
transplant policy is reassessed.
ACKNOWLEDGEMENTS
Ethical approval was obtained for this study from
Warwickshire Local Research Ethics Committee (reference
number 05/Q2803/86). This project was funded
by the Coventry Kidney Fund.
References
- Bennett R and Savani S (2004) Factors influencing the willingness to donate body parts for transplantation. Journal of Health and Social Policy 18:61ÃÆÃâÃââÃÆââ¬Å¡Ã¢ââ¬Å¡Ã¬ÃÆââ¬Å¡Ã¢ââ¬Ã
â85.
- Brown AJ, Swinyard W and Ogle J (2003) Women in academic evidence: a report of focus groups and questionnaires, with conjoint analysis. Journal of WomenÃÆÃâÃââÃÆââ¬Å¡Ã¢ââ¬Å¡Ã¬ÃÆââ¬Å¡Ã¢ââ¬Å¾Ã¢s Health 12:999ÃÆÃâÃââÃÆââ¬Å¡Ã¢ââ¬Å¡Ã¬ÃÆââ¬Å¡Ã¢ââ¬Ã
â1008.
- Browning CJ and Thomas SA (2001) Community values and preferences in transplantation organ allocation decisions. Social Science and Medicine 52:853ÃÆÃâÃââÃÆââ¬Å¡Ã¢ââ¬Å¡Ã¬ÃÆââ¬Å¡Ã¢ââ¬Ã
â61.
- Byrne MM, Souchek J, Richardson M et al (2006) Racial/ethnic differences in preferences for total knee replacement surgery. Journal of Clinical Epidemiology 59:1078ÃÆÃâÃââÃÆââ¬Å¡Ã¢ââ¬Å¡Ã¬ÃÆââ¬Å¡Ã¢ââ¬Ã
â86.
- Churak JM (2005) Racial and ethnic disparities in renal transplantation. Journal of the National Medical Association 97:153ÃÆÃâÃââÃÆââ¬Å¡Ã¢ââ¬Å¡Ã¬ÃÆââ¬Å¡Ã¢ââ¬Ã
â160.
- Constantinesgu F, Goucher S, Weinstein A et al (2009) Understanding why rheumatoid arthritis patient treatment preferences differ by race. Arthritis and Rheumatism 61:413ÃÆÃâÃââÃÆââ¬Å¡Ã¢ââ¬Å¡Ã¬ÃÆââ¬Å¡Ã¢ââ¬Ã
â18.
- Davis C and Randhawa G (2006) The influence of religion on organ donation and transplantation among the Black
- Caribbean and Black African population: a pilot study in the United Kingdom. Ethnicity and Disease 16:281ÃÆÃâÃââÃÆââ¬Å¡Ã¢ââ¬Å¡Ã¬ÃÆââ¬Å¡Ã¢ââ¬Ã
â5.
- Department of Health (2008) Organs for Transplants: a report from the Organ Donation Taskforce. London: Department of Health.
- Dwight-Johnson M, Lagomasino IT, Aisenberg E et al (2004) Using conjoint analysis to assess depression treatment preferences among low-income Latinos. Psychiatric Services 55:934ÃÆÃâÃââÃÆââ¬Å¡Ã¢ââ¬Å¡Ã¬ÃÆââ¬Å¡Ã¢ââ¬Ã
â6.
- Farrington K, Udayaraj U, Glig J et al (2008a) ESRD incident rates in 2007 in the UK: national and centre-specific analyses. In: UK Renal Registry 2008 Report; www.renalreg.org (accessed April 2009).
- Farrington K, Hodsman A, Casula A et al (2008b) ESRD prevalent rates in 2007 in the UK: national and centrespecific analyses. In: UK Renal Registry 2008 Report; www.renalreg.org (accessed April 2009).
- Geddes CC, Rodger RS, Smith C et al (2005) Allocation of deceased donor kidneys for transplantation: opinions of patients with CKD. American Journal of Kidney Diseases 46:974ÃÆÃâÃââÃÆââ¬Å¡Ã¢ââ¬Å¡Ã¬ÃÆââ¬Å¡Ã¢ââ¬Ã
â5.
- Gerard K, Salisbury C, Street D et al (2008) Is fast access to general practice all that should matter? A discrete choice experiment of patientsÃÆÃâÃââÃÆââ¬Å¡Ã¢ââ¬Å¡Ã¬ÃÆââ¬Å¡Ã¢ââ¬Å¾Ã¢ preferences. Journal of Health Services Research and Policy 13(Suppl. 2):3ÃÆÃâÃââÃÆââ¬Å¡Ã¢ââ¬Å¡Ã¬ÃÆââ¬Å¡Ã¢ââ¬Ã
â10.
- Greene WH (2000) Functional form, nonlinearity and specification. In: Econometric Analysis. 4th edn. Upper Saddle River NJ: Prentice Hall International Incorporated.
- Hall J, Fiebig DG, King MT et al (2006) What influences participation in genetic carrier testing? Results from a discrete choice experiment. Journal of Health Economics 25:520ÃÆÃâÃââÃÆââ¬Å¡Ã¢ââ¬Å¡Ã¬ÃÆââ¬Å¡Ã¢ââ¬Ã
â37.
- Hawley ST, Volk RJ, Krishnamurthy P et al (2008) Preferences for colorectal cancer screening among racially/ ethnically diverse primary care patients. Medical Care 46(Suppl. 1):S5ÃÆÃâÃââÃÆââ¬Å¡Ã¢ââ¬Å¡Ã¬ÃÆââ¬Å¡Ã¢ââ¬Ã
â9.
- Higgins RM, West N, Edmumds ME et al (1997) Effect of a strict HLA matching policy on the distribution of cadaveric kidney transplants to Indo-South Asian and white European recipients: regional study. BMJ 315:1354ÃÆÃâÃââÃÆââ¬Å¡Ã¢ââ¬Å¡Ã¬ÃÆââ¬Å¡Ã¢ââ¬Ã
â5.
- Hjelmgren J and Anell A (2007) Population preferences and choice of primary care models: a discrete choice experiment in Sweden. Health Policy 83:314ÃÆÃâÃââÃÆââ¬Å¡Ã¢ââ¬Å¡Ã¬ÃÆââ¬Å¡Ã¢ââ¬Ã
â22.
- Kjaer T, Gyrd-Hansen Dand Willaing I (2006) Investigating patientsÃÆÃâÃââÃÆââ¬Å¡Ã¢ââ¬Å¡Ã¬ÃÆââ¬Å¡Ã¢ââ¬Å¾Ã¢ preferences for cardiac rehabilitation in Denmark. International Journal of Technology Assessment in Health Care 22:211ÃÆÃâÃââÃÆââ¬Å¡Ã¢ââ¬Å¡Ã¬ÃÆââ¬Å¡Ã¢ââ¬Ã
â18.
- Koene RA (2002) Should the allocation of cadaveric kidneys for transplantation be based on HLA matching? Nephrology Dialysis Transplantation 17:717ÃÆÃâÃââÃÆââ¬Å¡Ã¢ââ¬Å¡Ã¬ÃÆââ¬Å¡Ã¢ââ¬Ã
â18.
- Lancaster KJ (1966) A new approach to consumer theory. Journal of Political Economy 74:132ÃÆÃâÃââÃÆââ¬Å¡Ã¢ââ¬Å¡Ã¬ÃÆââ¬Å¡Ã¢ââ¬Ã
â57.
- Louis ON, Sanker P and Ubel PA (1997) Kidney transplantion candidatesÃÆÃâÃââÃÆââ¬Å¡Ã¢ââ¬Å¡Ã¬ÃÆââ¬Å¡Ã¢ââ¬Å¾Ã¢ views of the transplant allocation system. Journal of General Internal Medicine 12:478ÃÆÃâÃââÃÆââ¬Å¡Ã¢ââ¬Å¡Ã¬ÃÆââ¬Å¡Ã¢ââ¬Ã
â84.
- McFadden D (1999) Computing willingness-to-pay in random utility models. In: Melvin JR, Moore JC and Riezman R (eds) Trade, Theory and Econometrics: essays in honor of John S Chipman. Abingdon: Routledge. pp. 253ÃÆÃâÃââÃÆââ¬Å¡Ã¢ââ¬Å¡Ã¬ÃÆââ¬Å¡Ã¢ââ¬Ã
â74.
- Mays RM and Zimet GD (2004) Recommending STI vaccination to parents of adolescents: the attributes of nurse practitioners. Sexually Transmitted Diseases 31:428ÃÆÃâÃââÃÆââ¬Å¡Ã¢ââ¬Å¡Ã¬ÃÆââ¬Å¡Ã¢ââ¬Ã
â32.
- Peacock S, Apicella C, Andrews L et al (2006) A discrete choice experiment of preferences for genetic counseling among Jewish women seeking cancer genetics services. British Journal of Cancer 95:1448ÃÆÃâÃââÃÆââ¬Å¡Ã¢ââ¬Å¡Ã¬ÃÆââ¬Å¡Ã¢ââ¬Ã
â53.
- Raleigh VS (1997) Diabetes and hypertension in BritainÃÆÃâÃââÃÆââ¬Å¡Ã¢ââ¬Å¡Ã¬ÃÆââ¬Å¡Ã¢ââ¬Å¾Ã¢s ethnic minorities: implications for the future of renal services. BMJ 314:209ÃÆÃâÃââÃÆââ¬Å¡Ã¢ââ¬Å¡Ã¬ÃÆââ¬Å¡Ã¢ââ¬Ã
â12.
- Ratcliffe J (2000a) Public preferences for the allocation of donor liver grafts for transplantation. Health Economics
- 9:137ÃÆÃâÃââÃÆââ¬Å¡Ã¢ââ¬Å¡Ã¬ÃÆââ¬Å¡Ã¢ââ¬Ã
â48.
- Ratcliffe J (2000b) The use of conjoint analysis to elicit willingness-to-pay values. Proceed with caution? International Journal of Technology Assessment in Health Care 16: 270ÃÆÃâÃââÃÆââ¬Å¡Ã¢ââ¬Å¡Ã¬ÃÆââ¬Å¡Ã¢ââ¬Ã
â5.
- Ratcliffe J and Buxton M (1999) PatientsÃÆÃâÃââÃÆââ¬Å¡Ã¢ââ¬Å¡Ã¬ÃÆââ¬Å¡Ã¢ââ¬Å¾Ã¢ preferences regarding the process and outcomes of life-saving technology. International Journal of Technology Assessment in Health Care 15:340ÃÆÃâÃââÃÆââ¬Å¡Ã¢ââ¬Å¡Ã¬ÃÆââ¬Å¡Ã¢ââ¬Ã
â51.
- Ryan M (1999) A role for conjoint analysis in technology assessment in health care? International Journal of Technology Assessment in Health Care 15:443ÃÆÃâÃââÃÆââ¬Å¡Ã¢ââ¬Å¡Ã¬ÃÆââ¬Å¡Ã¢ââ¬Ã
â57.
- RyanMand Farrar S (2000) Using conjoint analysis to elicit preferences for health care. BMJ 320:1530ÃÆÃâÃââÃÆââ¬Å¡Ã¢ââ¬Å¡Ã¬ÃÆââ¬Å¡Ã¢ââ¬Ã
â33.
- Ryan M and Gerard K (2003) Using discrete choice experiments to value health care programmes: current practice and future research reflections. Applied Health Economics and Health Policy 2:55ÃÆÃâÃââÃÆââ¬Å¡Ã¢ââ¬Å¡Ã¬ÃÆââ¬Å¡Ã¢ââ¬Ã
â64.
- Ryan M, McIntosh E and Shackley P (1998) Methodological issues in the application of conjoint analysis in healthcare. Health Economics 7:373ÃÆÃâÃââÃÆââ¬Å¡Ã¢ââ¬Å¡Ã¬ÃÆââ¬Å¡Ã¢ââ¬Ã
â8.
- Ryan M, Watson V and Amaya-Amaya M (2003) Methodological issues in the monetary valuation of benefits in healthcare. Expert Review of Pharmacoeconomics 3: 717ÃÆÃâÃââÃÆââ¬Å¡Ã¢ââ¬Å¡Ã¬ÃÆââ¬Å¡Ã¢ââ¬Ã
â27.
- Street DJ, Burgess L and Louviere J (2005) Quick and easy choice sets: constructing optimal and nearly optimal stated choice experiments. International Journal of Research Marketing 22:459ÃÆÃâÃââÃÆââ¬Å¡Ã¢ââ¬Å¡Ã¬ÃÆââ¬Å¡Ã¢ââ¬Ã
â70.
- Sung-Jae L, Brooks RA, Newman PA et al (2008) HIV vaccine acceptability among immigrant Thai residents in Los Angeles: a mixed-method approach. AIDS Care 20:1161ÃÆÃâÃââÃÆââ¬Å¡Ã¢ââ¬Å¡Ã¬ÃÆââ¬Å¡Ã¢ââ¬Ã
â8.
- Tsang HW, Chan F and Chan CC (2004) Factors influencing occupational therapy studentsÃÆÃâÃââÃÆââ¬Å¡Ã¢ââ¬Å¡Ã¬ÃÆââ¬Å¡Ã¢ââ¬Å¾Ã¢ attitudes towards persons with disabilities: a conjoint analysis. American Journal of Occupational Therapy 58:426ÃÆÃâÃââÃÆââ¬Å¡Ã¢ââ¬Å¡Ã¬ÃÆââ¬Å¡Ã¢ââ¬Ã
â34.
- UK Transplant (2006) Transplant Activity in the UK. Bristol: Statistics and Audit Directorate.Wooldridge JM (2002) Econometric Analysis of Cross Section and Panel Data. Cambridge, MA: MIT Press.