Jih-Yuan Chen1*, Ming-Hong Yen2, Ying-Huey Lin3, Shu-Hui Hu4, Hong-Sen Chen5, Meng-Chi Liu3, Mei-Chyn Chao6 and Wen-Ling Chen3
1Medical Research, Kaohsiung Medical University Hospital
2School of Pharmacy, Kaohsiung Medical University, Taiwan
3Department of Nursing, Kaohsiung Medical University Hospital, Taiwan
4Department of Medical Laboratory Science and Biotechnology, Kaohsiung Medical University, Taiwan
5Department of Oral Hygiene, college of Dental Medicine, Kaohsiung Medical University, Taiwan
6Department of Pediatric/Genetic, Kaohsiung Medical University Hospital, Taiwan
*Corresponding Author:
Jih-Yuan Chen
Joint Associate Professor
School of Nursing
Kaohsiung Medical University; Joint researcher
Medical Research
Kaohsiung Medical Hospital, Taiwan
Tel: 886-73121101-2610
Fax: 886-73218364
E-mail: jiyuch@kmu.edu.tw
Received Date: January 06, 2016; Accepted Date: February 11, 2017; Published Date: February 20, 2017
Citation: Chen JY, Yen MH, Lin YH, et al. Preliminary Process of Developing Multiple Programs for Promoting Family Health with a Vulnerable Child. Acta Psychopathol. 2017, 3:1. doi:10.4172/2469-6676.100075
Copyright: © 2017 Chen JY, et al. This is an open-access article distributed under the terms of the Creative Commons Attribution License, which permits unrestricted use, distribution, and reproduction in any medium, provided the original author and source are credited.
Introduction
Vulnerable children in this study included the disabled children with Duchenne Muscular Dystrophy (DMD)/Spinal Muscular Atrophy (SMA), attention deficit hyperactivity disorder (ADHD), or chromosome abnormality (Turner syndrome or Klinefelter syndrome, TS/KS). DMD/SMA is a primary genetic chronic disorder of motor and lung function and scoliosis by early muscle weakness that can lead to difficulties with walking, respiratory complications, and impact independence in daily activities [1]. ADHD is significant problems with attention and inhibitory control that cause attention deficits, hyperactivity, or impulsiveness with academic difficulties as are problems in relationship with family members [2]. TS/KS, a chromosome structure is altered and govern physical and medical characteristics, such as susceptibility to lymphedema, osteoporosis and fractures, structural malformations of the kidney, autoimmune thyroiditis, diabetes mellitus, inflammatory bowel disease [3-5], or higher risks for scoliosis, lordosis, and kyphosis [6].
The vulnerable situations have been found to exhibit relatively enduring health behavior, health values, family support, and health risk perceptions of families that can be developed and performed [7,8]; and situations of disability/worse health problem can compromise the independence and functional capacity of the vulnerable children thus making them dependent on caregivers, and inducing functional impairment in family, social, and academic settings that was similar in these groups of children and caused problems regarding families’ health issues and general dysfunctional family support [9-13]. These untreated health problems may lead to major complications or complex limitations in activity and participation family time [3,14-17]. Policy programs for the vulnerable population were created and changed as generation change how that influenced families perception of their health and family support. However, empirical evidence to guide health professional collaborate with families to provide family health promotion intervention. Especially, disturbances in family function were related to a high risk of family depression [7,9,13].
A few years ago, first author would like to test the model of family health promotion development, the “concepts and its relationship of family health promotion model” consists of four dynamically interacting components those may affect by environment factors: 1) Family health capacity: including family hardiness (similar to family resilience) and family support, 2) Family health behavior as meaning family health promotion lifestyle, 3) Family health status: including family general function (family assessment device-general function, FAD-GF), and general health (Duke Health Profile, Duke), 4) Health needs: including health crisis assessment, health risk, and nutrition needs. Each component is brief stated later in the content that is summarized in Figure 1.
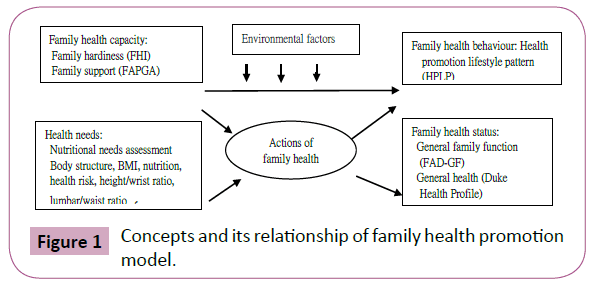
Figure 1: Concepts and its relationship of family health promotion model.
A family health capacity variable was derived from testing the family stress, resources, and adaptation model [18]. Families of children with DMD/SMA could share the burdens of their stressful situations, endure the illness change, and find personal significance or meaning, then, family adaptation and the longterm care of their children could be improved. Researchers evaluate family hardiness and use it to provide support with family support for the families that can evidence to promote family functioning [19] and family health [18]. Family could not get resources to assist families to coping; the family might have already depleted family energy and resources when the chronic condition deteriorated one’s health. The ability to maintain a balance between change and stability has been referred as one nature of healthy family functioning (Figure 2) [20].
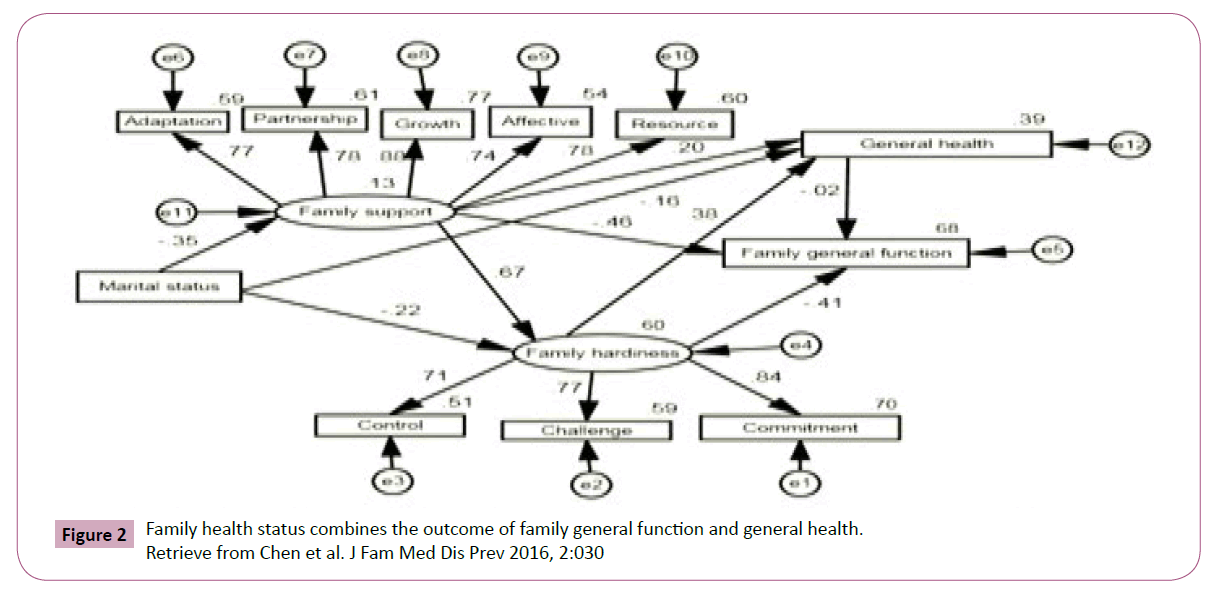
Figure 2: Family health status combines the outcome of family general function and general health. Retrieve from Chen et al. J Fam Med Dis Prev 2016, 2:030
Family Health Behavior
Family health behavior is important role in maintaining health promotion life pattern to foster self-protective action to prevent disease, reducing behaviors that increase health risk, facilitating effective adaptation to and coping with illness, and focusing on the potential and strength for growth within families of children with disability. Health promotion life pattern which dimensions of health behaviors included nutrition, exercise, health responsibility, stress management, social support, and life appreciation [21], that was also presented by family health promotion lifestyles.
Family health status combines the outcome of family general function and general health (Tables 1 and 2).
| Model |
B |
SE |
β |
CL
(lower- bound) |
CL
(upper- bound) |
t (p) |
R |
R2 |
ΔR2 |
F |
| Constant |
1.073 |
0.593 |
- |
-0.095 |
2.240 |
1.808(0.072) |
0.542 |
0.249 |
0.282 |
23.353* |
Mental health
Social health |
0.024 |
0.010 |
0.188 |
0.005 |
0.043 |
2.462(0.004) |
- |
- |
- |
- |
| 0.038 |
0.012 |
0.280 |
0.015 |
0.061 |
3.271(0.001) |
- |
- |
- |
- |
| Constant |
3.650 |
2.254 |
- |
-0.787 |
8.086 |
1.620 (0.106) |
0.553 |
0.305 |
0.280 |
12.094* |
| Social health |
0.039 |
0.013 |
0.286 |
0.014 |
0.065 |
3.038 (0.003) |
- |
- |
- |
- |
| Constant |
1.236 |
2.318 |
- |
-3.328 |
5.800 |
0.533 (0.594) |
0.594 |
0.353 |
0.312 |
8.593* |
Social health
Age
Marital status
Vulnerable status |
0.040 |
0.013 |
0.291 |
0.015 |
0.065 |
3.108 (0.002) |
- |
- |
- |
- |
| -0.694 |
0.308 |
-0.130 |
-1.301 |
-0.087 |
- 2.250 (0.025) |
- |
- |
- |
- |
| 0.937 |
0.388 |
0.149 |
0.174 |
1.700 |
2.418 (0.016) |
- |
- |
- |
- |
| 0.101 |
0.031 |
0.175 |
0.040 |
0.162 |
3.257(0.001) |
- |
- |
- |
- |
Retrieve from Chen, H. S., Liu, M. C. and Chao, M. C. (2015)
Table 1 Results of final model of family health and demographic variables on family support.
| S. No. |
|
B |
SE |
Beta |
t-value |
P |
R- value |
ANOVA F (P) |
| 1 |
(Constant) |
1.644 |
0.093 |
- |
17.671 |
0.000 |
0.378 |
18.52 (0.00) |
| Power to propose an idea/plan |
0.246 |
0.057 |
0.378 |
4.303 |
0.000 |
- |
- |
| 2 |
(Constant) |
1.837 |
0.114 |
- |
16.103 |
0.000 |
0.446 |
13.66 (0.00) |
Power to propose an idea/plan
Monthly income |
0.246 |
0.055 |
0.378 |
4.430 |
0.000 |
- |
- |
| -0.050 |
0.018 |
-0.237 |
-2.773 |
0.007 |
- |
- |
| 3 |
(Constant) |
3.746 |
0.189 |
- |
19.843 |
0.000 |
0.790 |
60.46 (0.00) |
Power to propose an idea/plan
Monthly income
Family hardiness |
0.176 |
0.039 |
0.271 |
4.553 |
0.000 |
- |
- |
| -0.024 |
0.013 |
-0.112 |
-1.880 |
0.063 |
- |
- |
| -0.047 |
0.004 |
-0.673 |
-11.118 |
0.000 |
- |
- |
| 4 |
(Constant) |
3.940 |
0.174 |
- |
22.609 |
0.000 |
0.835 |
62.46 (0.00) |
Power to propose an idea/plan
Monthly income |
0.105 |
0.037 |
0.161 |
2.795 |
0.006 |
- |
- |
| -0.024 |
0.011 |
-0.111 |
-2.058 |
0.042 |
- |
- |
Family hardiness
Family support |
-0.038 |
.004 |
-0.546 |
-9.124 |
0.000 |
- |
- |
| -0.063 |
0.012 |
-0.325 |
-5.123 |
0.000 |
- |
- |
| a. Dependent Variable: FAD: Family general function, lower score of the FAD-GF presented healthy function |
Retrieve from Chen, Yen, Lin, Liu, Chen, Hu, & Liu (2015).
Table 2 Hierarchical regression to determine contributors of family general function by family characteristics, family support, family hardiness, general health and family promotion of healthy lifestyles.
Family functioning is a reliable predictor of parent adjustment that can be found to solve problems, to present affection, and to meet families’ needs to promote and achieve the balance of family health status [10,18]. Health needs assessment included personal health risk factors which a wide variety of behavioral lifestyle interventions have demonstrated effective risk reduction in terms of weight loss or prevention of weight gain, improved diet, increased exercise and activity, smoking cessation, and reduction in hazardous alcohol consumption [22]. Subjects will be interviewed including health needs assessment, family health behaviors, family health capacity, and health status, which measurements include personal health risk factors assessment examine body structure (height/wrist ratio, body mass index, lumbar/waist ration), nutritional assessment including BMI condition, health problem crisis increase, body weight assessment compare with ideal body weight, nutrition condition (body weight/ideal body weight ratio), and health risk (lumbar/ waist ration).
Research indicates that family transition of children with muscular dystrophy impacts the actions of FHPL and threatens family health, even inducing severe family distress, including depression, feelings of helplessness or isolation, infertility, and inadequacy [23,24]. Increasing the family members’ cognition by helping them play a healthy role, understand potential health risks, share in the sick child’s rehabilitation, sharing information about medical care; and assessing factors related to the family health promotion model would help the families of children with muscular dystrophy support family coherence by retaining quality of life via support groups and seeking social welfare, even with limited time and resources. In addition, these factors could help provide sick children wholesome learning and caring environment, facilitate healthy lifestyles, and extend to lifelong learning program (Tables 3 and 4) [25].
| Results of multiple regression models of HPLP subscales scores and demographic variables (I) |
Subscale
Variables |
Low score group |
Non-low score group |
OR |
95% CI |
|
P-value |
Prediction accuracy |
| n |
% |
n |
% |
- |
lower |
upper |
- |
- |
| Nutrition (M=22.75, SD=4.30, low score <20, high sore ≥ 20, range=9-30) |
|
|
|
| Monthly income |
58 |
- |
193 |
- |
- |
- |
- |
- |
- |
| |
> NT $50000 |
17 |
29.31 |
107 |
55.44 |
1 |
- |
- |
- |
- |
| |
NT $30000~50000 |
16 |
27.59 |
48 |
24.87 |
2.1 |
0.98 |
4.5 |
0.06 |
76.90% |
| |
< NT $30000 |
25 |
43.1 |
38 |
19.69 |
4.14 |
2.02 |
8.5 |
<.001 |
- |
| Stress management (M=20.98, SD=4.23, low score <18, high sore ≥18, range=6-30) |
| Monthly income |
45 |
- |
206 |
- |
- |
- |
- |
- |
- |
| |
> NT $50000 |
13 |
28.89 |
111 |
53.88 |
1 |
- |
- |
- |
- |
| |
NT $30000~50000 |
17 |
37.78 |
47 |
22.82 |
2.668 |
1.18 |
6.036 |
0.02 |
82.10% |
| |
< NT $30000 |
15 |
33.33 |
48 |
23.3 |
3.088 |
1.39 |
6.864 |
<0.01 |
- |
| Life appreciation (M=29.14, SD =6.28, low score < 25, high sore >= 25, range=11- 40) |
| Monthly income |
53 |
- |
198 |
|
- |
- |
- |
- |
- |
| |
>NT $50000 |
20 |
37.74 |
104 |
52.53 |
1 |
- |
- |
- |
- |
| |
NT $30000~50000 |
11 |
20.75 |
53 |
26.77 |
1.08 |
0.48 |
2.42 |
0.85 |
78.90% |
| |
|
22 |
41.51 |
41 |
20.71 |
2.79 |
1.38 |
5.65 |
<0.01 |
- |
| Results of multiple regression models of HPLP subscales scores and demographic variables (II) |
| Subscale |
|
Low score group |
High score group |
OR |
95% CI |
|
P-value |
Prediction accuracy |
| Variables |
|
n |
% |
n |
% |
- |
lower |
upper |
- |
- |
| Exercise (M=12.71, SD=4.66, low score < 9, high sore >= 9, range=5-25) |
|
|
|
| |
- |
2 |
- |
199 |
- |
- |
- |
- |
- |
- |
| Marital status |
Married |
40 |
76.92 |
177 |
88.94 |
1 |
- |
- |
- |
- |
| |
Not married |
12 |
23.08 |
22 |
11.06 |
2.64 |
1.18 |
5.9 |
0.02 |
- |
| Residence location |
Rural and town |
24 |
46.15 |
136 |
68.34 |
1 |
- |
- |
- |
78.90% |
| |
Urban |
28 |
53.85 |
63 |
31.66 |
0.38 |
0.2 |
0.71 |
<0.01 |
- |
| Health Responsibility (M=27.35, SD=6.32, low score <23, high sore ≥23, range=9-39) |
| |
- |
60 |
- |
191 |
- |
- |
- |
- |
- |
- |
| Gender |
Female |
33 |
55 |
139 |
72.77 |
1 |
- |
- |
- |
- |
| |
Male |
27 |
45 |
52 |
27.23 |
2.13 |
1.16 |
3.91 |
0.02 |
76.10% |
| Residence location |
Rural and town |
29 |
48.33 |
131 |
68.59 |
1 |
- |
- |
- |
- |
| |
Urban |
31 |
51.67 |
60 |
31.41 |
2.28 |
1.25 |
4.15 |
0.01 |
- |
| Social support (M=25.80, SD=4.90, low score <23, high sore ≥23, range=11-35) |
|
| |
- |
61 |
|
190 |
- |
- |
- |
- |
- |
- |
| Monthly income |
Married |
46 |
75.4 |
171 |
90 |
1 |
- |
- |
- |
78.90% |
| |
Not married |
15 |
24.6 |
19 |
10 |
2.94 |
1.39 |
6.22 |
<.01 |
- |
Retrieve from Ko, J. K., Lin, Y. H., Yen, M.H., Clark, M. J. and Chen*, J. Y. (2015)
Table 3 Results of multiple regression models of HPLP subscales scores and demographic variables (I).
| |
B |
SE |
Beta |
t-value (p) |
r-value |
ANOVA F(p) |
| General family function |
- |
- |
- |
- |
0.80 |
24.39 (<0.01) |
| Constant |
3.28 |
0.25 |
- |
12.98 (<0.01) |
- |
- |
| Marital status |
0.03 |
0.03 |
0.10 |
1.03 (0.31) |
- |
- |
| Ethnicity |
-0.05 |
0.04 |
-0.13 |
- 1.52 (0.13) |
- |
- |
| Family hardiness |
-0.02 |
0.01 |
-0.33 |
- 3.04 (<0.01) |
- |
- |
| Family support |
-0.09 |
0.02 |
-0.48 |
- 4.56 (<0.01) |
- |
- |
| General health |
- |
- |
- |
- |
0.62 |
11.58 (<0.01) |
| Constant |
31.09 |
11.33 |
- |
2.74 (<0.01) |
- |
- |
| Marital status |
- 1.55 |
1.15 |
-0.16 |
-1.35 (0.18) |
- |
- |
| Monthly income |
1.30 |
0.63 |
0.23 |
2.05 (0.05) |
- |
- |
| Family hardiness |
0.85 |
0.23 |
0.44 |
3.74 (<0.01) |
- |
- |
| Family hardiness |
- |
- |
- |
- |
0.76 |
14.74 (<0.01) |
| Constant |
33.60 |
9.97 |
- |
3.37 (<0.01) |
- |
- |
| Marital status |
-0.78 |
0.50 |
-0.16 |
-1.58 (0.12) |
- |
- |
| Geography |
3.49 |
1.99 |
0.16 |
1.53 (0.08) |
- |
- |
| Family support |
0.51 |
0.42 |
0.22 |
1.66 (0.10) |
- |
- |
General health
Family genera function |
0.15
- 6.33 |
0.06
2.35 |
-0.42
-0.37 |
- 3.07 (<0.01)
- 2.70 (0.01) |
- |
- |
| Family support |
- |
- |
- |
- |
0.75 |
24.16 (<0.01) |
| Constant |
9.78 |
2.76 |
|
3.54 (<0.01) |
- |
- |
| Marital status |
-0.02 |
1.60 |
-0.01 |
-0.11 (0.92) |
- |
- |
Family hardiness
Family general function |
0.07
-3.22 |
0.04
0.69 |
0.23
-0.58 |
1.79 (0.08)
- 4.71 (<0.01) |
- |
- |
Retrieve from Chen et al. J Fam Med Dis Prev 2016, 2:030
Table 4 Predictors of family general function, duke health profile, family hardiness and family support in families of children with chromosomal abnormality (N=59).
Authors conducted the model derived from family stress, resources, and adaptation model to see which major factors are influencing on action of family health promotion and understand its relationship of family health promotion model [11]. Previous five studies had published to determine relationship between families’ perception of health and support in the care of vulnerable children [12] to determine predictors of family function in DMD and SMA family [26], to determine the demographic predictors of lower health promotion lifestyles scores in caregivers of children with disabilities [27], to test the model of family resource and health perspective of children with Turner syndrome [28]. The other two studies were not to be published to determine the level of QOL in family caregivers of disabled children and investigated the associations among dimensions of health promotion lifestyles (HPLS) and dimensions of mental health in QOL and to test the family health promotion model for family of a child with DMD and SMA.
To promote accurate reporting of family health promotion related variables, subjects will be given quality control measures to minimize errors in assessment of family health promotion. Measures to be taken by demographics, family structure analysis, family power structures, family health life pattern, family hardiness index, family APGAR, family health assessment device-general function, duke health profile. As well as to check reliability and validity of all the previous state measurements by item response checking (item total correlations) and factor analysis (exploratory factor analysis and confirmatory factor analysis), and to test structure of family health promotion model. At last authors detected the conditions of health needs, family capacity, family health behaviors, family health status in families of children with vulnerable diseases, that to compare the differences of family health needs, health capacities, health behaviors and health status between parents; to compare the differences of family health needs, health capacities, health behaviors and health status among the three difference disease groups; and to analysis the predictors influence on family health needs, health capacities, health behaviors and health status. The results will be discussed on the other paper including the multiple programs for the families’ health promotion of children with a vulnerable disease.
References
- Wikimedia Foundation (2015) Spinal muscular atrophy.
- Ginsberg Y, Quintero J, Anand E, Casillas M, Upadhyaya HP (2014) Underdiagnoses of attention-deficit/hyperactivity disorder in adult patients: a review of the literature. Prim Care Companion CNS Disord 16: 3.
- Goldacre MJ, Seminog OO (2013) Turner syndrome and autoimmune diseases: record-linkage study. Arch Dis Child 99: 71-73.
- Jørgensen KT, Rostgaard K, Bache I, Biggar RJ, Nielsen NM, et al. (2010) Autoimmune diseases in women with Turner's syndrome. Arthritis Rheumatol 62: 658-666.
- https://www.genome.gov/11508982/
- Olszewska E, Wisniewski A, Madej M, Trzcinska D, Tabor P, et al. (2010) Posture in turner syndrome patients. Pediatr Endocrinol Diabetes Metab 16: 189-195.
- Chaves CB, Amarala OP, Nelasa PA, Coutinhoa EC, Dionisiob RM (2013) Assessment of family functionality among the elderly with chronic illness. European Journal of Counselling Psychology 2: 2.
- Loveland-Cherry CJ, Bomar PJ (2004) Family health promotion and health protection. In Bomar PJ (eds.) Promoting health in families (3rd edn.). Philadephia: Saunders.
- Amundson E, Boman UW, Barrenas ML, Bryman I, Landin-Wilhelmsen K (2010) Impact of growth hormone therapy on quality of life in adults with turner syndrome. J Clin Endocrinol Metab 95: 1355-1359.
- Chen JY, Clark MJ, Chang YY, Liu YY, Chang CY (2014b) Factors affecting perceptions of family function in caregivers of children with attention deficit hyperactivity disorders. J Nurs Res 22: 165-175.
- Chen JY, Chen SS, Jong YJ, Yang YH, Lue YJ (2013) Psychosocial stress and coping strategies of parents with duchenne muscular dystrophy children during the middle stage. In: Angelini C (ed.) Muscular Dystrophy: Causes and Management. NY, USA, pp: 339-356.
- Chen JY, Chen HS, Liu MC, Chao MC (2015) Relationship between family’s perception of health and support in the care of vulnerable children. Clinics Mother Child Health 12: 1000189.
- Park JC, Choi YS, Lee WK, Kim SH, Kim JA, et al. (2005) Depression and anxiety trend according to family function in children. J Korean Acad Fam Med 26: 536-543.
- Bondy CA, Turner Syndrome Consensus Study Group (2007) Care of girls and women with turner syndrome: a guideline of the turner syndrome study group. J Clin Endocrinol Metab 92: 10-25.
- Davenport ML (2010) Approach to the patient with Turner syndrome. J Clin Endocrinol Metab 95: 1487-1495.
- Di Pinto D, Balestracci A, Dujovne N, de Palma I, Adragna M, et al. (2010) Nephrourologic pathology in girls with Turner syndrome. Arch Argent Pediatr 108: 353-357.
- Iezzoni LE, Frakt AB, Pizer SD (2011) Uninsured persons with disability confront substantial barriers to health care services. Disabil Health J 4: 238-244.
- Chen JY, Clark MJ (2010) Family resources and parental health in families of children with Duchenne muscular dystrophy J Nurs Res 18: 239-248.
- Chen JY, Clark MJ (2007) Family function in families of children with Duchenne muscular dystrophy. Fam Community Health 30: 296-304.
- Olson DH (1993) Circumflex model of marital and family systems: Assessing family functioning. In: Walsh F (ed.) Normal family processes. NY, USA: Guildford, pp: 104-137.
- Chen MY, Wang EK, Chang CJ (2006) Cross-validation and discriminant validity of adolescent health promotion scale among overweight and non-overweight adolescents in Taiwan. Public Health Nurs 23: 555-560.
- Chan CW, Perry L (2012). Lifestyle health promotion interventions for the nursing workforce: a systematic review. J Clin Nurs 21: 2247-2261.
- Chen JY, Jong YJ (2006) A stress model for parents of children with Duchenne muscular dystrophy. The Journal of Nursing (Chinese) 53: 44-51.
- Chen JY, Yen MH, Chen HS, Liu YY, Hu SH, et al. (2013) Health support: Health promotion for family having a child with DMD. In Angelini C (Edn), Muscular dystrophy: causes and management New York: Nova pp: 319-337.
- Martin P, Duffy T, Johnston B, Banks P, Harkess-Murphy E, et al. (2013) Family health nursing: a response to the global health challenges. J Fam Nurs 19: 99-118.
- Chen JY, Yen MH, Lin YH, Liu MC, Chen HS, et al. (2015) Predictors of family function in DMD and SMA family. SOJ Nurs Health Care 1: 1-9.
- Ko JK, Lin YH, Yen MH, Clark MJ, Chen JY (2015) The demographic predictors of lower health promotion lifestyles scores in caregivers of children with disabilities: a quantitative research. IJDR 5: 6300-6307.
- Chen JY, Chao MC, Yang SY, Xiao YH, Lin YH (2016) Family resource and health perspective of children with turner syndrome: a model testing. Journal of Family Medicine and Disease Prevention 2: 1-7.