Research Article - (2025) Volume 33, Issue 1
Performance Evaluation of Machine Learning Algorithms Using Vascucardiac Disease (VCD) Dataset
Fadheela Hussain1*,
Wael Elmedany2 and
Wael Elmedany3
1Department of Computer Studies, University of Technology Bahrain, Salmabad, Bahrain
2Department of Information Technology, University of Bahrian, Zallaq, Bahrain
3Department of Information Technology, University of Bahrian, Zallaq, Bahrain
*Correspondence:
Fadheela Hussain, Department of Computer Studies, University of Technology Bahrain, Salmabad,
Bahrain,
Email:
Received: 30-Jul-2024, Manuscript No. IPQPC-24-21041;
Editor assigned: 02-Aug-2024, Pre QC No. IPQPC-24-21041 (PQ);
Reviewed: 16-Aug-2024, QC No. IPQPC-24-21041;
Revised: 15-Jan-2025, Manuscript No. IPQPC-24-21041 (R);
Published:
22-Jan-2025, DOI: 10.36648/1479-1064.33.1.41
Abstract
Cardiovascular disease diagnostic is a significan’t matter and an important topic in machine learning. Researchers used several data mining methods to support healthcare professionals in the diagnosis of diseases. Concerning this objective, many algorithms have been proposed in earlier years. This research has proposed four different supervised machine learning classifiers, Artificial Neural Networks (ANN), Decision Tree (DT), Nave Bayes (NB) and Support Vector Machine (SVM), classifiers using WEKA to implement the technical assessment of this study. Two different heart disease datasets have been used in this experiment. The two datasets are, Cleveland and Hungarian clinic foundation heart dis ease, which are available at UCI machine learning repository. It has been found that ANN outperformed the three other classifiers, giving the best rate of accuracy and having the highest number of instances correctly classified. Moreover, Nave Bayes (NB) had attained the highest competitive output rate with respect to ROC measurement.
Keywords
Machine learning; CVD; ANN; DT; SVM; NB; Cardiovascular disease; Healthcare
Introduction
The world is witnessing a recent literary, cognitive, scientist movement and an explosion in the amount of digital data. Data is available via satellite and various channels of communication from devices and systems connected to the internet across the world, which referred to specialist’s data called big data. This rapid growth in the production of big data is due to the promptly increasing use of digital media by enterprises on one hand and individuals through social media on the other. Data has become a major source of strength for any knowledge-based society. Big data can help in the decision-making process by analyzing the data on any source and predicting problems, for example, analyzing patient’s data can be a key factor in health sector improvement. By analyzing big data in the healthcare sector, decision-makers can respond to epidemics, diseases, improve health services and prevent risky illnesses. The H1N1 disaster for example, has clearly demonstrated the effectiveness of big-data technologies as a more useful and quick indicator to provide public health officials with high quality and accurate information about the situation. Furthermore, heart-related diseases or Cardiovascular Diseases (CVDs) are one of the main causes of deaths in the world over the last few decades.
Consequently, there is a need for a reliable, correct and feasible analytical system to diagnose risky diseases in the proper time for better management, without human involvement such as Machine Learning (ML). Smart data analysis using Machine Learning (ML) becomes a more persistent and critical module for technological innovation. ML targets to establish a classifying language simple and easy to use and understand by individuals [1].
ML algorithms and techniques have been practiced to automate and analyze large and complex data from various medical datasets. Various researchers, currently, have been using several machine-learning techniques to aid the health care business and specialists in the diagnosis of cardiacrelated diseases. ML is considered as a good tool as it formulates rules and then makes decisions based on these rules. This paper proposed to study a selection of machine learning algorithms using two CVD datasets. The target of this paper is to also check the selected machine learning algorithms robustness using confusion matrix practice. Moreover, the paper aims to provide a qualitative study of proposed ML algorithms and check the ability to confirm the existence of heart diseases. This research paper is organized as follows. Section 2 is the literature review that describes the related works used to evaluate the performance of algorithms used. Section 3 introduces the machine-learning concepts used throughout this paper. Section 4 is a description of the dataset, section 5 machine learning algorithms, section 6 is the experiment section then combines the results from Weka classifiers to determine the best algorithms to use in predicting heart disease problem. Finally, Section 7 presents the research conclusions. By analyzing big data in the healthcare sector, decision-makers can respond to epidemics, diseases, improve health services and prevent risky illnesses. The H1N1 disaster for example, has clearly demonstrated the activeness of big-data technologies as a more useful and quick indicator to provide public health officials with high quality and accurate information about the situation. Furthermore, heart-related diseases or Cardiovascular Diseases (CVDs) are one of the main causes of deaths in the world over the last few decades. Consequently, there is a need for a reliable, correct and feasible analytical system to diagnose risky diseases in the proper time for better management, without human involvement such as Machine Learning (ML). Smart data analysis using Machine Learning (ML) becomes a more persistent and critical module for technological innovation. ML targets to establish a classifying language simple and easy to use and understand by individuals [2].
ML algorithms and techniques have been practiced to automate and analyze large and complex data from various medical datasets. Various researchers, currently, have been using several machine-learning techniques to aid the health care business and specialists in the diagnosis of cardiacrelated diseases. ML is considered as a good tool as it formulates rules and then makes decisions based on these rules. This paper proposed to study a selection of machine learning algorithms using two CVD datasets. The target of this paper is to also check the selected machine learning algorithms robustness using confusion matrix practice.
Moreover, the paper aims to provide a qualitative study of proposed ML algorithms and check the ability to concern the existence of heart diseases. This research paper is organized as follows. Section 2 is the literature review that describes the related works used to evaluate the performance of algorithms used. Section 3 introduces the machine-learning concepts used throughout this paper. Section 4 is a description of the dataset, section 5 machine learning algorithms, section 6 is the experiment section then combines the results from Weka classifiers to determine the best algorithms to use in predicting heart disease problem. Finally, Section 7 presents the research conclusions [3].
Materials and Methods
The data mining techniques are divided into four types, classification, clustering, regression and association rule mining. Classification methods are the most widely used algorithms in the healthcare sector as it helps to predict the status of the patient; therefore, it is most suitable for the current research experiment. As an alternative to the previously selected characteristics, automated selection of a large number of data to increase the precision of risk classification, several studies have been proposed. However, those studies mostly take into consideration the structured data. In regards to unstructured data, for instance, Convolutional Neural Network (CNN) can be used as a tool to extract the text characteristics. The convolutional neural network attracted wide attention and also accomplished very good results. Moreover, a Support Vector Machine modeling (SVM) for prediction of diabetes and pre-diabetes is presented in the discriminative abilities of SVM models for classification study. The use of the NHANES dataset was the core strength of this study. Results showed that the special capability of SVM models was similar to the epidemiological technique, where the multivariate logistic regression is commonly used. Moreover, high performance in solving classification problems in many biomedical ends was reached using (SVM) algorithm in a supervised machine learning method, especially in bioinformatics. This kind of preparation has recently been used to improve diseases automated classification and develop systems aiming to spot illnesses in the clinical site. Naive Bayes model is a simple but effective classification method. Nave Bayes model is presented in disease prediction by human habits study (Piprotar and Vekariya) [4].
This study found that the weighted Nave Bayes classifier gave better accuracy compared to the existing traditional Nave Bayes algorithm. Moreover, the study tried to achieve more effiency and high utilization of Nave Bayes classifier for human habits and habits that are responsible for some specific diseases. Furthermore, the weighted Nave Bayes classier is suggested to be applied to all diseases to and out results that are more precise. Another paper provides a model of student’s success prediction based on Bayes algorithms and suggests the best algorithm based on performance details. The overall model is divided into two stages, the first stage is to and the most correlated questions to thernal class and the second is practicing algorithms and ending the optimal algorithm. A comparison is made between these two Bayes algorithms based on performance details and finally, the nave Bayes algorithm is selected as an optimal choice for student’s success prediction. Furthermore, the Naive Bayes and Jelinek-mercer algorithm had been presented in diagnosing heart disease. Therefore, the development of decision support in the Heart Disease Prediction System (HDPS) using data mining Nave Bayes modeling technique had been developed. Prediction of the probability of patients getting heart disease can be done by using medical profiles such as blood pressure and blood sugar, chest pain, ECG graph etc. Matlab was the application used to employ the method as it takes medical tests as an input parameter. In addition, the method can be applied as a training device to train sta such as nurses and medical students to detect patients with heart disease. In addition, the study concluded that Jelinek-mercer smoothing technique is more capable than Naive Bayes to forecast patients with heart disease. Moreover, a study regarding cardiovascular disease risk prediction, intended to compare auto-machine learning techniques against a graduate student manually builds multiple machine learning classifiers. The study found that automatic machine learning takes 1 hour to create classifiers and achieve a better result than the ones built by the graduate student in one month. A study in the prediction of heart disease using decision tree approach showed that it is possible to predict heart disease vulnerability in diabetic patients with reasonable accuracy. A classifier of this kind can aid in early detection of the vulnerability of a diabetic patient to heart disease. The study also attempts to show the reprocessing of a data set for the removal of duplicate and normalizing records and represent information in the database using the algorithm [5].
Decision tree algorithm is used in order to determine the significance of regularization of factors chose for risk predictions during pregnancy discussed. The researcher aimed to match the outcomes achieved using the C4.5 classifiers on un standardized and standardized datasets. Also, the research examined the performance of the C4.5 techniques in terms of its forecasting of the accuracy by using it on the created database from collecting standardized pregnancy data. The study found that when a user applied the C4.5 decision tree classifier on standardized data than unstandardized data has vast potential in accuracy for predicting the risk stages in pregnancy phases. The work in Reddy et al. examined how location can be predicted after observing a series of human activities using a decision tree algorithm. This study was conducted using WEKA software based on student’s college datasets. A study found that, given a number of human events and their personal information, there is a possibility that a decision tree classifier provides useful rules set about location prediction. Moreover, additional study, Lee and Lee examined several decision tree algorithms, advantages and disadvantages, their characteristics and challenges. More study algorithms, such as Artificial Neural Network (ANN) technique is used in many studies. One study proposed the ANN technique applied using monthly rainfall data to develop one-month and two months ahead predicting prototypes for rainfall expectation for northern India. The researchers used the Back Propagation Algorithm and Leven berg Marquardt training function to apply the Feed Forward Neural Network (FFNN). The capability of the two models has been evaluated based on Mean Square Error (MSE), Regression Analysis (RA) and Magnitude of Relative Error (MRE) [6].
ANN technique showed optimistic consequences for both models. Furthermore, a study Chaudhuri and Ghosh presented Multilayer Feed Forward Neural Network (MLFFNN) and Nonlinear Autoregressive models with Exogenous Input (NARX) neural network. Also, in this study techniques used for time series, econometric methods are Generalized Autore Gressive Conditional Heteroskedastic (GARCH) and Exponential Generalized Autoregres Sive Conditional Heteroskedastic (EGARCH). The study revealed that, although (GARCH, EGARCH) approaches were quite capable of predicting the exchange rate, MLFNN and NARX were most effective. All studies stated earlier analyzed the four mentioned algorithms, DT, ANN, NB and SVM using one dataset only, our work is different as it evaluates these algorithms using two different datasets [7].
Machine learning concept during the previous decades, the science of Machine Learning (ML) has become a fundamental study of statistical models and algorithms and one of the information technology assets. Machine learning is a division of Acritical intelligence that deals with assisting technologies to learn the best possible re sponge of a hidden problem. ML is a set of observations with the purpose of developing the certainty of clusters or classes that can be given in the data. For the machine learning elements, a distinction is drawn between supervised learning and usurper vised learning. Supervised learning is often stated as a judgment by which is selected the establishing of the classification rule from a given appropriately categorized data. The classification method is a data mining function that assigns objects in a gathering technique to object classes or groups. Classifications goal is to evaluate the objective class precisely for each case in the data. Classification models can be verified by matching the projected values to recognized target values in a set of testing data. In the classification task, the previous data is normally divided into two datasets, the part sets are for building the model and the other for testing the model. Figure 1 is a purposed real-life situation process of applying supervised ML for prediction [8].

Figure 1: Proposed CVD machine learning system.
Description of datasets two different datasets experienced in this study, heart-h.ar (Hungarian data), and heart car (Cleveland data) in this experiment from the UCI repository. These datasets describe factors of heart disease. These datasets describe risk factors for heart disease. These databases include 76 attributes but published comparable experiments used only a subset of 14 of them. In specific, to date, only Cleveland database is the one that has been used by machine learning researchers. Those 14 attributes of the datasets had been measured on 303 instances who have heart disease in heart-c.ar and 294 in heart-h.ar database. Furthermore, those individuals had been grouped into two levels of classes as shown in Table 1 [9].
| Diagnosis |
Description |
| <50% diameter narrowing |
No heart disease |
| >50% diameter narrowing |
Has heart disease |
Table 1: Predictable attribute.
Patients who are diagnosed to have no heart disease, their class of diagnosis will be shown as 50% with value 1.
In the two cardiovascular datasets, both name and social security number attribute of the patients were recently removed from the two heart disease databases and replaced with a dummy variable. There is one file, the one that contains the Cleveland database has been processed. There are also four unprocessed les existing in the same directory. Therefore, this paper used these specific attributes to permit judgment with other studies.
As shown in Table 2, variables consist of five continuous and eight discrete attributes, seven values missing in the dataset and three of the discrete attributes have two levels. Three of the discrete attributes have three levels whereas two have four levels. Selected patients age between 29 years old and 77. Gender value 1 is denoted for Male patients and gender value 0 are denoted female patients attribute. Moreover, in Table 2 there are four categories of chest pain in the datasets that can be considered as a risk factor of heart disease. Also attribute chest pain showed that type 1 Angina is a chest pain that occurs during mental or emotional stress. It is triggered by a drop in blood flow to heart muscles as of tightened coronary arteries. The attribute non-angina chest pain was caused probably due to numerous causes and may not frequently be due to definite heart illness. The fourth type is asymptomatic and it may not be an indication of heart disease. Moreover, element trestbps is used in this table for reading the resting blood pressure. Attribute Chol is the cholesterol level. The FBS element is the fasting blood sugar level; this rate is allocated as 1 when fasting blood sugar is below 120 mg/dl and 0 if it exceeding the level. Also, in Table 2, the Restecg component in the dataset is resting electrocardiographic result and element thalach is the maximum heart rate, where the exang element is exercise induced angina, which is noted as value 1 if there is pain and 0 if the patient has no pain. The old peak element is the ST depression induced by exercise. Attribute slope is the slope of the peak exercise ST segment, whereas ca attributes is the number of major vessels colored by fluoroscopy, also thal value is the duration of the exercise test in minutes and num value is the class attribute. Finally, the item num in Table 2 represents the (binary) class attribute: Class <50 means no disease and class >50 1 indicates a patient having heart disease, this attribute data is often referred to as the decision column. Out of 303 patients, there are 138 patients who actually have heart disease in UCI/heart-c.ar dataset and out of 294 cases there are 106 in heart-h.ar dataset (Hungarian data) have heart disease. This is visualized by Weka as follow (Tables 2-4) [10].
| No |
Input |
Description |
Value |
| 1 |
Sex |
Female |
0 |
| Male |
1 |
| 2 |
Age |
In year |
Continuous |
| 3 |
Chest pain |
Typical type 1 angina |
1 |
| Typical type angina |
2 |
| Non-angina pain |
3 |
| Asymptomatic |
4 |
| 4 |
Fbs (Fasting Blood Sugar) |
>120 mg/dl |
1 |
| <120 mg/dl) |
2 |
| 5 |
Restecg (resting electro-graphic results, ECG) |
Normal |
0 |
| Having ST-T wave abnormality |
1 |
| Left ventricular hypertrophy |
2 |
| 6 |
Exang: Exercise induced angina |
Yes |
1 |
| No |
0 |
| 7 |
Slope–the slope of the peak exercise ST segment |
Un-sloping |
1 |
| Flat |
2 |
| Down-sloping |
Normal |
| 8 |
Slope–the slope of the peak exercise ST segment |
Un-sloping |
1 |
| Flat |
2 |
| Down-sloping |
Normal |
| 9 |
Trestbps |
Test blood pressure |
Continuous |
| 10 |
Chol |
Cholesterol serum (mg/dl) |
Continuous |
| 11 |
Thalach |
Maximum heart rate achieved |
Continuous |
| 12 |
Oldpeak |
ST depression |
Continuous |
| 13 |
Ca |
Number major vessels |
0-3 |
| 14 |
(num) |
Value 0: <50% diameter narrowing value 1: >50% diameter narrowing |
From: 0 to: <50 From: 1 to: >50 |
Table 2: ML cardiovascular datasets attributes.
| Num |
No. of cases |
| <50% without CVD |
165 |
| >50% with CVD |
138 |
Table 3: ML cardiovascular datasets attributes (UCI/heart -c.arff dataset).
| Num |
No. of cases |
| <50% without CVD |
188 |
| >50% with CVD |
106 |
Table 4: ML cardiovascular datasets attributes (UCI/heart -h.arff dataset).
For clustering analysis, the two datasets used in this experiment contain 303 instances of patients and panels of 14 attributes including the target attribute for the first dataset (heart-c.ar) as mentioned earlier, there are basically two categories of population among this dataset. Moreover, 294 instances of patients and a panel of 14 attributes, for the second dataset (heart-h.ar dataset). The first class of the (heart-c.ar) dataset is healthy and the number of this class is 165. The other class in the same dataset is the patient who is subjected to have heart disease and its number is 138. Furthermore, the first class of the (heart-h.ar) dataset is healthy and it contains 106 cases. The other class in this dataset is the patients who have heart disease and it contains 188 cases.
Results and Discussion
Machine Learning Algorithms
In the past few years, numerous systems have been suggested. This study attempts to study four different supervised ML techniques for grouping of heart disease data, which are Nave Bayes (NB), Artificial Neural Networks (ANNs), Decision Tree (DT) and Support Vector Machine (SVM). The following subsections summarize the use and description of every selected supervised ML algorithm.
Nave Bayes (NB) Nave Baye is a capable and probabilistic simple classifier built on Bayes theorem with an individuality assumption amongst the characteristics. The relations between dependent events can be categorized using Bayes theorem that is presented in Piprotar and Vekariya; Miao et al.; Padmanabhan et al. Based on a common principle, Nave Bayes is not a single algorithm; but it is a family of algorithms. The occurrence or nonoccurrence of a specific structure of a class is not related to the existence and not lack of somewhat other structures as the NB model assumed. NB generally no requirements, good for few categories variables, The Naive Bayes algorithm can be used for both binary and multiclass classification problems. The advantage of Naive Bayes (NB) is that this algorithm is super simple as the user is just doing a bunch of counts.
A NB classifier will cover in a quicker way than discriminative models, such as logistic regression if Naive Bayes restricted individuality supposition actually holds, so the user will require less training data. Even if the NB assumption doesn’t hold, a NB classifier often performs surprisingly well in practice. In Machine Learning (ML), NB classifiers are a family of simple probabilistic classifiers based on applying Bayes theorem with strong (naive) independent assumptions between the features. Bayes theorem states a technique of calculating posterior possibility P(ab) from P(a), P(b) and P(b/ a), as the equation below shows
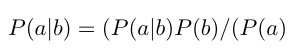
Where P(a/b) is the posterior chance of class (c, target) given predictor (y, attributes). And P(a) is the earlier possibility of the class. Whereas P(b/a) is coincidental that is the possibility of forecaster assumed class. The final class P(b) is the prior probability of predictor in the Nave Bayes theorem.
Artificial Neural Networks (ANNs)
Artificial Neural Networks (ANNs) are networks that are motivated via biological neural networks. ANN system is a classifier with complex relationships that is non-linear between the inputs and the outputs. ANN involves a collection of processing elements called neurons that are working in parallel to create the output. Transferring a signal to further neurons can be accomplished in every association among neurons, whereas via the sum of the nonlinear function of all neurons inputs, every neuron can calculate its output. A neuron is designated in measured expressions by the following mathematical equations
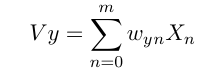
Where xn is a signal at the input of synapse or linking n, connected to neuron y, is multi plied by synaptic weight Wyn In the equation w(0) is considered as the bias and X0=1 and bn=(Vb)
Decision Tree (DT)
In data mining Decision Tree (DT) is considered as a common learning method used. The decision tree is stated as a hierarchal and predictive model in order to achieve the elements target value in the leaf, it uses the elements observation as branches. The decision tree is a tree with decision nodes, which have more than one branch and leaf nodes, which represent the decision. No distribution requirement in DT, a decision tree is heuristic, good for few categories variables, not suffer multi-collinearity by choosing one of them. The decision tree can attempt to fit a complex tree to the data, leading to over fitting. Its accuracy depends a lot on the data presented, for example, the tree can become biased towards a specific class if it occurs a lot or become confused when trying to fit certain rules inferred from the data. The core advantages are quite simple, easy to communicate, easy to maintain, DT is quite intuitive and finally, the prediction is quite fast. Building a decision tree, which is designed by the researcher needs to compute two types of entropy using frequency tables as follows:
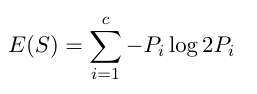
Where simply the ‘Pi’ is the recurrent probability of an element/class i in used data.
Support Vector Machine (SVM)
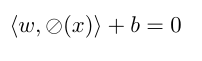
A class of supervised learning algorithms is Support Vector Machine (SVM). SVM model is a representation of the samples as points in space are mapped in such a way that the samples of the distinct categories are separated by a clear gap. Support Vector Machine has become more a popular tool for machine learning tasks. SVM is a supervised learning model that is applied mainly for classification; however, it can also work for regression problems. The basic SVM works as a binary classifier where the training data is divided into two classes. For a multiclass problem, the basic SVM algorithm is executed repeatedly on the training data. The SVM algorithm mapped feature vector into a higher dimensional vector space, where a maximum margin hyper-plane is established in this space. The distance from the hyperplane to the nearest data point on each side is maximized. Maximizing the margin and thereby producing the largest possible distance between the separating hyper-plane and the instances on each side of it has been proven to reduce an upper bound on the expected generalization error. SVM technique is a very e effective method of machine learning that is based on the mapping of learning cases from input space to a novel high dimensional. The SVM could be a vast dimensional feature space in which cases are linearly divisible. The method then can and an ideal hyperplane.
Datasets and Evaluation Methodology
Waikato Environment for Knowledge Analysis (WEKA) used in this study for classification experiments. Software WEKA as a standard, suite various machine learning algorithms, having several tools for data pre-processing, classification, regression, clustering, association rules and visualization. Therefore, this paper proposed four different supervised machine-learning algorithms evaluated using Weka software. Usually, the crossvalidation procedure has been used efficiently with machine learning algorithms for different datasets. In order to evaluate the performance of used ML algorithms in prediction using the cardiac disease dataset, a well-known measure will be presented based on the generated confusion matrixes. The confusion matrix and the used evaluation measures are discussed in the following subsections. This section presents measures for assessing how good or how accurate our classifiers are at predicting the class level of tuples described.
Confusion Matrix
The confusion matrix is a precise table that is used to measure the performance of machine learning algorithms. It is a summary of prediction results on a classification problem. The significance of the confusion matrix is that the number of correct and incorrect predictions are summarized with count values and broken down by each class. Confusion matrix gives the insight not only into the errors being made by used classifiers but more essentially the types of errors that are being made. Table 5 shows an example of a generic confusion matrix. There is a representation of the instances in an actual class in each row of the matrix, whereas each column characterizes the instance in a predicted class or vice versa. The confusion matrix summarizes the results of the testing algorithm and provides a report of the number of True Positive (TP), False Positives (FP), True Negatives (TN) and False Negatives (FN).
|
|
Actual
|
|
1
|
0
|
|
Class X
|
Class Y
|
|
Predicted
|
1
|
Class X
|
TP
|
FP
|
|
0
|
Class Y
|
FN
|
TN
|
Table 5: Confusion matrix.
Table 5 the confusion matrix defines the most basic terms, i.e., True Positives (TP) term indicates that these are cases in which prediction is 1 that they have the disease, and actually they do have the disease. While True Negatives (TN) term is the case when both actual class and predicted class of data point is 0 the cases with no disease. Moreover, False Positives (FP) when the case predicted 1, but they do not really have the disease 0, also known as a type I error. Finally, False Negatives (FN) when case predicted 0, but they actually do have the disease 1, also known as a type II error.
Accuracy
Overall, often is how the classifier correcting. After the confusion matrix is created and all the component values are determined, hence becomes quite easy to calculate the accuracy. Accuracy can be de need as the number of correct predictions made by created ML model. Accuracy is the proportion of true results (both TP and TN) among the total number of examined instances. The best accuracy is 1, whereas the worst accuracy is 0. Accuracy is computed by using the following formula:

Precision (Positive Predictive Value)
Precision practice is used in document retrievals; precision can be defined as the number of correct documents returned by used ML model. This practice usually used when the goal is to limit the number of False Positives (FP). It tells how accurate the positive predictions are. It is calculated as the number of correct positive predictions divided by the total number of positive predictions. Best precision is 1, whereas the worst is 0 and it can be calculated as:
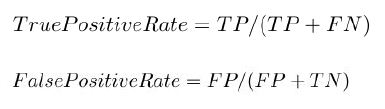
Recall (True Positive (TP) Rate or Sensitivity)
The recall method is defined as the number of positives returned by the used ML system. When the goal is to limit the number of False Negatives (FN) then recall is usually used. The practice is also known as sensitivity and True Positive Rate (TPR). Users can calculate the recall by dividing the number of positive predictions by the total number of positives. The result of the best recall is 1 and the worst is 0. Recall formula is
False Positive Rate (FPR)
FPR is one of the false positives (instances falsely classified as a given class).
Specificity
Specificity in contrast to recall can be defined as the number of negatives returned by the ML model used. It can easily calculate it by confusion matrix with the help of following formula:
F-measure (F1 score or F score)
The F-measure also called F-score; it is the harmonic mean of precision and recall. F measure is de need as the weighted harmonic mean of precision and recall. Usually, it is used to combine the recall and precision measures in one measure in order to compare different ML algorithms with each other. It can be interpreted as a weighted average of the precision and the recall, where 1 is the best value and 0 is the worst. The Fmeasure only produces a high result when precision and recall are both balanced which makes it very significant. The Fmeasure formula is given by

Receiver Operating Characteristics (ROC) Curve
ROC is considered as one of the most significant standards output by Weka. ROC is measuring how the classifiers are working in general. A receiver operating characteristic is defined as a space by false positive rate and true positive rate at several cut-off points.
Precision-Recall Plot (PRC)
PRC is more informative than the ROC plot when evaluating binary classifiers on imbalanced datasets. The PRC plot shows the relationship between precis. The relationship between recall and precision can be viewed in the stair-step part of the plot, at the edges of these steps, with minor alteration in the threshold; it significantly decreases precision, with only a minor increase in recall. To summarize such a plot, Average Precision (AP) can satisfy this process as the weighted mean of precisions achieved at each threshold, with the increase in recall from the previous threshold used as the weight.

where Rn and Pn are the precision and recall at the nth threshold.
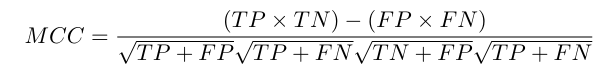
Matthews Correlation Coefficient (MCC)
MCC is used in machine learning as a measure of the quality of binary (two-class) classifications. MCC is considering true and false positives and negatives and is commonly regarded as a balanced measure, which even if the classes are of very different sizes MCC can be used. The MCC can be calculated directly from the confusion matrix using the formula:
Experiment
After loading our data, the evaluation process is implemented using the Weka tool. In WEKA software, the 10-fold crossvalidation option chosen in this experiment and run the classifier and evaluate the accuracy of the obtained classification simply by looking at the percentage of the corrected classify instances for each classifier used. Weka presents the classifiers used in this experiment normally as shown in Table 6.
| Generic name |
WEKA name |
| Bayesian network |
Naive Bayes (NB) |
| Support vector machine |
SMO |
| C4.5 Decision tree |
J48 |
| Artificial Neural Network (ANN) |
Function multilayer perception |
Table 6: ML cardiovascular datasets attributes.
As per the result showed in Tables 7 and 8, TP rate, FP rate, ROC and RPC area of various techniques have been used in this experiment for the two CVD databases inspected.
TPR for ANN is high among all and its FP rate is low in the two datasets. MCC for ANN is again high, this means that agreement between actual and predicted class is high. But ANNs ROC area has a lower rate than NB. It is also noticeable that for all algorithms used in this experiment, the ROC area and F-Measure evaluation are closely equivalent to 1. Consequently, the examined techniques have good predictive capabilities for heart disease of Wisconsin dataset. Also, it has been noticed from these results that NB also perform equally well as ANN. Based upon two datasets results, it has been observed that all models for CVD prediction perform almost equally well on all datasets. However, enhancement is essential as misclassification is costly, so further improvement is required.
| Classifier |
TP rate |
FP rate |
Precision |
Recall |
MCC |
ROC area |
PRC area |
| SVM |
0.842 |
0.169 |
0.843 |
0.842 |
0.681 |
0.836 |
0.786 |
| NB |
0.835 |
0.171 |
0.835 |
0.835 |
0.667 |
0.904 |
0.902 |
| DT |
0.776 |
0.235 |
0.776 |
0.776 |
0.546 |
0.809 |
0.772 |
| ANN |
0.98 |
0.019 |
0.98 |
0.98 |
0.96 |
0.976 |
0.976 |
Table 7: WEKA detailed accuracy for (UCI/heart-c.arff) dataset.
| Classifier |
TP rate |
FP rate |
Precision |
Recall |
MCC |
ROC area |
PRC area |
| SVM |
0.827 |
0.238 |
0.825 |
0.82 |
0.61 |
0.79 |
0.76 |
| NB |
0.837 |
0.195 |
0.836 |
0.83 |
0.64 |
0.906 |
0.91 |
| DT |
0.81 |
0.256 |
0.807 |
0.81 |
0.57 |
0.752 |
0.72 |
| ANN |
0.85 |
0.183 |
0.849 |
0.85 |
0.67 |
0.895 |
0.89 |
Table 8: WEKA detailed accuracy for (UCI/heart-h.arff) dataset.
The correctly and incorrectly percentage classified instances is predicted in Figure 2 and 3 for both datasets. Accuracy or sample accuracy is often the terms used for the percentage of correctly classified instances. As results showed, compared to other classifiers ANN obtained the highest correct classification instances on training for both datasets used. This method outperformed the other approaches significantly. ANN technique classified properly 250 instances (85.03%) out of 294 cases; and just 44 instances were misclassied (14.9%) for hearth. ar dataset. And in heart c.ar dataset experiment which has 303 instances, 294 (83.1%) were also classified perfectly using this method; and only 51 cases were misclassified (16.8%) using ANN.
The correctly and incorrectly percentage classified instances have some disadvantages as a performance estimate (not chance corrected, not sensitive to class distribution), so some of the other measures will be required to study. ROC Area, or area under the ROC curve, is a more superlative measure. When the observations are balanced between each class, ROC curves are suitable, while for imbalanced datasets precisionrecall curves are applicable. In these together circumstances, the Area Under the Curve (AUC) is suitable to be used as a summary of the model capability.

Figure 2: WEKA correctly and incorrectly percentage.

Figure 3: WEKA correctly and incorrectly percentage.
Specifically, in medical diagnosis, misclassifications cost is very high. The selection of suitable technique its performances is a matter. Consequently, if a technique predicts one misclassification parallel to one thousand correct predictions, then the technique must be ignored. The capability of the technique depends mainly on data. Therefore, choosing a well-established model having less dependency on data and at the same time characteristics of a generalized performance is a challenging subject.
F-Score/F-Measurement
Sometimes it is important to include the F-score or the Fmeasure in order to complement the AUC and also to indicate the strength of the classifier in different terms. F-Score is a different type of accuracy measure; it takes into account other assessments such as recall, class imbalances and precision. As shown in Figure 4, the ANN model achieved an F1 score of 98% and 85% in heart c.ar and heart-h.ar dataset respectively.

Figure 4: WEKA correctly and incorrectly percentage.
ROC Curve
The purpose of the ROC curve is usually to examine the performance of a binary classifier by creating a graph of the true positives versus false positives for every classification threshold. Figures 5 and 6 are the ROC curve and AUC comparison of both datasets. Here Nave Bayes (NB) achieved a higher accuracy among all other classifications in both datasets.

Figure 5: WEKA ROC and AUC for each method in <50 class of heart-h.ar database.

Figure 6: WEKA ROC and AUC for each method in <50 class of heart-c.ar dataset.
Conclusion
This paper recommended four classifiers of machine-learning methods and assessed them over a unique two datasets of CVD diseases. The proposed systems were Artificial Neural Networks (ANN), Support Vector Machines (SVM), Decision Tree (DT) and Naive Bayes (NB). From this experiment, different results were obtained with a slight degree of difference for each of them. Using the whole two datasets, ANN got the best performance among other classifiers, infact, only 44 instances were misclassified for heart-h.ar dataset cases and only 51 cases were incorrectly classified. The remaining classifiers returned lower performance than ANN. In order to compare the four classifiers with respect to ROC and AUC, Nave Bayes (NB) achieved a higher accuracy among all other classifications in both datasets. Moreover, it can be concluded as per this study results, that all classifiers reached a rational performance. At the same time, this study found that the ANN algorithm accomplished a considerably better performance than other evaluated classifiers on the two datasets. Therefore, this paper suggested applying this technology in the medical area and the ML used as essential tools across the maximum range where to answer the diversity of biomedical questions. Additionally, the main limitation of this work is the small size of the datasets. For upcoming and future work, researches could involve more intense testing using larger heart disease databases to get more precise and verifying their outcomes in terms of different measures and ends the factors that are most predictive of heart disease.
References
- Altman DG, Bland JM (1994 ) Diagnostic tests. 1: Sensitivity and specificity. BMJ. 308(6943):1552.
[Crossref] [Google Scholar] [PubMed]
- Atkov OY, Gorokhova SG, Sboev AG, Generozov EV, Muraseyeva EV, et al. (2012) Coronary heart disease diagnosis by artificial neural networks including genetic polymorphisms and clinical parameters. J Cardiol. 59(2):190194.
[Crossref] [Google Scholar] [PubMed]
- Baldi P, Brunak S, Chauvin Y, Andersen CAF (2000) Henrik Nielsen Assessing the accuracy of prediction algorithms for classification: An overview. Bioinformatics. 16(5):412424.
[Crossref] [Google Scholar] [PubMed]
- Bengio Y, Grandvalet Y(2004) No unbiased estimator of the variance of k-fold cross validation. JMLR. 5:10891105.
[Google Scholar]
- Detrano R, Janosi A, Steinbrunn W, Sterer MP, Schmid JJ, et al. (1989) International application of a new probability algorithm for the diagnosis of coronary artery disease. Am J Cardiol. 64(5):304310.
[Crossref] [Google Scholar] [PubMed]
- Hamoud A, Humadi A, Awadh WA, Hashim AS (2017) Students’ success prediction based on Bayes algorithms. Intern J Comp Appl. 178(7):6-12.
[Google Scholar]
- Jain VK, Kumar S (2015) An effective approach to track levels of influenza-A (H1N1) pandemic in India using twitter. Procedia Comput Sci. 70:801-807.
[Crossref] [Google Scholar]
- Lakshmi BN, Indumathi TS, Ravi N (2016) A study on C. 5 decision tree classification algorithm for risk predictions during pregnancy. Proc Technol. 24:1542-1549.
[Crossref] [Google Scholar]
- Lee JS, Lee ES (2014) Exploring the usefulness of a decision tree in predicting people's locations. Procedia Soc Behav Sci. 140:447-451.
[Crossref] [Google Scholar]
- Maglogiannis I, Loukis E, Zafiropoulos E, Stasis A (2009) Support vectors machine-based identification of heart valve diseases using heart sounds. Comput Methods Programs Biomed. 95(1):47-61.
[Crossref] [Google Scholar] [PubMed]
Citation: Hussain F, Elmedany W, Hamad M (2025) Performance Evaluation of Machine Learning Algorithms Using Vascucardiac Disease (VCD) Dataset. Qual Prim Care. 33:41.
Copyright: © 2025 Hussain F, et al. This is an open-access article distributed under the terms of the Creative Commons Attribution License, which permits unrestricted use, distribution, and reproduction in any medium, provided the original author and source are credited.

