Keywords
Photoluminescence; Charge transfer; Energy transfer; Energy conversion; Optoelectronics; Polymers; Dyes; Marcus theory
Introduction
Photo induced charge transfer (CT) is a process in which an electron is transferred from an electron donating species (D) to an electron accepting species (A) upon photo excitation. On the contrary, photo induced energy transfer (ET) usually takes place through the non-radiative multiple interactions or couplings between an exciton (a tightly bond electron-hole pair) donating (D) and accepting (A) species (also referred to as the exciton transfer). Both transfers are distinct from each other but sometimes occur simultaneously, and this may lead to certain misinterpretation or confusion of physical processes. Basic difference between the two transfers is that the CT process involves an electron (or charge) transfer, whereas the ET process involves an exciton transfer [1-4]. The main problem or challenge is to distinctly separate the two processes or contributions so better solar photoelectric energy conversion materials and devices can be developed or optimized.
Abramavicius and Mukamel [5] proposed a tight-binding two-band model and used it to simulate the energy-transfer and charge-separation dynamics without separating the two processes. Sontakke et al. [4] used a dynamic rate equation approach to distinguish the electron and energy transfer processes between lanthanide ions in dielectric hosts. Chen et al. [6] studied charge and energy transfer using Time-Resolved pulse Laser spectroscopic experiments at nanosecond/picosecond levels without separating the two processes. Kandada et al. [7] analyzed charge and energy transfer between P3HT and PCBM in different timescale using the multi-pass transient absorption technique (TrAMP) again without separating the two processes.
In this study, a series of polymer/dye composite pairs, where the same polymer Poly(3-hexylthiophene-2,5-diyl) or P3HT paired with a series of molecular dyes (Figure 1) of different frontier orbitals are being investigated for potential optoelectronic conversion applications. A facile or straight forward method to analyze and separate the charge and energy transfer processes between P3HT and dyes via concentration dependent PL spectroscopy under certain conditions is described. To our best knowledge this is the first of such report.
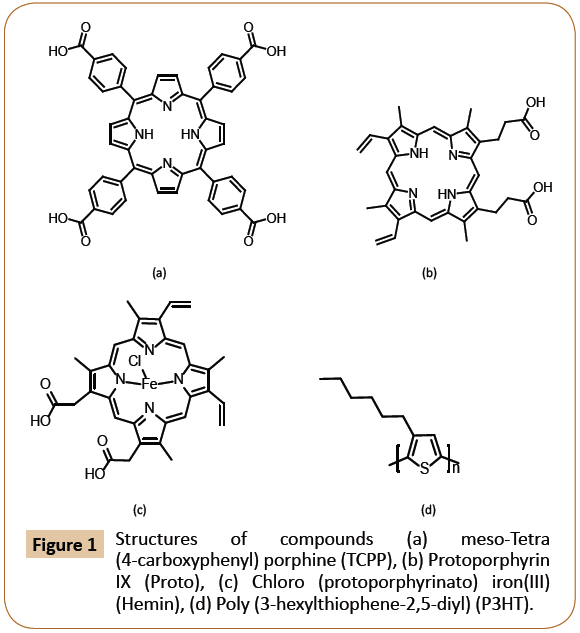
Figure 1: Structures of compounds (a) meso-Tetra (4-carboxyphenyl) porphine (TCPP), (b) Protoporphyrin IX (Proto), (c) Chloro (protoporphyrinato) iron(III) (Hemin), (d) Poly (3-hexylthiophene-2,5-diyl) (P3HT).
Experimental Section
Materials
Poly (3-hexylthiophene-2,5-diyl) or P3HT was purchased from Sigma-Aldrich and used as is without further purification. Meso- Tetra (4-carboxyphenyl) porphine (TCPP), Ferriprotoporphyrin IX chloride (Hemin), and Protoporphyrin IX (Proto) were purchased from Fisher-Scientific. Figure 1 exhibits all the materials molecular structures.
Characterizations
Optical spectroscopy: UV-Vis measurements were performed on a Perkin Elmer Lambda 1050 spectrophotometer in Tetrahydrofuran (THF) solutions. Photoluminescence (PL) spectra were collected on an ISA Flouromax-3 luminescence spectrofluorometer in THF solutions. (Excitation slits: 5 nm; Emission slits: 2 nm. Excitation wavelength: 440 nm). 1.04 × 10⁻⁶ M P3HT in THF was prepared and certain amount of dye was added to P3HT/THF solution forming P3HT/dye mixture solution with the concentration of dye varies from 1.25 × 10⁻⁷ M to 1.00 × 10⁻⁶ M in THF. Photoluminescence quenching Stern-Volmer plots, linear fitting, and quenching constants (Ksv) derivations are well established in literature and is utilized in this study [8].
Cyclic voltammetry (CV): The CV measurements were performed in 0.10 M TBA-HFP/acetonitrile solution by a Bioanalytical (BAS) Epsilon-100W tri-electrode cell system and 2 mM ferrocene/0.10 M TBA HFP/CH3CN solution was used as CV internal reference. Before starting a measurement, dry nitrogen gas was bubbled through the solution for 5 minutes to remove any dissolved oxygen. Scan rate was used as 100 mV/s [9].
Solar cell devices fabrication and testing: 10.00 mg P3HT, 10.00 mg PCBM and dye (1.15 mg TCPP, 0.95 mg Hemin and 0.82 mg Protoporphyrin, respectively) were dissolved in 1 mL mixture solvents of 1,2-Dichlorobenzene (DCB) and Dimethylformamide (DMF) (3:1, v/v). The mixture solution was stirred for 24 h at room temperature. P3HT (5.80 × 10⁻²M), PCBM (1.10 × 10⁻²M) and dye (1.45 × 10⁻³M). The ITO glass (Rs=8-12 Ω) was cleaned by sequential 5 minus sonication in solutions of detergent, acetone, isopropyl alcohol. Then ITO glass was rinsed with deionized water and dried with N2. PEDOT:PSS aqueous solution (Clevious PVPAI 4083, from H.C. Starck) was spun onto clean ITO glasses in 5000 rpm for 30 s forming 30 nm thin film, followed by drying in vacuum oven at 90°C for 1 hour. After cooling down to room temperature, the mixture solution was spun on the top of “ITO/ PEDOT:PSS” film in 1000 rpm for 60 s. Samples were kept in a high vacuum oven at 80°C for 30 mins. All the sample solutions were filtered by 0.2 μm filter. After cooling down to room temperature, evaporation of metal Al was performed in a glove box with the pressure of 1.0 × 10⁻⁷mbar. The film thickness was 100 nm. I-V measurement was performed by a solar simulator (1.5 AM simulated sunlight radiation), a current-voltage source measure unit (Keithley SMU-237).
Results and Discussions
Effect of the acceptor or PL quencher concentration
The charge transport properties in conjugated materials critically depend on the packing order of the chains in the solid state as well as on the density of impurities and structural defects [10]. In this study, both P3HT (donor) and dye (acceptor) in THF solution have a strong tendency of aggregation with increasing concentration, and this would affect significantly the PL quenching as a result of charge or energy transfers. In order to eliminate the potential PL quenching effect due to P3HT aggregation, pristine P3HT emission measurement versus concentration was carried out first to determine an optimal concentration range where PL quenching due to aggregates are minimum. Figure 2 revealed that the PL peak intensity (in units of counts per second or cps) of pristine P3HT (excited at 440 nm) increased dramatically over the concentration starting at 1.00 × 10⁻⁶ M and reached the highest at concentration of 1.00 × 10⁻⁴ M, then decreases toward a concentration of 1.00 × 10⁻³ M. The decrease could be attributed mainly to P3HT aggregations [11]. P3HT PL peak exhibited a steady increase in the concentrations below 1.00 × 10⁻⁴ M, where it is believed that P3HT chains were without aggregation. As a result, P3HT/THF (Tetrahydrofuran) in a concentration range of 5.00 × 10⁻⁶ M-4.00 × 10⁻⁵ M was selected in this study.
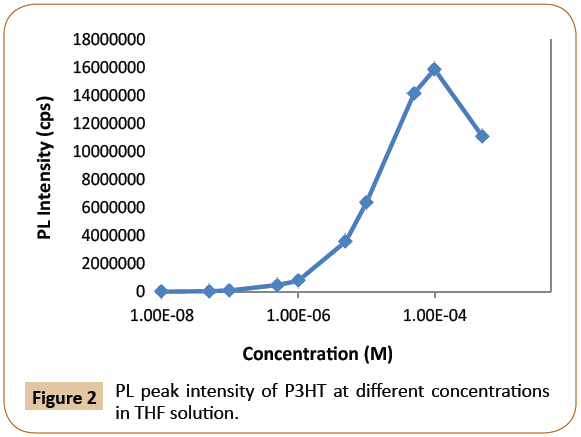
Figure 2: PL peak intensity of P3HT at different concentrations in THF solution.
Figures 3 and 4 exhibit PL quenching Stern-Volmer plots of P3HT/ TCPP pairs in THF, where the concentration of P3HT is fixed at 5.00 × 10⁻⁷M, Io represents the initial PL peak intensity of P3HT without the quencher, and I represents the PL peak intensity of P3HT with quencher TCPP at different concentrations. PL quenching of P3HT by TCPP exhibited a Stern-Volmer linear line below the TCPP concentration of about 5.00 × 10⁻⁵ M (Figure 4) and a non-linear curve in high concentrations beyond 5.00 × 10⁻⁵ M possibly due to P3HT aggregations (Figure 3). The concentration of acceptor dye between 1.25 × 10⁻⁷ M and 1.00 × 10⁻⁶ M was used for calculating PL quenching coefficients as aggregations can be neglected.
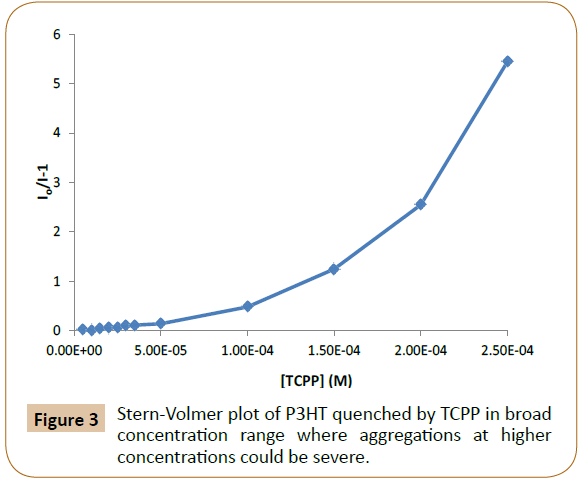
Figure 3: Stern-Volmer plot of P3HT quenched by TCPP in broad concentration range where aggregations at higher concentrations could be severe.
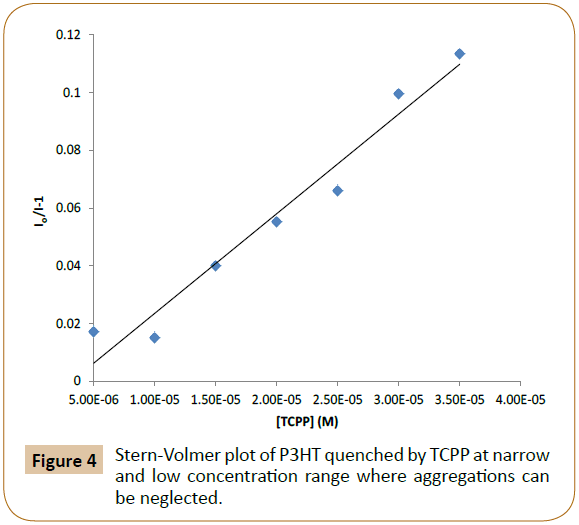
Figure 4: Stern-Volmer plot of P3HT quenched by TCPP at narrow and low concentration range where aggregations can be neglected.
Charge and energy transfer analysis
The UV-Vis absorption peak of P3HT in THF is at 450 nm, so 440 nm is used as excitation wavelength to excite P3HT. Figures 5 and 6 exhibited PL emission spectra (PL intensity as arbitrary units or au) of P3HT quenched by different concentrations of Proto and TCPP, respectively. The emission peaks of Proto at 620 nm (Figure 5, where P/P-8 means P3HT at 1.04 x 10⁻⁴M/Proto at 8th concentration) and TCPP at 720 nm (Figure 6, where P/T-8 means P3HT at 1.04 x 10⁻⁴M//TCPP at 8th concentration) were also observed, and this can be due to 440 nm excitation also exciting the acceptor dyes, and it can also be due to possible energy transfer from P3HT to the emissive dyes. In Figure 7, no emission peak of Hemin was observed possibly due to Hemin is not emissive and/or no energy transfer occurs, only charge transfer occurs as PL quenching was observed. The contributions of accepter PL emission peak increase due to acceptor concentration increase and due to energy transfer shall be analyzed respectively in following paragraphs.
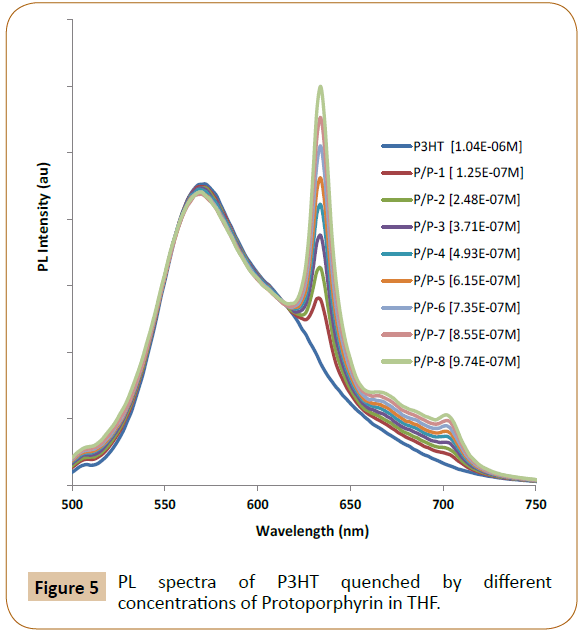
Figure 5: PL spectra of P3HT quenched by different concentrations of Protoporphyrin in THF.
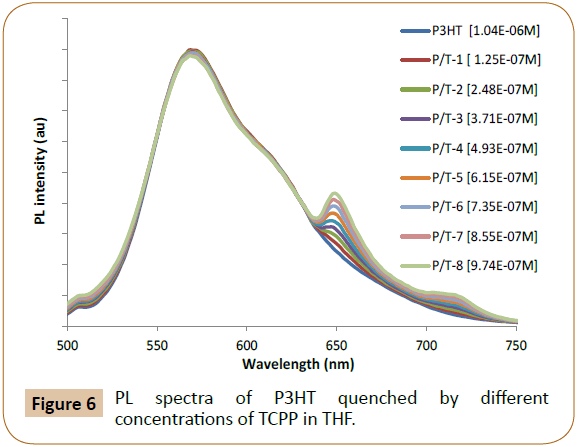
Figure 6: PL spectra of P3HT quenched by different concentrations of TCPP in THF.
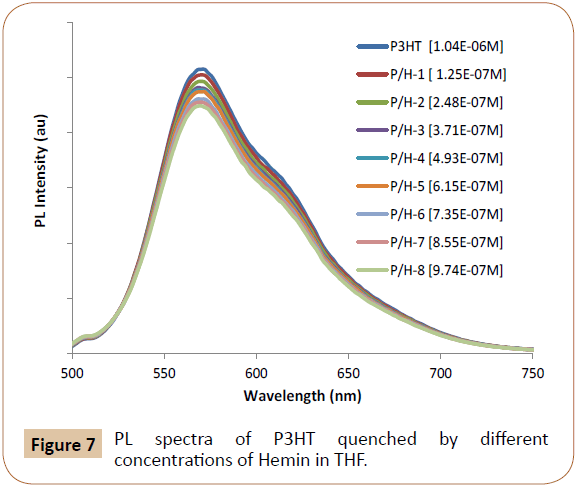
Figure 7: PL spectra of P3HT quenched by different concentrations of Hemin in THF.
Pristine acceptor Proto and TCPP dyes emission spectra at different concentrations were measured (shown in Figures 8 and 9) in order to deduct the dye concentration contributions toward their PL in actual intensities. When both donor and acceptor are PL emissive, under certain conditions or approximations, CT and ET contributions could be separated and quantified via concentration dependent PL spectra and eqn. (1) [12]. The CT and ET contribution calculation details of P3HT/Proto and P3HT/TCPP pairs using concentration dependent PL spectra and eqn. (1) are tabulated in Tables 1 and 2.
ΔPL(CT)=(ΔPL(D) +ΔPL(A) - ΔPL(AA))/2 (1)
Where,
ΔPL(CT)=PL change due to charge transfer (CT)
ΔPL(D)=Donor PL Peak Drop
ΔPL(AA)=Acceptor PL Peak change with pristine acceptor in solvent only
ΔPL(A)=Acceptor PL Peak change.
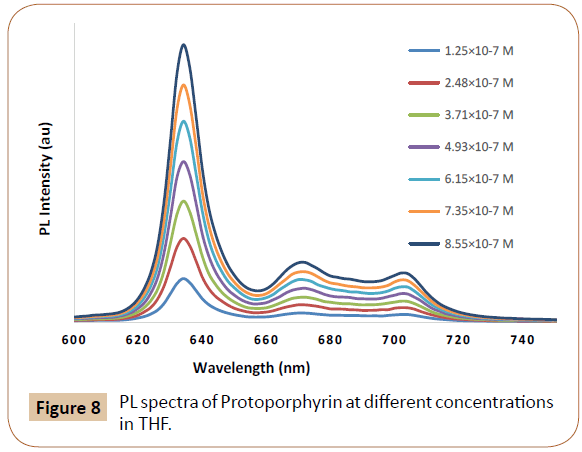
Figure 8: PL spectra of Protoporphyrin at different concentrations in THF.
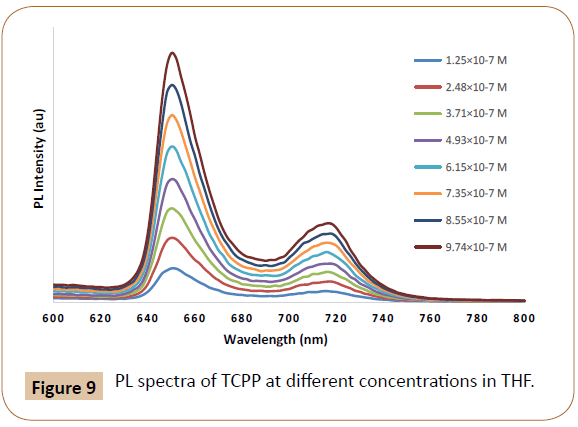
Figure 9: PL spectra of TCPP at different concentrations in THF.
Table 1: Calculation of ET % in P3HT PL quenched by Proto in THF.
| A Conc (10-7 M) |
D PL Peak with A (I, cps) at 570 nm |
A PL Peak with D (cps) |
D PL Peak Drop with A (ΔD) |
A PL Peak Change with D (ΔA) |
A PL Peak without D at 634 nm |
A PL Change due to Conc (ΔC) |
dC-dD |
CT=(ΔD-ΔA+ΔC)/2 (from Equation 1) |
D PL due to CT |
D PL (Io/I(CT))-1 |
ET=dD-CT |
ET, % |
| 1.25 |
897188 |
557980 |
0 |
0 |
102178 |
0 |
0 |
|
897188 |
0 |
0 |
/ |
| 2.48 |
892410 |
653765 |
4778 |
95785 |
196070 |
93893 |
89115 |
1443 |
895745 |
0.00161 |
3335 |
69.8 |
| 3.71 |
893103 |
751590 |
4085 |
193610 |
283393 |
181215 |
177130 |
-4155 |
901343 |
-0.00461 |
8240 |
/ |
| 4.93 |
887515 |
844085 |
9673 |
286105 |
375953 |
273775 |
264103 |
-1329 |
898516 |
-0.00148 |
11001 |
/ |
| 6.15 |
878158 |
924048 |
19030 |
366068 |
470445 |
368268 |
349238 |
10615 |
886573 |
0.01197 |
8415 |
44.2 |
| 7.35 |
875770 |
1019775 |
21418 |
461795 |
555463 |
453285 |
431868 |
6454 |
890734 |
0.00725 |
14964 |
69.9 |
| 8.55 |
874625 |
1105238 |
22563 |
547258 |
649728 |
547550 |
524988 |
11428 |
885760 |
0.01290 |
11135 |
49.4 |
Note: A: Proto; D: P3HT, 1.04 × 10⁻⁶ M. Excitation slits: 5 nm; Emission slits: 2 nm. Excitation wavelength: 440 nm
Table 2: Calculation of ET % in P3HT PL quenched by TCPP in THF.
| A Conc (10-7 M) |
D PL Peak with A (I, cps) at 570 nm |
A PL Peak with D (cps) |
D PL Peak Drop with A (ΔD) |
A PL Peak Change with D (ΔA) |
A PL Peak without D at 650 nm |
A PL Change due to Conc (ΔC) |
dC-dD |
CT=(ΔD-ΔA+ΔC)/2 (from Equation 1) |
D PL due to CT |
D PL (Io/I(CT))-1 |
ET=dD-CT |
ET, % |
| 1.25 |
896435 |
268015 |
0 |
0 |
25008 |
0 |
0 |
0 |
893455 |
0 |
0 |
/ |
| 2.48 |
893455 |
291510 |
2980 |
23495 |
47213 |
22205 |
19225 |
845 |
892610 |
0.00095 |
2135 |
71.6 |
| 3.71 |
891945 |
312938 |
4490 |
44923 |
68603 |
43595 |
39105 |
1581 |
891874 |
0.00177 |
2909 |
64.8 |
| 4.93 |
887845 |
335793 |
8590 |
67778 |
89823 |
64815 |
56225 |
2814 |
890641 |
0.00316 |
5776 |
67.2 |
| 6.15 |
889603 |
362678 |
6833 |
94663 |
113570 |
88563 |
81730 |
366 |
893089 |
0.00041 |
6466 |
94.6 |
| 7.35 |
886535 |
387390 |
9900 |
119375 |
136310 |
111303 |
101403 |
914 |
892541 |
0.00102 |
8986 |
90.8 |
| 8.55 |
878368 |
406643 |
18068 |
138628 |
158260 |
133253 |
115185 |
6346 |
887109 |
0.00715 |
11721 |
64.9 |
| 9.74 |
875918 |
429458 |
20518 |
161443 |
181553 |
156545 |
136028 |
7810 |
885645 |
0.00882 |
12708 |
61.9 |
Note: A: TCPP; D: P3HT, 1.04 × 10⁻⁶ M. Excitation slits: 5 nm; Emission slits: 2 nm; Excitation wavelength: 440 nm
The CT and ET calculation results from Tables 1 and 2 indicated that there were about 58% and 74% of energy transfers in the emission process of P3HT/Proto and P3HT/TCPP, respectively. Before deducting the energy transfer contribution, the Stern- Volmer quenching constants (Ksv) of P3HT/dye pairs were 3.92 × 10⁴ M-1 and 2.61 × 10⁴ M-1 for Proto and TCPP respectively (Figure 10). After deducting energy transfer (ET) contributions, the Ksv values were 1.69 × 10⁴ M-1 and 9.49 × 10³ M-1 corresponding to charge transfer (CT) from P3HT to Proto and TCPP (Figure 11).
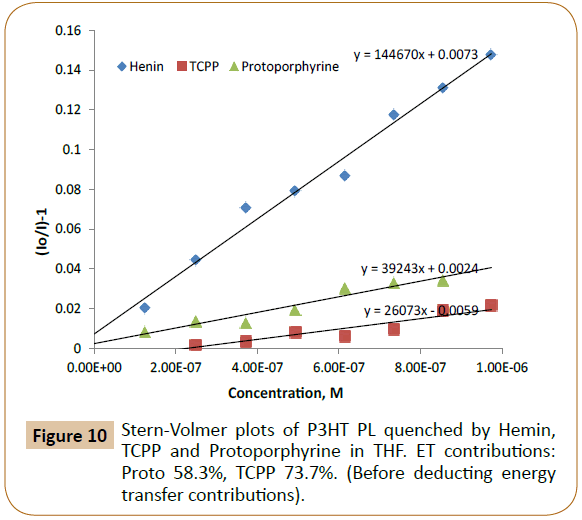
Figure 10: Stern-Volmer plots of P3HT PL quenched by Hemin, TCPP and Protoporphyrine in THF. ET contributions: Proto 58.3%, TCPP 73.7%. (Before deducting energy transfer contributions).
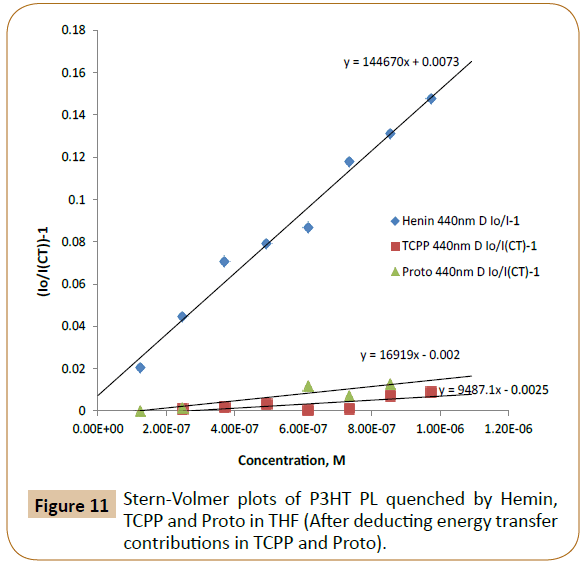
Figure 11: Stern-Volmer plots of P3HT PL quenched by Hemin, TCPP and Proto in THF (After deducting energy transfer contributions in TCPP and Proto).
Finally, solar cells using the three P3HT/dye pairs combined with a common acceptor, phenyl-C61-butyric acid methyl ester (PCBM) were also fabricated and tested as shown in Figures 12 and 13, where Figure 12 exhibits solar cell device fabrication scheme, and Figure 13 exhibits the photo JV curves of the solar cells, and solar cell device data are also tabulated in Table 3. The frontier orbital (HOMO/LUMO) levels of P3HT and the three dyes were measured using Cyclic Voltammetry (CV) method combined with UV-visible spectroscopy and the data are shown in Figure 12b and Table 4. The molar absorption coefficients (Abs-Coeff, or ɛ) of the three dyes were determined via UV-Vis. The molar absorption coefficients (Abs-Coeff), photoluminescence quenching constants (K-sv), lowest unoccupied molecular orbital offsets (d-LUMO), and fabricated solar cell power conversion efficiencies (η, or PCE) of the three P3HT/dyes (Proto, Hemin, and TCPP) are listed in Table 4, and normalized values are compared in Figure 14.
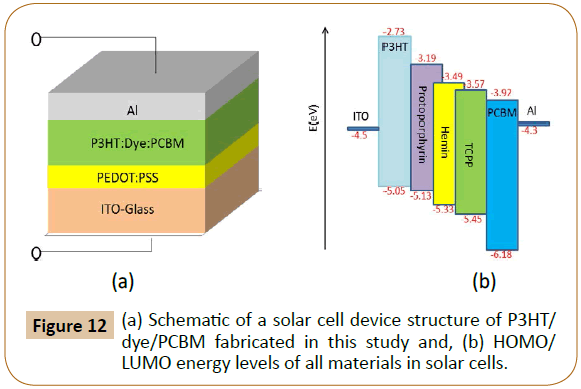
Figure 12: (a) Schematic of a solar cell device structure of P3HT/ dye/PCBM fabricated in this study and, (b) HOMO/ LUMO energy levels of all materials in solar cells.
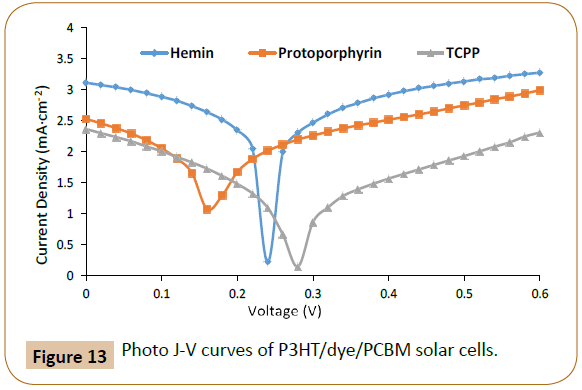
Figure 13: Photo J-V curves of P3HT/dye/PCBM solar cells.
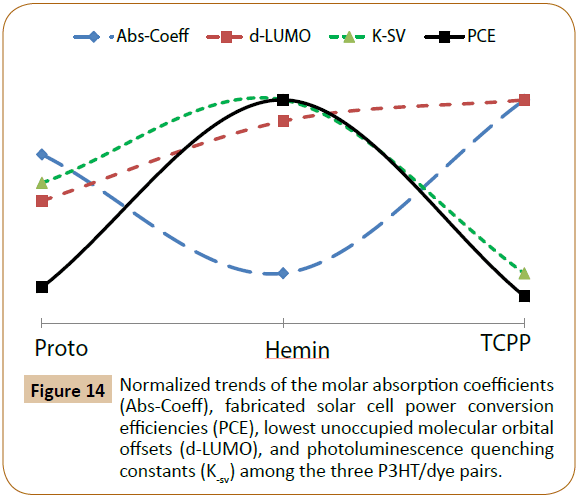
Figure 14: Normalized trends of the molar absorption coefficients (Abs-Coeff), fabricated solar cell power conversion efficiencies (PCE), lowest unoccupied molecular orbital offsets (d-LUMO), and photoluminescence quenching constants (K-sv) among the three P3HT/dye pairs.
Table 3: Performance of ITO/PEDOT:PSS/P3HT:dye:PCBM/Al bulk heterojunction photovoltaic devices under a AM 1.5G one Sun solar simulator.
| Dyess |
Jsc (mA/cm2) |
Voc (V) |
FF (%) |
η (%, un-calibrated) |
| Proto |
1.07141 |
0.16 |
22.615 |
0.038 |
| Hemin |
4.1 |
0.24 |
25.624 |
0.25 |
| TCPP |
0.73412 |
0.28 |
15.723 |
0.033 |
Table 4: Electronic and optoelectronic properties of P3HT and three dyes.
| |
P3HT |
Proto |
Hemin |
TCPP |
| HOMO (eV, from CV peak onset) |
-5.05 |
-5.13 |
-5.33 |
-5.45 |
| LUMO (eV, from CV peak onset) |
-2.73 |
-3.19 |
-3.49 |
-3.57 |
| Eg (eV) |
2.32 |
1.94 |
1.84 |
1.88 |
| Absorption coefficient, M-1cm-1 |
1.07 × 10⁴ |
1.39 × 10⁵ |
6.71 × 10⁴ |
4.00 × 10⁵ |
| d-LUMO (P3HT/Dye), eV |
|
0.46 |
0.76 |
0.84 |
| Ksv (P3HT/Dye, CT contribution) |
|
1.69 × 10⁴ |
1.45 × 10⁵ |
9.49 × 10³ |
| η or PCE (P3HT/Dye/PCBM) |
|
0.038 |
0.25 |
0.033 |
As shown in Figure 14, when the ΔLUMO values (correlating to photo induced electron transfer driving forces from P3HT to dyes) of P3HT/dye pairs increase from 0.46 to 0.76 to 0.84 eV (from Proto to Hemin to TCPP), respectively, the PL quenching (Ksv) as well as the solar cell efficiencies (η) initially increases from Proto to Hemin, and then decreases for TCPP. For these three P3HT/dye pairs, this research indicated that the photo generated excitons appear to dissociate most efficiently at an intermediate ΔLUMO value. This observation could be a strong evidence for the Marcus electron transfer model regarding ‘inverted region’ theory, and also confirms an earlier theoretical prediction regarding exciton dissociation efficiency versus ΔLUMO [13-17]. As a matter of fact, a time resolved microwave conductivity (TRMC) studies on a series of polymer/fullerene thin film OE devices also observed an optimum driving force corresponding to highest photo induced microwave conductivity [18].
Conclusion
Photo induced charge transfer (CT) and energy transfer (ET) could occur simultaneously in a molecular donor/acceptor weakly electronically coupled pair. If both donor and acceptor are PL emissive, under certain conditions and approximations, CT and ET contributions may be separated and quantified via concentration dependent PL spectra. The experimental results from this study also revealed that the optoelectronic conversion efficiencies for the three P3HT/dye pairs are affected more critically by the polymer/dye PL quenching than the dye optical absorption coefficients, and that the correlation between the optoelectronic conversion efficiencies or PL quenching versus LUMO offsets of P3HT/dye pairs appear to follow Marcus electron transfer model involving an ‘inverted region’. For future studies or better illustrations, more dyes of different frontier orbitals and with more similar molecular structures are more desirable. The results of such studies could guide the design and development of next generation high-efficiency organic optoelectronic devices, such as, solar cells and photodetectors.
Acknowledgement
This material is based upon work supported, in part, by research and educational grant awards from a number of sponsors including the Department of Defense (ARO Award #W911NF-15-1-0422), and the National Science Foundation (NSF Awards # HRD- 1036494 and HRD-1547771).
Author Contributions
Sam-Shajing Sun contributed concept/idea and Dan Wang contributed all experimental data of this work.
Conflicts of Interest
The authors declare no conflict of interest.
References
- You F, Bos AJ, Shi Q, Huang S, Dorenbos P (2011) Electron transfer process between Ce3+ donor and Yb3+ acceptor levels in the bandgap of Y3Al5O12 (YAG). J Phys: Condens Matter 23: 215502.
- Powell RC (1998) Physics of solid-state laser materials. Springer Science and Business Media 1.
- Dorenbos P, Bos AJJ, Poolton NRJ (2010) Carrier recombination processes and divalent lanthanide spectroscopy in YPO 4: Ce 3+; L3+ (L=Sm, Dy, Tm). Phys Rev B 82: 195127.
- Sontakke AD, Ueda J, Katayama Y, Dorenbos P, Tanabe S (2015) Experimental insights on the electron transfer and energy transfer processes between Ce3+-Yb3+ and Ce3+-Tb3+ in borate glass. Appl Phys Lett 106: 131906.
- Abramavicius D, Mukamel S (2010) Energy-transfer and charge-separation pathways in the reaction center of photosystem II revealed by coherent two-dimensional optical spectroscopy. J Chem Phys 133: 11B605.
- Chen KY, Hsieh CC, Cheng YM, Lai CH, Chou PT, et al. (2006) Tuning excited-state electron transfer from an adiabatic to nonadiabatic type in donor−bridge−acceptor systems and the associated energy-transfer process. J Phys Chem A 110: 12136-12144.
- Kandada ARS, Grancini G, Petrozza A, Perissinotto S, Fazzi D, et al. (2013) Ultrafast energy transfer in ultrathin organic donor/acceptor blend. Sci Rep 3: 2073.
- https://fitzkee.chemistry.msstate.edu/sites/default/files/ch8990/Fluoro6.pdf
- Nguyen TH, Hasib M, Wang D, Sun SS (2016) Design, synthesis, characterizations, and processing of a novel c-donor-nc-bridge-cf-acceptor type block copolymer for optoelecronic applications. J Res Updates Polym Sci 5: 18-38.
- Bredas JL, Beljonne D, Coropceanu V, Cornil J (2004) Charge-transfer and energy-transfer processes in π-conjugated oligomers and polymers: a molecular picture. Chem Rev 104: 4971-5004.
- Panzer F, Sommer M, Bassler H, Thelakkat M, Kohler A (2015) Spectroscopic signature of two distinct H-aggregate species in poly (3-hexylthiophene). Macromol 48: 1543-1553.
- Sun SS (2016) Basic electronic structures and charge carrier generation in organic optoelectronic materials. Introduction to Organic Electronic and Optoelectronic Materials and Devices. (2ndEd), CRC Press/Taylor and Francis: Boca Raton, USA.
- Sun SS (2005) Optimum energy levels and offsets for organic donor/acceptor binary photovoltaic materials and solar cells. Mater Sci Eng B 116: 251-256.
- Marcus RA (1957) On the theory of oxidation reduction reactions involving electron transfer. Applications to Data on the Rates of Isotopic Exchange Reactions. J Chem Phys 26: 867-871.
- Miller JR, Calcaterra LT, Closs GL (1984) Intramolecular long-distance electron transfer in radical anions. The effects of free energy and solvent on the reaction rates. J Am Chem Soc 106: 3047-3049.
- Sun SS, Wang D (2015) Polymer light harvesting composites for optoelectronic applications. Proc. SPIE 9616, Nanophotonics and Macrophotonics for Space Environments IX 9616: 96160O.
- Sun SS, Wang D (2015) Happy medium appears best for polymer/dye optoelectronics. Optoelectronics and Communications, SPIE Newsroom.
- Coffey DC, Larson BW, Hains AW, Whitaker JB, Kopidakis N, et al. (2012) An optimal driving force for converting excitons into free carriers in excitonic solar cells. J Phys Chem C 116: 8916-8923.