Key words
clinical indicators, general practice, guidelines, pay-for-performance, primary care
Introduction
The Quality and Outcomes Framework (QOF) is a pay-for-performance (incentive) scheme that covers a wide range of clinical and organisational areas in primary care.[1] It was introduced as part of the new General Medical Services (GMS) contract for family doctors in the United Kingdom (UK) in 2004.[2]
The QOF contains groups of indicators against which general practices score points (maximum 1000) – and receive financial rewards – according to how well they perform. The final payment is adjusted to take account of surgery workload and the relative health of patients in their area. The clinical areas of the QOF (clinical domains) account for the majority of points (70%) and cover many of the main disease areas diagnosed and managed in primary care. When the QOF was introduced in 2004 there were 10 clinical domains (coronary heart disease, stroke, cancer, hypothyroidism, diabetes, hypertension, mental health, asthma, chronic obstructive pulmonary disease, epilepsy). [3] In 2006, a major revision to QOF saw the introduction of seven new clinical domains (depression, atrial fibrillation, chronic kidney disease, dementia, obesity, palliative care and learning disability).[4] A further revision in 2009 saw the addition of primary prevention of cardiovascular disease (CVD).5 Following introduction of the QOF as part of the new GMS contract in 2004, clinical indicator development was managed using an Expert Panel process (2005–2009). This process has been described in detail elsewhere6 and involved combining available research evidence with expert opinion using formal consensus methods to develop indicators in areas where evidence was limited or inconsistent. The indicators were not, however, piloted or routinely consulted on with stakeholders prior to their consideration by the QOF negotiators.
In April 2009, the Department of Health appointed the National Institute for Health and Clinical Excellence (NICE) to manage a new process for developing QOF indicators. It stated that ‘we consider that NICE has been a highly effective organisation in delivering a range of clinical and public health guidance and standards, including for primary care, and is by far the best placed organisation to manage the independent process of prioritisation, consultation and appraisal of clinical effectiveness and cost effectiveness [of the new QOF]’, (p. 6).[7] The NICE process has a number of significant changes that should lead to the QOF acting as a vehicle for quality improvement and deliver more rigorously developed QOF indicators. First, NICE is an independent body which works in a transparent manner so it should be clear to all stakeholders why certain clinical areas have been prioritised for development asQOFindicators. Crucial to this has been the setting up of an independent NICE QOF Advisory Committee. Second, cost-effectiveness as well as clinical effectiveness is taken into consideration when developing QOF indicators. Third, QOF indicators developed through the existing consensus process are now piloted in a representative sample of UK general practices. Fourth, there is an expectation that the QOF will continue to develop and existing indicators will be retired and new indicators introduced when certain criteria are met.
The NICE-managed QOF process
Overview
NICE’s role is to manage the process of developing clinical and health improvement indicators for the QOF and review the current QOF indicator set.[8] Key aspects of this process are to ensure consultation with individuals and stakeholder groups; to publish an annual ‘menu’ of new, evidence-based indicators and make recommendations about existing indicators, including those which should be retired. It is important to emphasise that NICE does not decide which indicators are to be included in the QOF. This will continue to be negotiated by NHS Employers on behalf of the UK Health Departments and the British Medical Association (BMA) General Practitioners’ Committee (GPC).
NICE has established its national and international reputation through the quality of its guidance products (Technology Appraisals, Clinical Guidelines, Public Health and Interventional Procedures Guidance). These are all developed by independent advisory bodies. The NICE-managed QOF also adopts this approach. The independent Primary CareQOF Indicator Advisory Committee (AC) is chaired by an experienced general practitioner (GP), has 30 members drawn from the four UK nations, and includes GPs and other primary care health professionals, patients and carers, commissioners, pharmacists and public health specialists. Thecommittee usually meets at least twice a year (June and December) and committee meeting agendas and minutes are published on the NICE website. The core tasks of the committee are to prioritise suggestions for new clinical or public health topics; make recommendations for indicator development; consider the outcome of piloting and consultation and make final indicator recommendations. The committee also reviews existing indicators in the QOF – this includes recommending whether any should be retired, considered for changes to points and/or thresholds, or be subject to further assessment.
There are a number of key organisationswho closely work with NICE to develop and pilot new QOF indicators and also to review the existing QOF indicator set. NICE has commissioned the NICE External Contractor (NEC: the Primary Care Group in the School of Health and Population Sciences at the University of Birmingham in collaboration with the York Health Economics Consortium – YHEC) to develop and pilot indicators on clinical or public health topics recommended by the AC. Another important partner is the NHS Information Centre.
Process of developing new QOF indicators
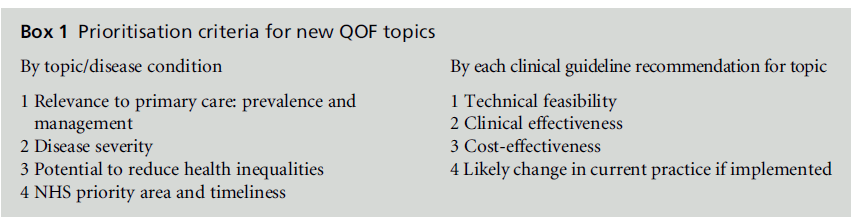
The NICE managed QOF process (Figure 1) has the advantages of being both rigorous and transparent. It has utilised (between 2009 and 2011) a twice yearly online topic suggestion facility on the NICE website to allow stakeholder organisations and individuals to suggest clinical and public health topics for consideration for potentialQOF indicator development. These suggestions are then mapped by NICE against available NHS Evidence accredited sources – chiefly clinical guideline recommendations for primary care developed by NICE for England and Wales and Northern Ireland and by the Scottish Intercollegiate Guidelines Network (SIGN) for Scotland. NICE and SIGN guidelines are recognised internationally as being of high quality – they have rigorous development methods and consider clinical and cost-effectiveness. The relevant clinical guideline recommendations and their accompanying evidence are then assessed against the Department of Health’s prioritisation framework for new QOF indicator topics. The QOF AC then assesses these topics and recommends which should progress for indicator development against specific prioritisation criteria (Box 1).
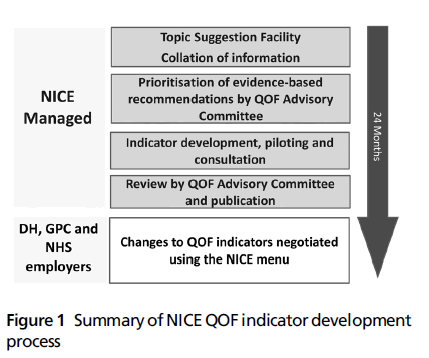
Figure 1: Summary of NICEQOF indicator development process
Those recommendations which are prioritised for QOF indicator development by the committee are then put through a formal indicator development process by the NEC; this has two elements.[9] First, formal consensus methods are used to reword the recommendations into indicators that are likely to be valid and can be extracted from GP clinical systems. Second, these indicators are then piloted in 30 representative practices across England and in a smaller number of practices in Wales, Scotland and Northern Ireland. During piloting, the indicators are tested for feasibility and reliability of data extraction across all major GP clinical systems. Data on workload, baseline and six-month achievement are used to inform the cost-effectiveness analysis of each indicator. Qualitative interviews are also undertaken with general practice staff to determine if the indicators are acceptable to end users, to seek out unintended consequences and problems with implementation.[10,11] In addition, NICE consults with stakeholders on the piloted indicators to allow them to comment on whether there are any barriers to implementation, potential unintended consequences and whether implementation of the indicators may impact adversely or positively on different groups in the community. Both the results of piloting, including the cost-effectiveness analysis of pilot indicators and consultation comments are reviewed by the QOF AC which then recommends which indicators should be approved for publication by NICE in its annual menu of indicators. These indicators are then considered by the negotiators for consideration for inclusion in the following year’s QOF.
Review and retirement of existing QOF indicators
The QOF AC also has the important role of reviewing the existing QOF indicator set both in terms of any new research evidence that may mean they have to be altered or withdrawn and also in terms ofwhether they meet criteria for retirement (for example, indicators can be considered for retirement if they have stable and high levels of achievement).[12] Retirement of existing indicators frees up QOF points so that new indicators can be introduced.
Experience to date (2009–2011)
Overall, the NICE QOF process has been successful in developing new clinical indicators. The QOF AC has now met eight times and a total of 42 potential QOF indicators have been developed using the new process for consideration by the QOF AC. Of these 42 indicators, 29 (69%) were recommended by the AC to go on the NICE menu for consideration by the QOF negotiators. Of these 29 indicators, 22 (76%) have been negotiated intoQOFin 2011–2012 (9) and 2012– 2013(13). The new process, however, does take a considerable time to develop new QOF indicators. For example, recommendations for indicator development made by the AC in June 2010 will not provide new QOF indicators until April 2013. Four stages of the NICE processmerit further exploration in this review: prioritisation of clinical guideline recommendations by the AC, development and piloting of quality indicators, cost-effectiveness analysis and retirement of indicators. Tables 1 and 2 present the development of two sets of potential QOF indicators developed using the new process: statin use in people with hypertension at high risk of CVD and obesity (www.nice.org. uk/media/718/34/QOF_Independent_Primary_Care_ QOF_Indicator_Advisory_Committee_090611_ unconfirmed_minutes).
Prioritisation of clinical guideline recommendations by the QOF AC
The decision to base QOF indicators explicitly on clinical guideline recommendations means that QOF indicators can be considered guideline-driven indicators. NICE clinical guideline recommendations constitute the large majority of recommendations considered (92%, 141/154) with SIGN clinical guidelines providing the remainder (8%, 13/154). A key advantage of this approach is that the evidence of clinical and cost-effectiveness underpinning the recommendation presented in the clinical guideline can be assessed against the Department of Health prioritisation framework and presented to the QOF AC. Clinical guideline recommendations, however, are conceptually different from quality indicators,[13] being ‘systematically developed statements to assist practitioners and patient decisions about appropriate health care for specific clinical circumstances’[14] and are often not easily measurable as worded. Only a minority of clinical guideline recommendations in topic areas relevant to primary care have been progressed for QOF indicator development (32%, 49/154), with the majority either not progressed (63%, 97/154) or flagged up for further review (5%, 8/154). The three most common reasons for non-progression of clinical guideline rec recommendations against the Department of Health criteria were lack of technical feasibility (38%, 49/129), insufficient evidence of clinical effectiveness for consideration as a QOF indicator (25%, 33/129) and consideration that the recommendations were already established in clinical practice and therefore not suitable for inclusion in a quality improvement programme (9%, 12/129). Technical feasibility covers a number of different aspects, but one of its most important components is that it should be possible to construct a disease or condition register that is both valid and reliable so as to allow accurate measurement of an indicator’s numerator and denominator. Clinical guideline recommendations that relate to a condition that may be diagnosed differently according to individual clinician’s clinical judgement (e.g. irritable bowel syndrome, sore throat, acute cough) will have difficulty in meeting this criterion and will therefore fall at this first hurdle. It is notable that the majority of progressed clinical guideline recommendations relate to disease areas that are already in QOF and therefore have an existing disease register (80%, 37/46). Of the four main new disease groups for which clinical guideline recommendations have been considered (musculoskeletal, lower urinary tract symptoms, skin and gastrointestinal conditions), recommendations have been progressed in only one area (musculoskeletal: fragility fractures/osteoporosis and rheumatoid arthritis/osteoarthritis).
Development and piloting of quality indicators
The prioritised clinical guideline recommendations are further developed by clinical experts and service GPs, using formal consensus methods (modified RAND appropriateness method), into draft indicators.9 The indicator wording is formally assessed in terms of clarity (unambiguous), necessity (must record aspect of care in the medical record) and feasibility. The progressed indicators have high face and content validity. These indicators are then subjected to piloting in a representative cross-section of practices to further assess feasibility and validity, but also to assess reliability of data extraction, their acceptability to practices and whether there are any unintended consequences. Piloting was first proposed forQOFin 2007[15] and is an important addition to QOF indicator development under the NICE process. The results of piloting, together with the results of public consultation with stakeholders, are presented to the QOF AC. To date, both piloting and consultation have yielded important information which has had a significant bearing on whether the AC considers the indicators should be recommended for consideration by the negotiators for inclusion in QOF. In the case of indicators on the use of statins for people with hypertension at high risk of CVD, piloting found that the indicator was acceptable to GPs, was implementable and thus was recommended by the AC to go onto the NICE menu of indicators (Table 1). In contrast, indicators on weight management in people who are obese were unacceptable to a proportion of practices and major implementability issues were identified (Table 2). These indicators were not recommended by the AC to go on the NICE menu.
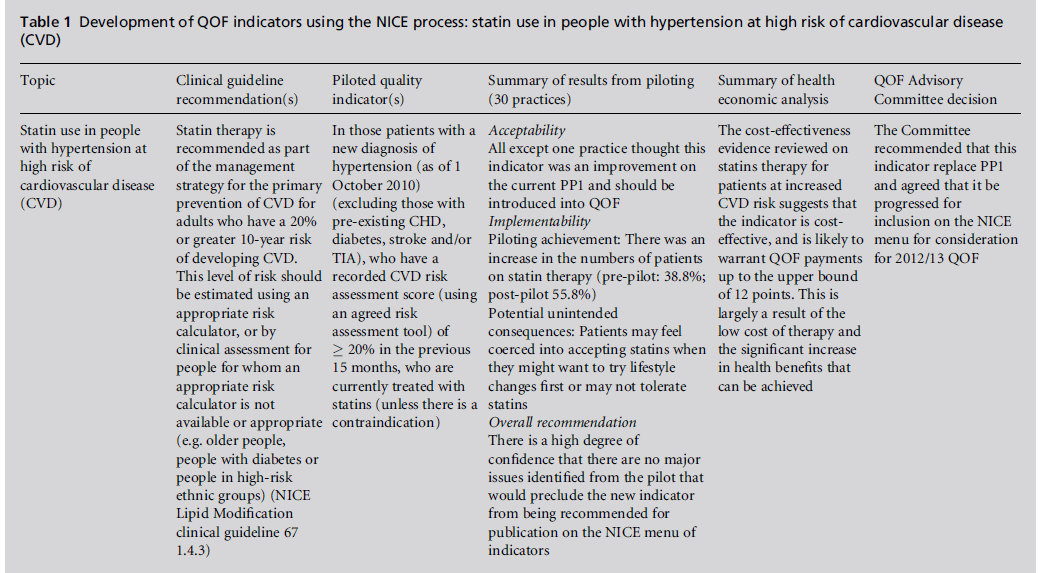
Table 1 :Development of QOF indicators using the NICE process: statin use in people with hypertension at high risk of cardiovascular disease (CVD).
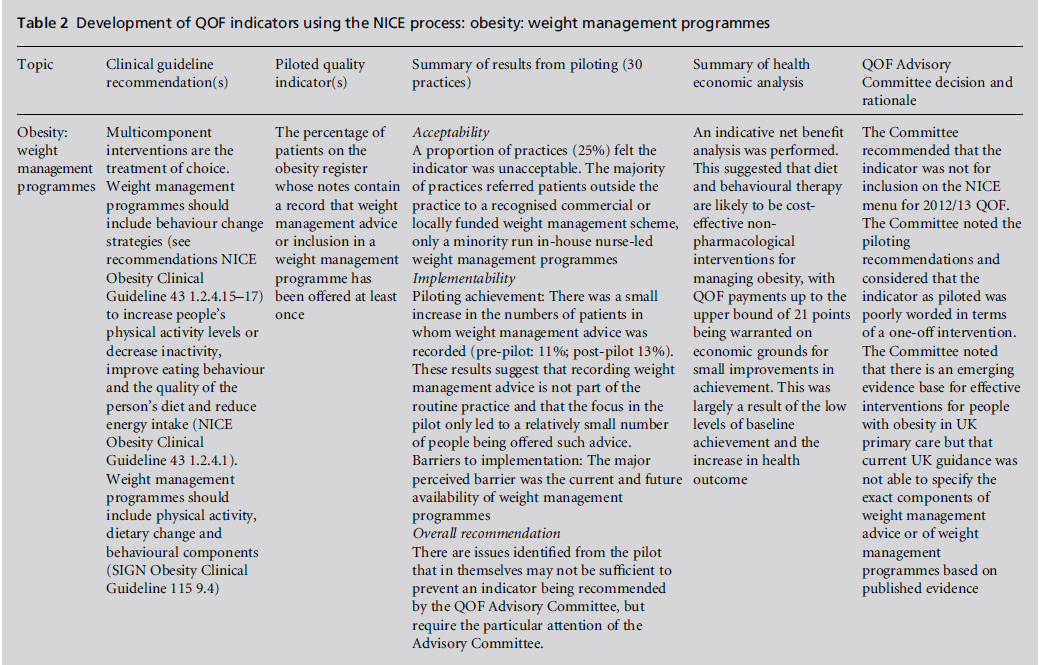
Table 2:Development of QOF indicators using the NICE process: obesity: weight management programmes.
Cost-effectiveness analysis
A key requirement of the new process is that new indicators should be based, as far as possible, on evidence of cost-effectiveness. A net benefit approach is used and an indicator can be considered cost effective when net benefit is greater than zero.
net benefit = monetised benefit – delivery cost – QOF payment
The delivery cost of undertaking the indicator is the cost to deliver the treatment and/or intervention, offset by any savings where new treatments replace older treatments. The monetised benefit from implementing the indicator is derived from expected increase in quality-adjusted life year (QALY) at a cost of £25 000 per QALY. This is based on the midpoint of the range £20 000–£30 000, below which NICE considers an intervention to be cost-effective.[8,16] An alternative approach called threshold analysis is used when the evidence base does not lend itself to net benefit analysis. For example, where the costs of delivering an indicator are known or can be easily estimated, but the effectiveness is unknown, it is possible to identify what level of effectiveness would be necessary for an indicator to be considered costeffective, in terms of QALYs. The QOF payment is considered to be additional to the cost of delivering the indicator; it is regarded for the purposes of costeffectiveness as an incentive to embed within general practice best evidence-based care that will continue to improve patients’ care and health. The use of net benefit analysis or threshold analysis allows the negotiators to be given an indication of how many QOF points it is likely to be cost-effective to allocate to an indicator on the NICE menu. For example, the use of statins for people with hypertension at high risk of CVD would be likely to warrant QOF payments up to the upper bound of 12 points (Table 1). It needs to be emphasised that the monetised benefit is highly sensitive to the baseline uptake of an intervention and the expected increase that would ensue following incentivisation as a QOF indicator (both of these are calculated as part of piloting). Indicators that are currently established clinical practice are likely to have a high baseline with limited potential for further increase in uptake following incentivisation as a QOF indicator. In such cases it is likely that the indicator will not be cost-effective as the net benefit is likely to be less than zero.
Retirement of indicators
A core aim of the NICE-led QOF process is to ensure that it leads to continuous quality improvement, and a key aspect of this is ensuring that indicators are considered for indicator retirement. The retirement of those indicators that are considered to be established clinical practice will allow the QOF to evolve and to incorporate new indicators and new disease areas, although care needs to be taken to ensure removal does not inadvertently lead to an overall decrease in performance.[17] At present, there is no routine monitoring of what happens to a QOF indicator when it is retired in terms of its subsequent achievement. The AC therefore recommends indicators to be considered for retirement from the QOF based on the following criteria: an analysis of the indicator based on achievement levels, exception reporting and trend over time (candidates for retirement should have stable high achievement rates and low exception reporting); the cost-effectiveness of an indicator (where data are available); a change in the evidence base; an assessment of the extent to which a process indicator is linked to an outcome and an assessment of the extent to which an indicator represents a marker of quality or is a standard requirement.[18] Twenty-two QOF indicators have been recommended for retirement by the AC, of which just under half (45%, 10/22) have been retired from QOF by the negotiators. Just under half (45%, 10/22) of the indicators recommended for retirement not only have stable high achievement rates and low exception reporting, but they are also ‘paired’ indicators, where they relate to a healthcare process that will still be required to occur for another QOF indicator following any retirement of the indicator. The risk of unintended consequences following their retirement, such as not carrying out the activity in future, is thus low. For example, the retirement of QOFindicatorCHD5 (the percentage of patients with coronary heart disease whose notes have a record of blood pressure in the previous 15 months) still means that blood pressure has to be recorded as the intermediate outcome indicator CHD 6 (the percentage of patients with coronary heart disease in whom the last blood pressure reading, measured in the previous 15 months, is 150/90 mmHg or less) remains.
NICE and the QOF: recent developments
The UK coalition government has signalled its intent to make the NHS more outcomes focused with the setting up of the NHS Outcomes Framework. This will set national health outcome goals and will span the three domains of healthcare quality: effectiveness of treatment and care, patient experience and patient safety. These national outcome goals will, in turn, inform a Commissioning Outcomes Framework (COF) for clinical commissioning groups to create powerful incentives for effective commissioning.[19] It is intended that NICE will have a key role in supporting this change through the publication of Quality Standards[20] which will set out high-quality care for given clinical conditions. It is likely that these changes will lead to interest as to whether it is possible to develop more health outcome indicators for QOF. At present, the QOF has one true outcome-based indicator (Epilepsy 8, which refers to seizure frequency). There is, however, an emphasis on improving quality of care through the use of intermediate outcome measures (e.g. hypertension, cholesterol and HbA1c targets), and through process measures directly linked to outcomes (e.g. indicators that incentivise drug therapy). These three groups together account for just under a third of QOF clinical indicators (27 of 86 indicators, 31%) and a larger proportion of QOF clinical domain points (289 of 697 available points, 41%).[21] Given the difficulties in attributing health outcomes such as mortality and morbidity as a measure of the quality of health care,[22] it will be necessary to continue to use process measures that meet agreed criteria in terms of their ability to lead to improved health outcomes.23 At the time of writing, the NHS Bill, which sets out the NHS Outcomes Framework, has yet to be passed into law. If this does happen then one can anticipate the development and piloting of more QOF indicators using the NICE process that measure health outcomes or process measures that are directly linked to health outcomes.
Peer Review
Commissioned, not externally peer reviewed.
Conflicts of Interest
TS and DS are employees of NICE which is funded by the Department of Health to develop QOF indicators for publication on the NICE menu of indicators. HL and JH lead the external contractor to NICE, which includes developing and piloting new indicators for the QOF.
References
- NHS Employers and the General Practitioners Committee BMA. Quality and Outcomes Framework Guidance for GMS Contract 2011/12. London: BMA and NHS Employers, 2011. www.nhsemployers.org/Site CollectionDocuments/QOFguidanceGMScontract_ 2011_12_FL%2013042011.pdf
- Roland M. Linking physicians’ pay to the quality of care – a major experiment in the United Kingdom. New England Journal of Medicine 2004;351:1448–54.
- Department of Health. Investing in General Practice the New General Medical Services Contract. London: Department of Health, 2003. www.nhsemployers.org/Site CollectionDocuments/gms_contract_cd_130209.pdf
- NHS Employers and the General Practitioners Committee BMA. Revisions to the GMS Contract 2006/07. London: BMA and NHS Employers, 2006. www.nhs employers.org/SiteCollectionDocuments/Revisions_to_ the_GMS_contract_-_full_CD_120209.pdf
- NHS Employers and the General Practitioners Committee BMA. Quality and Outcomes Framework Guidance for GMS Contract 2009/10. London: BMA and NHS Employers, 2009. www.nhsemployers.org/Aboutus/ Publications/Documents/ QOF_Guidance_2009_final.pdf
- Lester H and Campbell S. Developing Quality and Outcomes Framework (QOF) indicators and the concept of ‘QOFability’. Quality in Primary Care 2010; 18:103–9.
- Department of Health. Developing the Quality and Outcomes Framework: consultation response and analysis. Leeds: Department of Health, 2009. www.dh.gov.uk/ prod_consum_dh/groups/dh_digitalassets/documents/ digitalasset/dh_097128.pdf
- National Institute for Health and Clinical Excellence (NICE). Developing Clinical and Health Improvement Indicators for the Quality and Outcomes Framework (QOF). Interim Process Guide. Manchester: NICE, 2009. www.nice.org.uk/media/742/32/QOFProcessGuide. pdf
- Campbell SM, Kontopantelis E, Hannon K, Burke M, Barber A and Lester HE. Framework and indicator testing protocol for developing and piloting quality indicators for the UK Quality and Outcomes Framework. BMC Family Practice 2011;12:85.
- Hannon K, Campbell SM and Lester HE. Recording patient preferences for end-of-life care as an incentivised quality indicator: what do general practice staff think? Palliative Medicine 2011; doi: 10.1177/ 0269216311406990.
- Lester HE, Campbell SM and Hannon K. Identifying unintended consequences of quality indicators: a qualitative study. BMJ Quality and Safety in Health Care 2011; doi10.1136/bmjqs.2010.048371.
- Reeves D, Doran T, Valderas J et al. Updating clinical performance frameworks: developing a rationale for removing indicators. British Medical Journal 2010; 340:c1717.
- Campbell SM, Braspenning J, Hutchinson A and Marshall M. Research methods used in developing and applying quality indicators in primary care. Quality and Safety in Health Care 2002;11:358–64.
- Field MJ and Lohr KN (eds). Guidelines for Clinical Practice: from development to use. Washington, DC: National Academy Press, 1992.
- Lester HE and Roland M. The future of quality measurement. British Medical Journal 2007;335:1130–1.
- National Institute for Health and Clinical Excellence (NICE). Guide to the Methods of Technology Appraisal. London: NICE, 2008. www.nice.org.uk/aboutnice/how wework/devnicetech/guidetothemethodsoftechnologyappraisal.jsp
- Lester HE, Schmittdiel J, Selby J et al. The impact of removing financial incentives from clinical quality inNICE and the Quality and Outcomes Framework 2009–2011 55 dicators: longitudinal analysis of four Kaiser Permanente indicators. British Medical Journal 2010; 340:c1898.
- National Institute for Health and Clinical Excellence (NICE). Primary Care QOF Indicator Advisory Committee Position Statements. Manchester: NICE, 2010. www.nice.org.uk/media/658/C6/Position_Statements. pdf
- Department of Health. Equity and Excellence: liberating the NHS. London: Department of Health, 2010 (Cm 7881). www.dh.gov.uk/en/Publicationsandstatistics/ Publications/PublicationsPolicyAndGuidance/ DH_117353
- National Institute for Health and Clinical Excellence (NICE). Developing NICE Quality Standards Interim Process Guide. Manchester: NICE, 2010. www.nice.org. uk/media/6F6/2B/DevelopingNICEQualityStandards InterimProcessGuide.pdf
- NHS Information Centre. Quality and Outcomes Framework Achievement Data 2009/10. Leeds: NHS IC, 2010. www.ic.nhs.uk/webfiles/QOF/2009–10/QOF_ Achievement_Prevalence_Bulletin_2009–10_v1.0.pdf
- Mant J. Process versus outcome indicators in the assessment of quality of health care. International Journal for Quality in Health Care 2001;13:475–80.
- Chassin MR, Loeb JH, Schmaltz SP and Wachter RM. Accountability measures – using measurement to promote quality improvement. New England Journal of Medicine 2010;363:683–8.

