Keywords
Diabetes; Erectile dysfunction; MPV; MCH; Neuropathy; Testosterone
Introduction
Erectile dysfunction (ED) is a difficulty in achieving and maintaining adequate erection for a satisfactory sexual performance and the stability of this condition more than 25% of sexual attempts [1]. It is the most common problem, affecting 80 to 85% of the patients seeking medical help for sexual dysfunction and its prevalence is expected to reach 322 million people worldwide in 2025 [2]. It occurs due to the complicated interaction between neural, vascular, endocrine, medical and pharmacological factors [3]. Most of these causes affect the intrapenile vasculogenic mechanisms, whether arterial or venous. A common finding is a decrease in local nitric oxide, which is considered as the main neurotransmitter involved in initiation of erection. Fibrosis may also be present within the corpora cavernosa, which limits their expandability, prevents the venules from compressing against the tunica albuginea, and thereby allows venous leakage from the penis [4]. There is an increasing evidence identifying ED as an early finding for atherosclerotic cardiovascular disease and its associated stroke and mortality [1,5].
Materials
The study was approved by the Research and Ethics Committee of King Fahd Hospital, Asir Province, Saudi Arabia and informed consent was obtained from each participant. Ninety-one male type 2 diabetic patients were recruited from the out-patient endocrinology clinics from January to June, 2018. Patients were excluded if they had been hospitalized for acute illness such as infection or inflammation within the recent month and if they were already receiving testosterone replacement therapy or medication that can affect the blood test results such as iron therapy. Cardiovascular and peripheral arterial disease, kidney disease, thyroid or other endocrine disorder, smoking and anemia were also exclusion criteria.
Detailed history and complete physical examination were done for all participants. Data regarding age, duration of diabetes, presence of diabetes complications and medication were collected. Laboratory investigations included complete blood count (CBC), fasting plasma glucose, HbA1c, lipid profile, serum creatinine, prolactin, total testosterone and pituitary gonadotropins (LH, FSH).
Blood pressure and pulse rate were measured using automatic blood pressure (BP) machine after 5 minutes of rest. Body mass index was also calculated using the formula: BMI = weight (kg)/ height (m2). The International Index of Erectile Function (IIEF) was applied for diagnosis of ED [6] and the revised NDS clinical scoring system was used for diagnosis of peripheral diabetic neuropathy (PDN) [7].
After an overnight fasting venous blood samples were taken into tripotassium ethylene diamine tetraacetic acid, using a Roche Minos cell counter and automatic blood counter (Avid CELL-DYN 3500; Abbot Laboratories, Abbot Park, IL, USA) immediately after sample collection for platelet indices, WBC count, and RBC indices. Standardiza¬tion, calibration of instrument, and processing of samples were done according to the manufacturer’s instructions. Fasting blood glucose was measured using the glucose oxidase method (Spinreact, Girona, Spain). Total Hb was measured colorimetrically. HbA1c was determined immune turbid metrically. The final result was expressed as percent HbA1c and is calculated from the HbA1c/Hb ratio, including a conversion equation to match a HPLC reference method. HbA1c (%) = HbA1c/Hb) x 175.8 + 1.73 [8].
Hormonal assay, FSH, LH, prolactin and total testosterone, TSH, FT4, FT3, in serum were determined by electrochemiluminescent immunoassay on a Roche Modular E170 autoanalyser. Total cholesterol, HDL, cholesterol and TG were measured by BioMerieux Laboratory, Marcy l’Etoile, France; LDL cholesterol was calculated as follows: LDL-C = TC – HDL-C – TG/5 according to the method used by Friedewald [9]. Creatinine was measured by kinetic colorimetric assay based on the Jaffé method on Cobas c701 (Roche Diagnostics, Mannheim) according to the manufacturer’s instructions.
Our laboratory reference ranges
Testosterone: 6.7-29 nmol/l, LH: 1.5-12.4 mol/l, FSH: 1.5-12.4 nmol/l, prolactin 65.2-539.1 nmol/l. TSH: 0.35-4.9 uIU/ml, FT4: 7.5-21.1 pmol/l, FT3: 3.8-7.8 pmol/l. FPG mmol/l, HbA1c as % of total hemoglobin. RBC 4.5-6.3 10/L, WBC 4-11 10/L, MCH 26-36 pg, MCHC 32-36 gm/dL, HCT 38-52%, Hb 14-18 gm/dL, Platelets 140-440 10/L, RDW 11-14%, MPV 7-13 fL, TC: 3-5.2 mmol/l, LDL-C: 3-5.2 mmol/l, HDL-C: 1.04-1.55 mmol/l, TG: 0.34-1.95 mmol/l, creatinine 80-115 μmol/l.
Statistical analysis
Sample size was calculated by PASS software version 11.0.8 Hintze J. PASS 11. NCSS, LLC. Kaysville, Utah, USA. www.ncss.com.). Calculation relied upon a previous study by Ugwu et al. In this study HbA1c was 6.8 ± 0.8 in those without ED and 8.0 ± 1.9 in those with ED. Group sample sizes of 40 patients with ED and 40 without achieve 95% power to detect a difference of 1.2 between the null hypothesis that both group means are 6.8 and the alternative hypothesis that the mean of group 2 is 8.0 with estimated group standard deviations of 0.8 and 1.9 and with a significance level (alpha) of 0.05000 using a two-sided two-sample t-test.
Data were entered and analyzed using SPSS software (version 21). Categorical data were presented as frequencies and percentages while quantitative data were presented as mean ± SD if normally distributed (Kolmogorov-Smirnov test p >0.050) or median and interquartile range (IQR) if skewed (Kolmogorov-Smirnov test p ≤ 0.050). Comparing categorical data for two groups was performed by Chi-square test while comparing quantitative data for two groups was performed by Independent-Samples t-test for normally distributed data or Mann-Whitney U test for skewed data. Correlation of a continuous data with binomial data was done by point bi-serial correlation while its correlation with ordinal/continuous data was done by Spearman’s correlation. A diagnostic cut off value of a test to discriminate diseased cases from non-diseased cases was evaluated using Receiver Operating Characteristic (ROC) curve analysis. Predictors were initially tested at univariate level then those with rather significant result were entered into a prediction model using binary logistic regression analysis to detect the independent predictors with their odds ratios (95% CI). Results were considered significant if p value < 0.050 and graphs were used when appropriate.
Results
Fifty-one patients of the study group (56% of total number of patients) had erectile dysfunction. These were older in age and had more prevalence of peripheral diabetic neuropathy (p=0.039, 0.008 respectively). There was a clear trend towards higher HbA1c in ED patients (p=0.05). They also had significantly higher hematocrit (HCT) [0.034], and on the other hand, they had significantly lower MCH (p= 0.036) and lower MPV (p=0.017).
A binomial logistic regression was performed to ascertain the effects of presence of PDN, age (years), HbA1C, low MCH (<34 versus ≥ 34), non-low MCV (≥ 80 versus <80) and low MPV (≤ 9.35 versus >9.35) on the likelihood that participants have ED. Cut off values of 34 for MCH and 80 for MCV were drawn from the normal reference ranges while a cutoff of 9.35 for MPV was drawn from a ROC curve analysis of our data. The diagnostic accuracy of this cutoff value showed 82.4% sensitivity, 55% specificity, 70% PPV and 71% NPV (AUC=0.707, p value=0.001) (Figures 1,2).
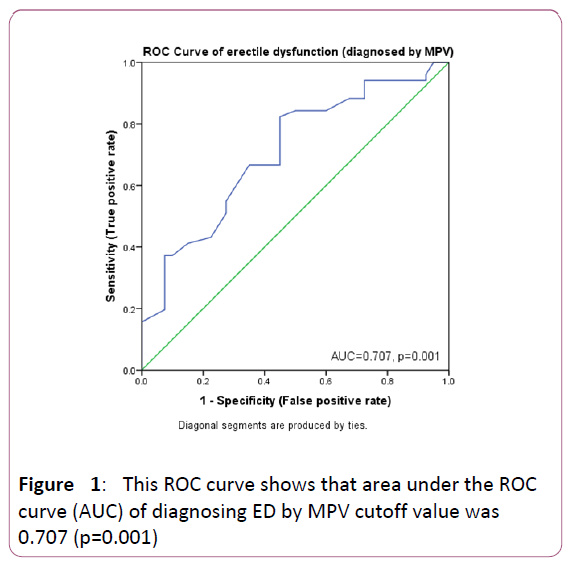
Figure 1: This ROC curve shows that area under the ROC curve (AUC) of diagnosing ED by MPV cutoff value was 0.707 (p=0.001)
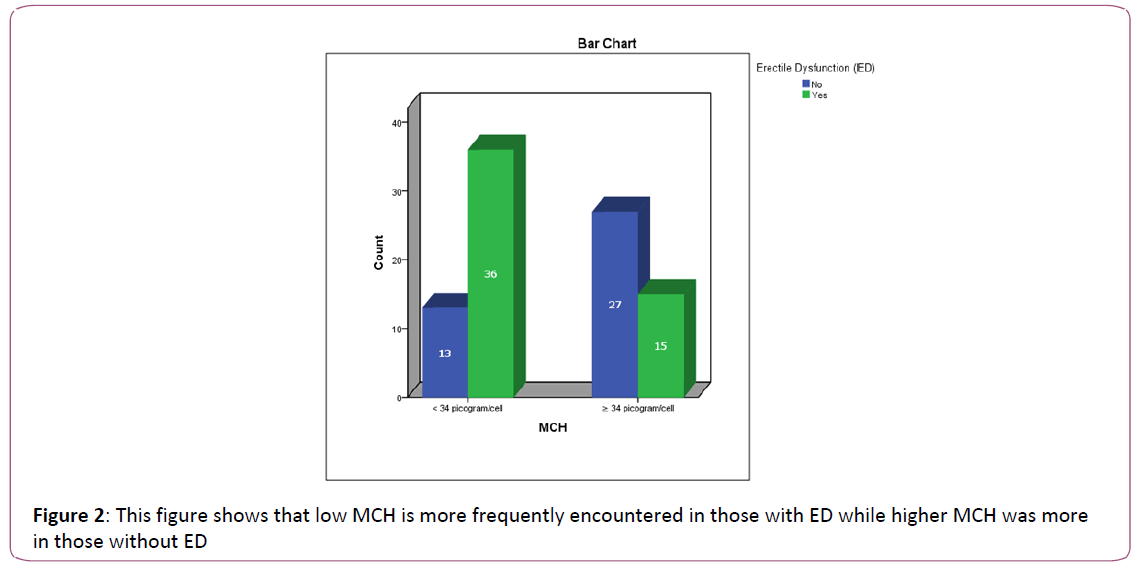
Figure 2: This figure shows that low MCH is more frequently encountered in those with ED while higher MCH was more in those without ED
High HbA1c proved to be an independent risk factor of erectile dysfunction (p=0.033) meanwhile low MPV and low MCH were independent predictors for this disorder (p=0.036, 0.034 respectively, OR= 5.562, 9.524 respectively). Peripheral diabetic neuropathy was a significant risk factor for ED (p=0.009) but it did not prove to be an independent predictor. (Tables 1-4, Figures 1-3).
| Variable |
Group |
P1 |
Crude OR |
P2 |
With ED
(n=51) |
Without ED
(n=40) |
| Age (years) |
60 (47-64) |
51 (42.25-61) |
*0.039 |
1.038 |
0.060 |
BMI class: Count (Percent)
Ideal (18.5-24.9 kg/m2)
Overweight (25-29.9 kg/m2)
Class I obesity (30-34.9 kg/m2)
Class II obesity (35-39.9 kg/m2)
Class III obesity (>40 kg/ m2) |
3 (5.9%)
15 29.4%)
24 (47.1%
7 (13.7%)
2 (3.9%) |
3 (7.5%)
9 (22.5%)
16 (40%)
9 (22.5%)
3 (7.5%) |
***0.689 |
0.805 |
0.333 |
| BMI kg/m2 |
30.8 (28.7-33.9) |
31.5 (27.9-35.6) |
*0.349 |
0.975 |
0.574 |
| SBP mmHg |
130 (120.5-141) |
134 (120-140) |
*0.956 |
0.992 |
0.582 |
| DBP mmHg |
77 (69-80) |
78 (69-84) |
*.421 |
0.977 |
0.338 |
| Mean BP |
94 (88.2-99.8) |
93.3 (88.3-103.3) |
*.548 |
0.977 |
0.333 |
| Pulse (Mean ± SD) bpm |
77.8 ± 9.4 |
81.3 ± 10.5 |
**0.098 |
0.964 |
0.101 |
Presence of Diabetic neuropathy
Count (Percent) |
38 (74.5%) |
19 (47.5%) |
***0.008 |
3.231 |
0.009 |
| Duration of DM (years) |
12 (6-16) |
8 (2.5-15) |
*0.085 |
1.047 |
0.152 |
Data are presented as Median (IQR) unless otherwise stated. P1 by *Mann-Whitney U test,
**Independent Samples t-Test, ***Chi-Square test and ****Fisher’s Exact Test. P2 by Binary Logistic Regression.
OR=Odds Ratio, BMI: Body mass index, SBP: Systolic blood pressure, DBP: Diastolic blood pressure, BP: Blood pressure.
Table 1: Clinical data of patients with and without erectile dysfunction.
| Variable |
Group |
P1 |
Crude OR |
P2 |
With ED
(n=51) |
Without ED
(n=40) |
| Serum total testosterone nmol/l |
11.25 (9.2-17.9) |
14.1 (8.7-16.9) |
*0.642 |
0.982 |
0.660 |
| LH nmol/l |
4.06 (3.26-5.17) |
3.35 (2.77-5.27) |
*0.217 |
0.934 |
0.357 |
| FSH nmol/l |
4.25 (3.53-6.65) |
5.05 (2.95-7.83) |
*0.636 |
0.911 |
0.219 |
| Prolactin nmol/l |
134.9 (121.8-152.9) |
136 (90.6-154.1) |
*0.301 |
0.999 |
0.595 |
| TSH uIU/ml |
1.91 (1.31-3.21) |
2.39 (1.72-3.595) |
*0.334 |
0.840 |
0.331 |
| FT4 pmol/l |
14.9 ± 3.3 |
14.6 ± 2.3 |
**0.741 |
1.041 |
0.733 |
| FT3 pmol/l |
4.6 ± 0.66 |
4.8 ± 0.47 |
**0.536 |
0.528 |
0.512 |
| FPG mmol/l |
7.6 (6.05-11.9) |
8.3 (6.73-11.0) |
*0.713 |
1.017 |
0.766 |
| HbA1C % |
8.66 ± 1.4 |
8.08 ± 1.3 |
**0.053 |
1.381 |
0.058 |
| TC mmol/l |
4.12 ± 1.05 |
4.17 ± 1.13 |
**0.816 |
0.953 |
0.813 |
| LDL-C mmol/l |
2.1 (1.6-2.9) |
2.2 (1.55-3.0) |
*0.620 |
0.935 |
0.708 |
| HDL-C mmol/l |
1.025 (0.89-1.15) |
1.04 (0.855-1.2) |
*0.833 |
0.904 |
0.907 |
| TG mmol/l |
1.42 (1.06-1.88) |
1.48 (1.1-1.9) |
*0.724 |
1.125 |
0.644 |
| S cr µmol/l |
80.5 (70-94.25) |
78 (69-88) |
*0.412 |
1.005 |
0.578 |
| WBCs 109/L |
7.00 (6.35-8.075) |
6.3 (5.55-7.675) |
*0.143 |
1.152 |
0.331 |
| RBCs 109/L |
5.62 (5.12-6.048) |
5.505 (5.2-6.3) |
*0.693 |
0.862 |
0.493 |
| Hb gm/dL |
15.95 (14.4-16.9) |
15.65 (14. 816.6) |
*0.767 |
1.103 |
0.442 |
| HCT % |
47.8 (34.2-51.2) |
42.1 (33.4-46.6) |
*0.034 |
1.073 |
0.055 |
| MCV fL |
84.3 (29.2-88.4) |
77.75 (31.2-86.7) |
*0.247 |
1.010 |
0.312 |
| MCH pg |
29.9 (28.6-41.6) |
45.3 (29.5-48.5) |
*0.036 |
0.943 |
0.034 |
| MCHC gm/dL |
33.3 (32.6-71.5) |
33.8 (30.3-79.7) |
*0.935 |
0.994 |
0.588 |
| RDW % |
14.05 (13.4-14.7) |
13.9 (13.5-14.6) |
*0.755 |
1.175 |
0.487 |
| PC 109/L |
212.5 ± 75.5 |
210.6 ± 47 |
**0.754 |
1.001 |
0.749 |
| MPV fL |
8.75 (8.2-9.3) |
9.4 (8.6-10.2) |
*0.017 |
0.543 |
0.036 |
Data are presented as Median (IQR) unless otherwise stated. P1 by
*Mann-Whitney U test, **Independent Samples t-Test. P2 by Binary Logistic Regression. OR=Odds Ratio.
LH: luteinizing hormone, FSH: follicle stimulating hormone, TSH: thyroid stimulating hormone, FT4: free tetraiodothyronine, FT3: Triiodothyronine, FPG: Fasting plasma glucose, HbA1c: glycosylated hemoglobin, LDL-C: low density lipoprotein cholesterol, HDL-c: high density lipoprotein cholesterol, TG: triglycerides, S cr: serum creatinine WBC: White blood cell count, RBC: Red blood cell count, Hb: hemoglobin, HCT: Hematocrete, MCV: Mean corpuscular volume, MCH: Mean corpuscular hemoglobin, MCHC: Mean corpuscular hemoglobin concentration, RDW: Red cell distribution width, PC: platelet count, MPV: Mean platelet volume.
Table 2: Laboratory variables of patients with and without erectile dysfunction.
| Parameter |
ED group |
c2 |
P1 |
Crude OR
(95% CI) |
P2 |
With ED
(n=51) |
Without ED
(n=40) |
| Low MCH pg |
36 (70.6%) |
13 (32.5%) |
13.086 |
<0.0005 |
4.99
(2-12.2) |
<0.0005 |
| Non-low MCV fL |
37 (72.5%) |
20 (50%) |
4.870 |
0.027 |
2.6
(1.1-6.3) |
0.029 |
| Low MPV fL |
42 (82.4%) |
18 (45%) |
13.925 |
<0.0005 |
5.7
(2.2-14.8) |
<0.0005 |
This table is showing that the frequency of low MCH (<34), non-low MCV (≥80) and low MPV (≤9.35) are statistically and significantly higher in those with ED as compared to those without ED.
Data are presented as count (%). P1 value by Chi-square. OR=Odds ratio, CI=confidence interval. P2 value by simple logistic regression.
Table 3: MCV, MCH and MPV in the two study groups.
| Predictor |
B |
S.E. |
Wald |
P value |
OR |
95% CI for OR |
| Lower |
Upper |
PDN
Absent
Present |
0.194 |
0.651 |
0.089 |
0.766 |
R
1.214 |
0.339 |
4. 352 |
MCV fL
<80
≥ 80 |
-0.908 |
0.780 |
1.357 |
0.244 |
R
0.403 |
0.087 |
1.858 |
MCH pg
≥ 34
<34 |
2.254 |
0.783 |
8.296 |
0.004 |
R
9.524 |
2.055 |
44.146 |
| Age (years) |
0.044 |
0.027 |
2.592 |
0.107 |
1.045 |
0.990 |
1.103 |
| HbA1C (%) |
0.501 |
0.236 |
4.529 |
0.033 |
1.651 |
1.040 |
2.620 |
MPV fL
>9.35
≤ 9.35 |
1.716 |
0.577 |
8.835 |
0.003 |
R
5.562 |
1.794 |
17.244 |
| Constant |
-8.100 |
|
Table 4: Independent predictors of ED.
Testosterone did not correlate with erectile dysfunction and was not significantly different between both groups of patients (p=0.645, 0.642 respectively). Testosterone correlated positively and significantly with TC, RBC, Hb, HCT, FSH (p= 0.037, 0.043, 0.01, 0.046, 0.045 respectively). Testosterone correlated negatively with BMI values and class, pulse rate, serum creatinine, WBC, RDW and platelet count p=<0.0005, <0.0005, 0.047, 0.028, 0.032, 0.028, 0.021 respectively). Tables 2, 5.
| Variable |
Correlation coefficient |
P |
| Erectile dysfunction |
-0.049 |
*0.645 |
| Age (years) |
-0.074 |
0.485 |
| BMI class |
-0.491 |
<0.0005 |
| BMI kg/m2 |
-0.509 |
<0.0005 |
| SBP mmHg |
0.125 |
0.250 |
| DBP mmHg |
0.181 |
0.091 |
| MBP mmHg |
0.198 |
0.066 |
| Pulse bpm |
-0.212 |
0.047 |
| Presence of Diabetic neuropathy |
0.044 |
*0.681 |
| Duration of DM (yrs) |
0.028 |
0.793 |
| FPG mmol/l |
-0.124 |
0.252 |
| HbA1C % |
-0.047 |
0.665 |
| TC mmol/l |
0.229 |
0.037 |
| LDL-C mmol/l |
0.194 |
0.079 |
| HDL-C mmol/l |
0.168 |
0.129 |
| TG mmol/l |
-0.097 |
0.381 |
| S cr µmol/l |
-0.241 |
0.028 |
| TSH uIU/ml |
0.042 |
0.731 |
| T4 pmol/l |
0.293 |
0.078 |
| T3 pmol/l |
-0.058 |
0.825 |
| LH nmol/l |
0.186 |
0.080 |
| FSH nmol/l |
0.244 |
0.045 |
| Prolactin nmol/l |
0.052 |
0.696 |
| WBC 109/L |
-0.288 |
0.032 |
| RBC 109/L |
0.271 |
0.043 |
| Hb gm/dL |
0.340 |
0.010 |
| HCT % |
0.270 |
0.046 |
| MCV fL |
0.224 |
0.098 |
| MCH pg |
-0.086 |
0.529 |
| MCHC gm/dL |
-0.223 |
0.098 |
| RDW % |
-0.294 |
0.028 |
| PC 109/L |
-0.311 |
0.021 |
| MPV fL |
0.143 |
0.294 |
p value by Spearman’s Correlation and *Point Bi-serial Correlation
LH: luteinizing hormone, FSH: follicle stimulating hormone, TSH: thyroid stimulating hormone, FT4: free tetraiodothyronine, FT3: Triiodothyronine, FBG: Fasting blood glucose, HbA1c: glycosylated hemoglobin, LDL-C: low density lipoprotein cholesterol, HDL-c: high density lipoprotein cholesterol, BUN: Blood urea nitrogen, WBC: White blood cell count, RBC: Red blood cell count, HCT: Hematocrete, MCV: Mean corpuscular volume, MCH: Mean corpuscular hemoglobin, MCHC: Mean corpuscular hemoglobin concentration, RDW: Red cell distribution width, MPV: Mean platelet volume
Table 5: Correlation of total serum testosterone with clinical and laboratory variables.
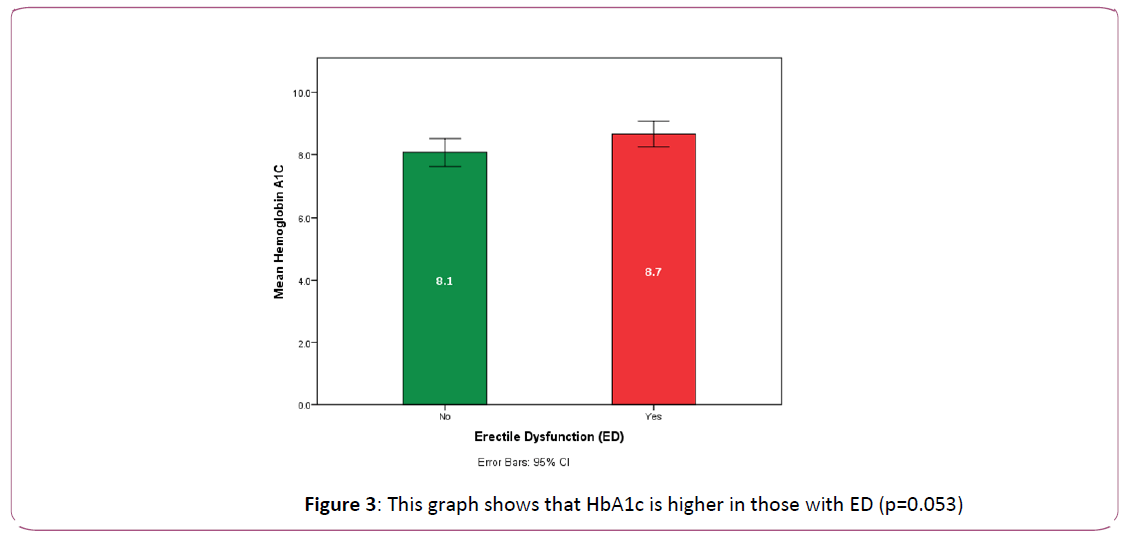
Figure 3: This graph shows that HbA1c is higher in those with ED (p=0.053)
Predictors of the likelihood of occurrence of ED
Table 3 is showing the difference between those with and without ED as regard to these three parameters. There were two studentized residuals with values of -2.988 and -3.494 standard deviations which were kept in the analysis. The logistic regression model was statistically significant (χ2 (6)=33.553, p<0.0005). The model explained 43.4% (Nagelkerke R2) of the variance in ED and correctly classified 72.1% of cases. Sensitivity and positive predictive value were 75.5%, while specificity and negative predictive value were 67.6%. Of the 6 predictor variables, HbA1C, MCH and MPV were statistically significant as shown in Table 4. Patients had 1.65 times higher odds to exhibit ED for every 1% rise in HbA1C, had 9.5 times higher odds to exhibit ED for those with MCH<34, and had 5.56 times higher odds to exhibit ED for those with MPV ≤ 9.35.
Discussion
Several researchers reported a high prevalence of ED in diabetic patients ranging from 20 to 90% with more affection at an earlier age than non -diabetic population. The differences in prevalence may be attributed to different criteria of the studied groups [10-12].
For example, in Lal Meena’s study the prevalence was 78% and was associated with higher cardiovascular risk [13] and increased with increasing age. The prevalence increased from 20% in the age group less than 40 to 100% in the age group more than 60 years.
In the Massachusetts male ageing study, men with treated diabetes had a 28% prevalence of complete ED, about three times higher than the prevalence in the entire study (10%). It also showed the extremely deleterious epidemiologic link between coronary artery disease, diabetes and ED [14]. In our study, ED was present in 56% of the study group who were older in age (p= 0.039) than those without ED.
The effect of age on prevalence and severity of the disease might be due to age-related changes occurring in the body and various other complications that may coexist in diabetic patients, but ultimately the accelerated atherosclerosis is the common factor for increased prevalence of ED and cardiovascular disease in aging population [14].
Although Romeo [12] declared peripheral neuropathy as an independent predictor of ED (p= 0.023), in our study, diabetic peripheral neuropathy was significantly associated with ED (p=0.008), and it was a significant risk (0.009), however, not an independent predictor.
In a study of 90 patients, Spanish researchers [15] uncovered clear links between erectile dysfunction and peripheral neuropathy. They found strong association between the severity of neuropathy symptoms and ED (p=0.009).
Similarly, in another study of Japanese, diabetic neuropathy was positively associated with severe erectile dysfunction among diabetic patients aged less than 65 years [16]. In Ugwu’s study, autonomic neuropathy was significant only when duration of diabetes was removed from the model [17].
Our patients suffering from ED showed a significant trend towards higher HbA1c (p=0.05) and high HbA1c proved to be an independent predictor of erectile dysfunction (p=0.033). Similar to our observation, HbA1c was also reported by Romeo and Ugwu and others as an independent predictor of ED in diabetic patients [12,17].
Available studies indicate that increased MPV triggers arterial atherosclerotic processes and thrombosis including penile arteries. Sensitivity of high MPV in detection of arteriogenic ED was mentioned in some reports reaching 54% with a specificity of 88% and 82% positive predictive value [18,19].
In contrast to most literature reports, our study demonstrated statistically significant association of ED with low MPV and accuracy of cut off value ≤ 9.35 fL was shown by an AUC of 0.707 (p value=0.001) with sensitivity, specificity, positive predictive value and negative predictive value of 82.4%, 55%, 70% and 71% respectively. Lower MPV had shown to be an independent predictor of erectile dysfunction (p=0.003, OR=5.562).
However, our observation is in agreement with a recent interesting study that was published in 2018, demonstrating the strong association between low MPV and high risk for critical limb ischemia in patients with peripheral arterial atherosclerotic disease. In that study, diabetes was one of the criteria to define critical limb ischemia and ROC analysis revealed a cut-off of ≤ 10.2 fL for MPV to best predict critical limb ischemia (sensitivity: 65%, specificity: 42%, positive predictive value: 71%, negative predictive value: 36%). MPV was not associated with myocardial infarction or stroke in the same study [20].
Decreased MPV could be regarded as an enhanced consumption of large platelets in inflammatory states [21].
Atherosclerosis affects all vascular beds, so, the earliest symptom development is expected in the artery with the narrowest lumen such as the penile artery. The negative impact of ED on coronary arteries has been published [22].
In our study low MCH was also an independent predictor of ED (p= 0.004, OR=9.524). This is a new observation that is up to our knowledge documented for the first time.
In this study, there was no significant difference between both groups of patients in testosterone level indicating that erectile dysfunction in diabetic patient is mostly due to factors other than hypogonadism. Although erections are clearly androgen-dependent, as evidenced by the marked reduction in the frequency, amplitude, and rigidity of erections in marked hypogonadism, the level of androgens required to induce ED is debatable. It is believed that there is a level of testosterone that is required for normal erection in adults and once this threshold is achieved, additional amounts do not further affect the frequency, amplitude, or rigidity of erections [23].
Total testosterone correlated negatively with BMI value and class in our study population. Similarly, Chuang reported inverse correlation between testosterone level and BMI. It is believed that this inverse correlation is responsible for the modulation of the lean body mass, fat mass and body composition [24].
In agreement with our results is the positive correlation between serum total cholesterol (TC) and testosterone observed by Chuang [24].We did not find significant associations between testosterone and other lipids that may be explained by the fact that most of our patients were receiving hypolipidemic drugs according to the American Diabetes Association clinical practice guidelines 2017.
Al-Chalabi [25] found a significant negative correlation between testosterone and diastolic blood pressure. She also reported a significant negative correlation between testosterone and TC and LDL-C. In our study we did not find such association between testosterone and blood pressure. However, testosterone level correlated negatively with heart rate. The higher the testosterone, the lower the heart rate that may indicate more cardiac fitness and decreased work of the heart. In Poliwczak’s study, testosterone therapy reduced heart rate Variability in the treated group of patients [26].
It is noteworthy mentioning that in the present study higher testosterone level was associated with lower serum creatinine level (p=0.028). Effect of testosterone on kidney function was previously demonstrated by Goel who reported a significant delay in the progression of chronic kidney disease in patients who received testosterone replacement. The treated men had a 24% decreased risk of end stage renal disease and 25% decreased risk of death [27].
Some reports indicate that testosterone increases the biological activity of erythropoietin, alters iron metabolism and stimulates red blood cell production thus increasing hemoglobin level [28]. This can explain our observation of the direct and strong correlation between serum testosterone and red cell count, hematocrit and haemoglobin level (p=0.043, 0.046, 0.01 respectively).
The relation between atherosclerotic and cardiovascular diseases and white blood cell count was evoked by several authors. Judith [29] demonstrated inverse correlation between total testosterone and total WBC in males 40 to 78 years of age who did not have history of coronary artery disease. We found the same correlation in our study population. These results support a link between hormonal status and low-grade inflammation and consequently the higher risk to atherosclerotic cardiovascular disease.
RDW has shown its significance as a predictive and risk factor for cardiovascular and overall mortality in the general population and in various conditions such as obesity, malignancies, and chronic kidney diseases [30]. In our study it is inversely associated with testosterone level (p=0.028). This may indirectly reflect the link between testosterone level and cardiovascular disease.
Conclusion
Erectile dysfunction in diabetic patients is strongly associated with peripheral neuropathy, not serum total testosterone level, so sexual history should not be missed in diabetic patients having PDN. This dysfunction can be also easily predicted by the uncontrolled diabetic state and simple CBC. Achieving target HbA1c in diabetic patients is of utmost significance to avoid ED. Requesting simple inexpensive CBC can significantly reflect the presence of an underlying complication such as ED with its widely known association with coronary atherosclerosis. Erectile dysfunction in diabetic patients is multifactorial as shown by its association with variable clinical and laboratory parameters. We believe that management of diabetes is an art that can has its effect on improving patient’s health and quality of life by simple basic and cost-effective clinical practice.
References
- Hatzimouratidis K, Amar E, Eardley I, Giuliano F, Hatzichristou D, et al. (2010) Guidelines on male sexual dysfunction: erectile dysfunction and premature ejaculation. Eur Urol 57: 804-814.
- Ayta IA, McKinlay JB, Krane R (1999) The likely worldwide increase in erectile dysfunction between 1995 and 2025 and some possible policy consequences. BJU International P: 84: 50-56.
- Ciftci H, Gumus K, Yagmur I, Sahabettin S, Celik H, et al. (2015) Assessment of mean platelet volume in men with vasculogenic and nonvasculogenic erectile dysfunction. Internat J Impotence Res 27: 38-40.
- American Association of Clinical Endocrinologists Medical Guidelines for Clinical Practice for The Evaluation and Treatment of male Sexual Dysfunction: A Couple’s Problem-2003 UPDATE.
- Dong JY, Zhang YH, Qin LQ (2011) Erectile dysfunction and risk of cardiovascular disease: Meta-analysis of prospective cohort studies. J Amer College of Cardio 58: 1378-1385.
- Rosen RC, Riley A, Wagner G, Osterloh IH, Kirkpatrick J (1997) The international index of erectile function (IIEF): a multidimensional scale for assessment of erectile dysfunction. Urology 49: 822-830.
- Meijer JW, Smit AJ, Sonderen EV, Groothoff JW, Eisma WH (2002) Symptom scoring systems to diagnose distal polyneuropathy in diabetes: the Diabetic Neuropathy Symptom score. Diabetic Medicine 19: 962?965.
- European Association for the Study of Diabetes (EASD) News Section 5/2004. Report of the ADA/EASD/IDF Working Group of the HbA1c Assay. London, UK.
- Friedewald WT, Lvey RI, Fredrickson DS (1972) Estimation of the concentration of low density lipoprotein cholesterol in plasma without the use of the preparative ultracentrifuge. Clin Chem 18: 499-502.
- Seid A, Gerensea H, Tarko S, Zenebe Y, Mezemir R (2017) Prevalence and determinants of erectile dysfunction among diabetic patients attending in hospitals of central and northwestern zone of Tigray, northern Ethiopia: a cross-sectional study. BMC Endocr Disord 17: 16.
- Kouidrat Y, Pizzol D, Cosco T, Thompson T, Carnaghi M, et al. (2017) High prevalence of erectile dysfunction in diabetes: A systematic review and meta-analysis of 145 studies. Diabet Med 34: 1185-1192.
- Romeo JH, Seffel AD, Madhum ZT, Aron DC (2000) Sexual function in men with diabetes type 2 association with glycemic control. J Urol 163: 788-791.
- Lal Meena B, Kochar DK, Agarwal TD (2009) Association between erectile dysfunction and cardiovascular risk in individuals with type-2 diabetes without overt cardiovascular disease. Int J Diabetes Dev Ctries 29: 150-154.
- Feldman HA, Goldstein I, Hatzichristou DG, Krane RJ, McKinlay JB (1994) Impotence and its medical and psychosocial correlates: Results of the Marsachusetts Male Ageing Study. J Urol 151: 54-61.
- Valles?Antuña C, Fernandez?Gomez J, Fernandez?Gonzalez F (2011) Erectile Dysfunction Study Shows High Prevalence of Peripheral Neuropathy. BJUI 108: 1855-1859.
- Furukawa S, Sakai T, Niiya T, Miyaoka H, Miyake T, et al. (2017) Diabetic peripheral neuropathy and prevalence of erectile dysfunction in Japanese patients aged <65 years with type 2 diabetes mellitus: The Dogo Study. Int J Impot Res 29: 30-34.
- Ugwu T, Ezeani I, Onung S, Kolawole B, Ikem R (2016) Predictors of Erectile Dysfunction in Men with Type 2 Diabetes Mellitus Referred to a Tertiary Healthcare Centre. Advances in Endocrinology.
- Sönmez MG, Gö?er YE, Sönmez LO, Ayd?n A, Balasar M, et al. (2017) Can Eosinophil Count, Platelet Count, and Mean Platelet Volume Be a Positive Predictive Factor in Penile Arteriogenic Erectile Dysfunction Etiopathogenesis? Am J Mens Health 11: 678-683.
- Aldemir M, Akdemir F, Okulu E, Ener K, Ozayar A (2016) Evaluation of blood platelet count and function in patients with erectile dysfunction. Andrologia 48: 189-192.
- Rief P, Raggam R, Avian A (2018) Low mean platelet volume is associated with critical limb ischemia in peripheral arterial occlusive disease. Scientific Reports.
- Gasparyan AY, Ayvazyan L, Mikhailidis DP, Kitas GD (2011). Mean platelet volume: a link between thrombosis and inflammation. Curr Pharm Des p: 47-58.
- Montorsi P, Montorsi F, Schulman C (2003) Is erectile dysfunction the “tip of the iceberg” of a systemic vascular disorder? Eur Urology 44: 352-354.
- Jacob Rajfer (2000) Relationship between Testosterone and Erectile Dysfunction. Rev Urol 2: 122-128.
- Chuang SM, Lee CC, Chien MN, Sun FJ, Wang CH (2016) The Associations between Serum total Testosterone Levels, Anthropometric Measurements and Metabolic Parameters in Elderly and Young Male Patients with Type 2 Diabetes Mellitus in Taiwan. Inter J Gerontology 11: 220-224.
- Al- Chalabi SS, Al_Waeli AD (2010) The Relatioship Between Serum Testosterone Level, Lipid Profile and Blood Pressure In Infertile Men. Tikrit Medical J 16: 120-123.
- Poliwczak AR, Tyli?ska M, Broncel M (2013) Effect of short-term testosterone replacement therapy on heart rate variability in men with hypoandrogen-metabolic syndrome. Pol Arch Med Wewn 123: 467-73.
- Goel A, Oni O, Wiegmann P (2017) Testosterone replacement therapy (TRT) delays progression of CKD and ESRD and lower the risk of death in men with hypogonadism. Poster presented at the National Kidney Foundation's 2017 Spring Clinical Meetings in Orlando, Florida.
- Beggs LA, Yarrow JF, Conover CF, Meuleman JR, Beck DT, et al. (2018) Testosterone alters iron metabolism and stimulates red blood cell production independently of dihydrotestosterone. Aging Male 4: 1-6.
- Judith SB, Yvonne T, Mitch D (2012) Testosterone, SHBG and differential white blood cell count in middle-aged and older men 71: 274-278.
- Sahin O, Akpek M, Sarli B, Baktir AO, Savas G, et al. (2015) Association of red blood cell distribution width levels with severity of coronary artery disease in patients with non-ST elevation myocardial infarction. Med Princ Pract 24: 178-183.