Keywords
Mycorrhiza; maize (Zea mays); Air pollutant; Acid rain; Chlorophyll; Protein; Carotenoids; Growth of plants
Introduction
In the current century, the amount of chemicals entered into the environments by industrial, agricultural, transportation, sewage and other human activities have unfortunately increased. After entering into the environments, chemicals may be widely diffused by the movement of the air and water, causing various effects on the environment and its living organisms. Low amounts of chemicals may cause environmental contamination, without any side effect [1]. A chemical is only a pollutant when it has environmental effects. The effects of different concentrations of these pollutants on plants are as follows:
1. When the concentration of pollutants becomes high enough, the plant may be destroyed. Chemicals such as sulfur dioxide, ozone, fluorides and peroxyacyl nitrate damage the leaves of plants. If enough leaves are damaged, the entire plant will die.
Sulfur dioxide, a by-product of burning fossil fuels such as oil, coal and gasoline, causes changes in the colors of leaf tissue, which may turn white, brown or yellow. SO2 causes chlorosis, necrosis, plasmolysis, membrane damage, metabolic inhibition and death [1,2]. Some sulfur dioxide converts to sulfuric acid, which eats holes in the leaves. Ozone and hydrocarbons cause pre-mature yellowing and fall of leaves and flower buds and discolouration and curling of sepals [3,4]. If the damage by ozone is severe enough, the plant will drop its leaves altogether. Fluorides and Peroxyacyl nitrates damage leafy vegetables. Nitrogen oxides reduce yield of crops [5-7].
2. At lower concentrations, the plant can survive, but it’s vital functions are disrupted. For example, the amount of photosynthesis may be reduced, the control of transpiration can be eliminated or root activity can be reduced. Sulfur dioxide is the main industrial air pollutant which causes heavy damage to the vegetation and retards the growth of plants by stimulating abnormalities in metabolism of the plants, like photosynthesis. Dr. Kent reports that nitrogen dioxide, a byproduct of combustion from car engines or open fires, can slow the growth of plants. These effects usually result in inconsistencies and changes in the distribution of food between plant organs.
3. At lower concentrations, plant growth and activity may be normal in optimal environmental conditions, but the pollutant may cause minor chemical and physical changes that reduce plant tolerance to environmental damages such as drought, frost, or pests and diseases.
In addition, another problem is related to acid rain. Acid rain directly or indirectly affects many vital processes of the plant and has caused irreparable damage to the environment in many parts of the world. The acid precipitation mixes with the rain clouds and makes it more acidic. This change is attributed principally to increased emissions of oxides of nitrogen and sulfur and their conversion to nitric and sulfuric acids [8]. Rain also traps much of windblown particles, dust and other constituents, which may also be acidic (pH 2.5 to 4.8) in nature. Sulfuric acid (H2SO4), nitric acid (HNO3), various sulphates and nitrates are the chief chemical constituents of these rains, though small amount of other acids like hydrochloric acids and their salts may also be present. Increase in the acidic substances in air due to various anthropogenic activities is increasing at an accelerated rate resulting in dramatic change in atmosphere leading to acidity of rain water, popularly called as acid rain.
The term "mycorrhiza" was first introduced by Frank in 1885. Mycorrhiza consists of two words “Myco” means the fungus and “Rhiza” means the root. Mycorrhiza represents the participation in the colonization of fungus and root.
In this system, the fungus forms a wide covering of twisted filaments named “Mycelium” over the roots of the host plant, and increases the contact surface level of the roots with soil and moisture 10 to 1000 times more, the ability of the plants for using existed resources in its surroundings has increased [9]. In this colonization, fungus receives sugar, amino acids, vitamins and some other organic substances from the host, and absorbs minerals and phosphate more than other substances and distributes them to the plant [10]. It has been shown that mycorrhizal fungi increase the host plant growth by direct methods such as improving plant nutrition by absorbing nutrients and increasing absorption water by plant and indirect ones such as reducing biological stresses like plant diseases and nonbiological stresses such as salinity, drought, and elements [11,12]. The age of the mycorrhizal fungi in the terrestrial ecosystem is more than 460 million years old. Most plants are able to form a mycorrhizal system. In general, 83% of dicotyledonous and 79% of monocotyledonous plants are capable to forma mycorrhiza system, and it is worth noting that mycorrhizal fungi are considered as indispensable factors in a stable system of soil and plant, colonized with roots of more than 97% of plants [13,14]. Further, it is related to roots of more than 80% of the xerophyte [15]. Only a limited number of crops such as Cruciferae families, Sinpsis, Brassica type and Chenopodiacea family, Beta type and Polygonaceae family, Fagopyrum type cannot form a mycorrhiza system.
This study aimed to investigate the effect of air pollutants and acid rain on maize (Zea mays) and its effects on growth parameters and photosynthesis ability of the plant by the presence of mycorrhizal fungi.
Method and Materials
In the present study, a pot experiment was conducted in a greenhouse environment at 25 ± 1°C and 30% moisture and 12000 lux light intensity (by Osram lamp) for 16 hours lightning. The experimental treatments included inoculated plants by mycorrhizal fungi (Glomus etunicatum) and non-inoculated plants as the control group.
First, 15 grams of Agar powder was mixed with 1500 cc of distilled water. Then, it was given a chance to cool after boiling for 30 minutes. In the next stage, under a laminar hood, 3.5 grams of calcium hypochlorite was dissolved in 100 cc of water and 50 Zea mayse seeds were placed in to disinfect for 7 minutes. Then, the Agar water was divided equally and poured into 4 plastic containers, and the seeds were placed on it by 1 cm distance and put in the incubator to germinate. After 3 days, the germinated seeds were ready to cultivate in the soil.
Eight 5-kilogram pots were provided (4 pots for mycorrhiza plants and 4 pots for control plants), and the autoclaved soil was equally divided and placed in pots. The amount of 100 g of mycorrhiza inoculum (prepared from University of Tehran, Biology Laboratory) was added for fungal treatments before planting and under sowing. The soil used (Tables 1 and 2) was an agronomic soil with sandy loam texture. After applying the treatments, four seeds of Zea mays cultivar were cultivated in each pot. But only 2 plants were kept in each pot. Initial irrigation of the pots was conducted for four weeks with normal water pH=7 (200 cc every 4 days).
| Type of experiment |
Ec dS/m |
pH |
TVN % |
OC % |
total N |
P(ava) mg/kg |
K(ava) mg/kg |
Fe mg/kg |
Zn mg/kg |
Cu mg/kg |
Mn mg/kg |
Clay |
silt |
Sand |
texture |
| Salinity Saturation |
Acidity |
TNV |
Organic Carbon |
Nitrogen |
Phosphorous |
Potassium |
Ferro |
Zinc |
Copper |
Manganese |
Clay |
Silt |
Sand |
|
| Desirable range |
<4 |
6.5-7 |
- |
3 |
0.3 |
15 |
500 |
12 |
2.5 |
2 |
10 |
20 |
20 |
20 |
Sandy loam |
| Critical range |
- |
<7 |
- |
1.5 |
0.2 |
10 |
300 |
10 |
1.2 |
1 |
8 |
- |
- |
- |
- |
| Results |
8.42 |
7.41 |
19.50 |
1.07 |
0.12 |
74.29 |
592 |
2.15 |
1.56 |
1.35 |
6.95 |
15 |
24 |
61 |
Sandy loam |
Table 1: Results of soil test.
| Soil Characteristics |
Salinity |
Acidity |
TNV |
Organic Carbon |
Nitrogen |
Phosphorous |
Potassium |
Ferro |
Zinc |
Copper |
Manganese |
| Qualitative Analysis |
Salt |
Relatively high |
Calcareous |
medium |
medium |
high |
high |
Very low |
medium |
desirable |
low |
Table 2: Results of qualitative interpretation of soil test.
Based on the above tables, the acidity of the soil is slightly high while it is salty for the soil. Although the amount of phosphorus is high, it is not enough to prevent the disruption of the mycorrhiza fungus colonization.
During four weeks after planting, a diagnostic test of coexisting was conducted with the Lactophenol cotton blue agent to assure the formation of mycorrhiza according to mycorrhizal method at the roots of the plant, as the roots were sprinkled with water after fixing the samples in FAA (Formaldehyde, acetic acid, and alcohol as (5:5:90) (20 minutes’ fixation).
Then, the roots were placed in KOH 10% at 70°C for one hour and after washing with water, the roots were placed in the following solution for 30 minutes (3 ml NH4OH+20%+30 ml hydrogen peroxide+567 ml Water). In the next step, the components were placed in 3% HCL for 5 minutes.
Finally, the samples were placed in Lactophenol cotton blue solution (0.5 g of Ketone powder+300 g of phenol+250 ml of lactic acid+250 ml of glycine+300 ml of water) for 5-10 minute. In order to remove excess color, the samples were stained with Lactophenol. After assuring the formation of mycorrhiza (Figure 1), mycorrhizal and control plants were divided into 2 groups: irrigated plants with acid rain water (40 cc acidic water+160 cc normal water per turn) and irrigated plants with normal water with PH=7 (200 cc per turn). Irrigation with acid rain water was conducted (Table 3) for 8 weeks (once every 4 days).
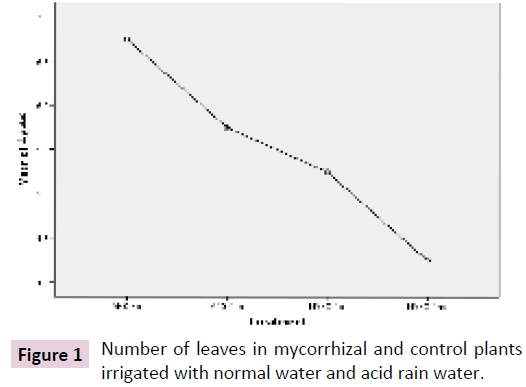
Figure 1: Number of leaves in mycorrhizal and control plants irrigated with normal water and acid rain water.
| Type of experiment |
Ec dS/m |
pH |
Co3 Mg/L |
Hco3 Mg/L |
Cl Mg/L |
So4 Mg/L |
Anions Mg/L |
Ca Mg/L |
Mg Mg/L |
Na Mg/L |
Cations Mg/L |
SSP % |
SAR |
TDS Mg/L |
| Salinity Saturation |
Acidity |
Carbonate |
Bicarbonate |
Chlorine |
Sulfate |
Anions |
Calcium |
magnesium |
Sodium |
Cations |
soluble sodium percentage |
Sodium absorption |
Total dry residue |
| Desirable range |
Less than 1000 |
7.0 |
0 |
<5 |
≤9 |
4-8 |
- |
4-10 |
4-12.5 |
5-10 |
- |
0 |
6.5-12 |
Less than600 |
| Results |
26.3 |
4.72 |
0 |
0.1 |
0.07 |
0.08 |
0.25 |
0.1 |
0.04 |
0.11 |
0.25 |
44 |
0.42 |
16.8 |
Table 3: Results of acid rain testing.
Blue parts show intracellular Arboscules. This figure was viewed using an optical microscope with a magnification of 40 and recorded by a Sony camera lab (Figure 1).
Ensuring the formation of mycorrhiza, each of mycorrhizal (Figure 2) and control plants were classified into 2 groups: irrigated plants with acid rain water (40 cc acidic water+160 cc of water per turn) and plants irrigated with normal water with PH=7 (200 cc at each turn) and irrigation with acid rain water was taken (Table 3) for 8 weeks (once every 4 days).
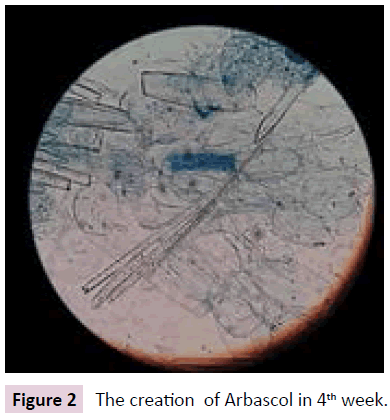
Figure 2: The creation of Arbascol in 4th week.
As the rain analysis indicates, the acidity of the water is 4.72, which is significantly lower than the optimum level and may have a negative effect on root activities (Figures 3-6) illustrate the plant growth after 8-week irrigation with acid rain water and normal water.
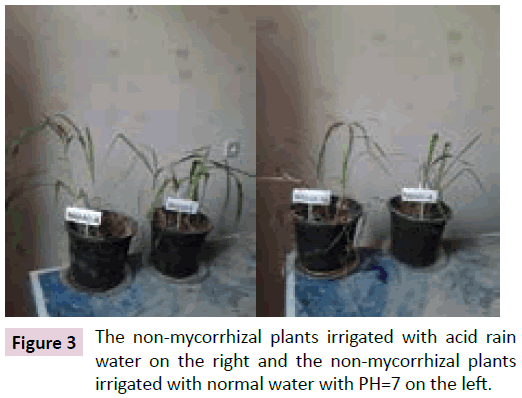
Figure 3: The non-mycorrhizal plants irrigated with acid rain water on the right and the non-mycorrhizal plants irrigated with normal water with PH=7 on the left.
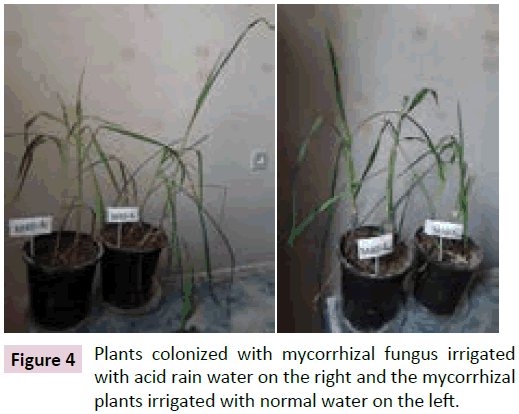
Figure 4: Plants colonized with mycorrhizal fungus irrigated with acid rain water on the right and the mycorrhizal plants irrigated with normal water on the left.
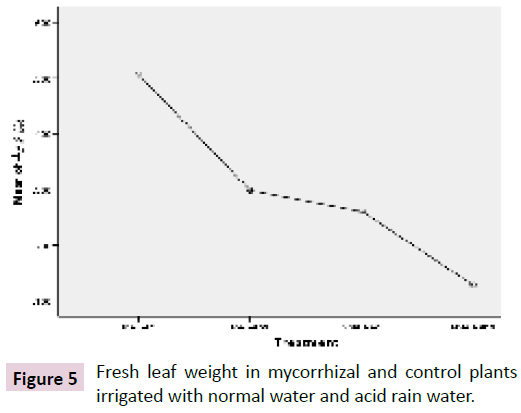
Figure 5: Fresh leaf weight in mycorrhizal and control plants irrigated with normal water and acid rain water.
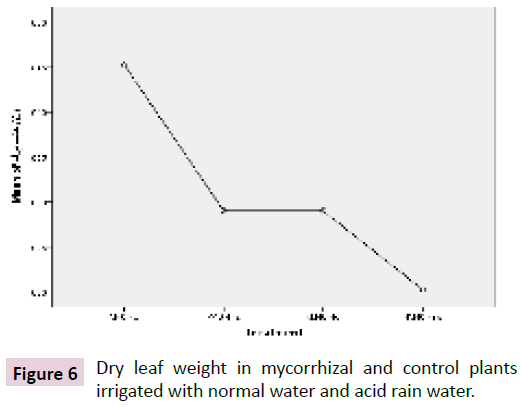
Figure 6: Dry leaf weight in mycorrhizal and control plants irrigated with normal water and acid rain water.
As shown in Figures 5 and 6, the growth rates of maize (Zea mays) colonized with mycorrhizal fungi irrigated with normal water are higher than other samples. Totally, growth rate of plants colonized with mycorrhizal fungi irrigated with rain or normal water are more than non-mycorrhizal plants. Of course, one of the reasons for this difference is the salinity of the soil, which suggests that mycorrhiza causes tolerance to salinity.
Measuring vegetative growth indicators:
• Plant height: The height of the plant was measured by a ruler from the soil surface to the end of the plant.
• Fresh leaf weight: After harvesting, the weight of Maize fresh leaf was measured using a digital scale in grams by accuracy 0.001.
• Dry leaf weight: After harvesting, the Maize leaf was dried at 80°C for 48 hours, and then, dry leaf weight was measured using a digital scale of in grams by accuracy 0.001.
• Root weight: The root was first washed and accordingly its soil and mud were washed. After drying, its weight was measured using a digital scale in grams by accuracy 0.001.
Measuring chlorophyll a, b and total chlorophyll and carotenoids
1) 0.1 g of leaves was put in porcelain mortar, then was crushed and crumbled using liquid nitrogen.
2) 5 ml of 80% acetone was added to the sample and after placing in a refrigerator for 2 hours, the sample was put in centrifuge by 6000 rpm for 10 minutes. The extract was transferred to the test tube and reached to 10 ml by 80% acetone.
3) A part of sample of the test tube was poured into the cuvette spectrophotometer and then absorption was separately read at 653 nm, 645 nm and 470 wavelengths by spectrophotometer.
4) Finally, using the following formulas, the levels of chlorophyll a, b and carotenoids were identified according to mg/g of fresh weight of the sample [16,17].
Chlorophyll a (mg/mL) = 12.7 A663-2.69 A645
Chlorophyll b (mg/mL) = 22.9 A645-4.68 A663
Total Chlorophyll (mg/mL)=Chlorophyll a+Chlorophyll b
Carotenoid(mg/mL)=(1000 A470–1.8 chl a–85.02 chl b)\198
A645= Absorption at 645 nm wavelength
A663= Absorption at 663 nm wavelength
A470= Absorption at 470 nm wavelength
Protein measurement
After extracting chlorophyll and discharging the solution, the residue of leaves in test tubes was combined with 5 ml of ethanol ether (1:1) to degrease. Then, the samples were vortexed on the shaker for 2 minutes. After removing the ethanol ether, the residue was mixed with 5 ml NAOH (0.1 M) for 15 minutes to digest protein, and again, the samples were vortexed for 2 minutes on shaker. Then, for measuring Bradford, 1 ml of Bradford solution to each tube and 100 micrograms of NAOH (0.1 M) in the control tube and 100 micrograms of each extraction protein solution into other tubes were added, some of each sample was poured to the Cuvette Spectrophotometer and then their absorbance amounts were separately read at 595 nm. Then, the protein compositions were obtained using the standard curve [17].
Results and Discussion
Vegetative indices
Based on ANOVA (by SPSS software) in Tables 4 and 5, a significant difference was observed among the groups based on the amount of different characteristics such as the number of leaves, fresh leaf weight, dry leaf weight, root weight, plant height and the amount of chlorophyll a, b, total chlorophyll, carotenoids and protein as the level of significance was less than 0.05 (p<0.05). However, no significant difference was reported for the number of fruits among the Mycorrhizal groups.
| |
N |
Mean |
Std. Deviation |
Std. error |
| Number of leaves |
M40-4c |
4 |
6.75 |
.957 |
.479 |
| M40-4ns |
4 |
5.75 |
.500 |
.250 |
| NM40-4c |
4 |
5.25 |
1.708 |
.854 |
| NM40-4ns |
4 |
4.25 |
.500 |
.250 |
| Total |
16 |
5.50 |
1.317 |
.329 |
| Fresh leaf weight |
M40-4c |
4 |
.50650 |
.045420 |
.022710 |
| M40-4ns |
4 |
.29825 |
.073830 |
.036915 |
| NM40-4c |
4 |
.26125 |
.051720 |
.025860 |
| NM40-4ns |
4 |
.12875 |
.055644 |
.027822 |
| Total |
16 |
.29869 |
.149158 |
.037289 |
| Dry leaf weight |
M40-4c |
4 |
.04525 |
.004646 |
.002323 |
| M40-4ns |
4 |
.02900 |
.006683 |
.003342 |
| NM40-4c |
4 |
.02900 |
.008206 |
.004103 |
| NM40-4ns |
4 |
.02025 |
.004787 |
.002394 |
| Total |
16 |
.03088 |
.010880 |
.002720 |
| Root weight |
M40-4c |
4 |
.07700 |
.008832 |
.004416 |
| M40-4ns |
4 |
.05525 |
.006850 |
.003425 |
| NM40-4c |
4 |
.04975 |
.004349 |
.002175 |
| NM40-4ns |
4 |
.03050 |
.002646 |
.001323 |
| Total |
16 |
.05313 |
.017970 |
.004492 |
| Plant height |
M40-4c |
4 |
44.75 |
6.652 |
3.326 |
| M40-4ns |
4 |
29.75 |
5.909 |
2.955 |
| NM40-4c |
4 |
28.25 |
3.862 |
1.931 |
| NM40-4ns |
4 |
21.75 |
4.349 |
2.175 |
| Total |
16 |
31.13 |
9.912 |
2.478 |
| Number of fruits |
M40-4c |
4 |
.50 |
.577 |
.289 |
| M40-4ns |
4 |
.50 |
.577 |
.289 |
| NM40-4c |
4 |
.25 |
.500 |
.250 |
| NM40-4ns |
4 |
.00 |
.000 |
.000 |
| Total |
16 |
.31 |
.479 |
.120 |
M40-4C = Inoculated plants with mycorrhiza and irrigated with normal water.
M40-4ns = Inoculated plants with mycorrhiza and irrigated with Acid rain water.
NM40-4C = Controlled plants irrigated with normal water.
NM40-4ns = Controlled plants irrigated with Acid rain water.
Table 4: ANOVA for mycorrhizal and non-mycorrhizal plants irrigated with acid rain and normal water on vegetative growth and deviation and criterion error indicators.
| |
|
N |
Mean |
Std. Deviation |
Std. Error |
| Chlorophyll a |
M40-4c |
4 |
52.8 |
0.80029 |
0.40015 |
| M40-4ns |
4 |
42.11 |
0.75925 |
0.37963 |
| NM40-4c |
4 |
36.55 |
0.34881 |
0.1744 |
| NM40-4ns |
4 |
33.61 |
0.80029 |
0.40015 |
| Total |
16 |
41.2675 |
7.59096 |
1.89774 |
| Chlorophyll b |
M40-4c |
4 |
12.33 |
0.0432 |
0.0216 |
| M40-4ns |
4 |
10.89 |
0.17282 |
0.08641 |
| NM40-4c |
4 |
9.31 |
0.54056 |
0.27028 |
| NM40-4ns |
4 |
7.3875 |
0.48397 |
0.24198 |
| Total |
16 |
9.9794 |
1.92798 |
0.482 |
| Total Chlorophyll |
M40-4c |
4 |
65.13 |
0.83391 |
0.41695 |
| M40-4ns |
4 |
53 |
0.65315 |
0.32657 |
| NM40-4c |
4 |
46.11 |
1.34196 |
0.67098 |
| NM40-4ns |
4 |
40.9975 |
1.28113 |
0.64056 |
| Total |
16 |
51.3094 |
9.3902 |
2.34755 |
| Carotenoids |
M40-4c |
4 |
12.73 |
0.19131 |
0.09566 |
| M40-4ns |
4 |
10.73 |
0.45768 |
0.22884 |
| NM40-4c |
4 |
8.12 |
0.0216 |
0.0108 |
| NM40-4ns |
4 |
7.76 |
0.1633 |
0.08165 |
| Total |
16 |
9.835 |
2.10611 |
0.52653 |
| Protein |
M40-4c |
4 |
902.5 |
1.47196 |
0.73598 |
| M40-4ns |
4 |
387.6 |
0.57591 |
0.28795 |
| NM40-4c |
4 |
309.36 |
0.7785 |
0.38925 |
| NM40-4ns |
4 |
241.23 |
0.66035 |
0.33018 |
| Total |
16 |
460.1725 |
269.1237 |
67.28091 |
Table 5: ANOVA for mycorrhizal and non-mycorrhizal plants irrigated with acid rain and normal water on the amount of chlorophyll a, chlorophyll b, total chlorophyll, carotenoids and protein.
Data Analysis
Leaf number: inoculation with mycorrhizal increased the number of leaves in Maize compared with control plants and the highest number of leaves was found in inoculated plants with mycorrhiza irrigated with normal water, which indicated a significant difference, compared with non-mycorrhizal plants. The lowest leaves were produced in control plants which were not inoculated with any mycorrhizal fungus and were irrigated with acid rain water. In addition, the number of leaves in mycorrhizal plants irrigated with acidic water was higher than the number of leaves in the control plants irrigated with normal water.
Fresh and dry leaf weight: The comparison of the average effect of inoculation treatments of maize with mycorrhizal fungi (Figures 5 and 6) indicated that inoculation with mycorrhizal fungus leads to an increase in fresh and dry weights of maize leaves, compared to the control plants. The highest fresh and dry leaf weight of leaf was obtained in mycorrhizal plants irrigated with normal water, indicating a significant difference compared with the control plants. In addition, the lowest fresh and dry leaf weight obtained in control plants irrigated with acid rain water and fresh and dry leaf weight of mycorrhizal plants irrigated with acid rainwater was higher than the control plants irrigated with normal water. An increase in dry weight of the airborne parts of the arbuscular Mycorrhiza fungus (Glomus etonicatum) was reported in Chinese Scallion [18], Onion [19], Tomato (Subramanian and Charest; Alkaki & Hammad, Pepper and Sensoy et al. [20,21] indicated that the existence of a wide network of hyphae of mycorrhizal and arbusccular fungi increase the absorption of water and nutrition by the plant. Brein et al. reported that mycorrhizal tomato operated better than control plants under salinity condition.
Plant height: As illustrated in Figure 7, the highest plant height was reported in plants inoculated with mycorrhizal fungi and irrigated with normal water, and the lowest value for this indicator was reported in the control plants irrigated with acid rain water and plant height was higher in Mycorrhiza plants irrigated with acid rain water compared to control plants irrigated with normal water. The coexistence of mycorrhizal fungi with roots of mint has increased photosynthesis through the absorption of water and nutrients and has led to more production and growth such as plant height. Citrus tangerine inoculated with arbuscular fungus was higher than non-mycorrhizal citrus under irrigating with and without stress (Wu and Xia, 2006). Inoculation with mycorrhizal fungus increased the height of the tomato, due to the absorption of sufficient water and nutrients by the hyphae around the root [22,23].
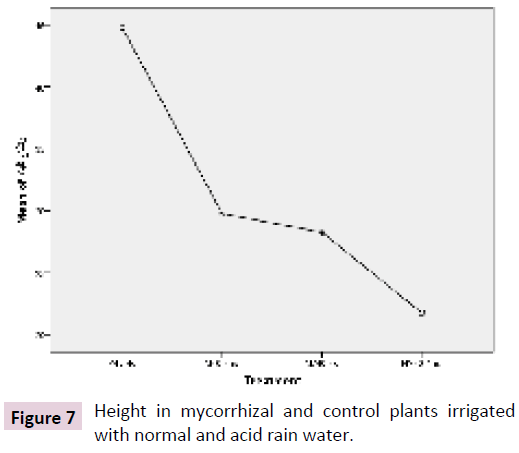
Figure 7: Height in mycorrhizal and control plants irrigated with normal and acid rain water.
Root weights: As shown in Figure 8, the highest root weights were reported in inoculated plants with mycorrhizal fungi and irrigated with normal water, and the lowest value for this indicator was reported in control plants irrigated with rain water and root weight was higher in mycorrhizal plants irrigated with acid rain water than in control plants irrigated with normal water.
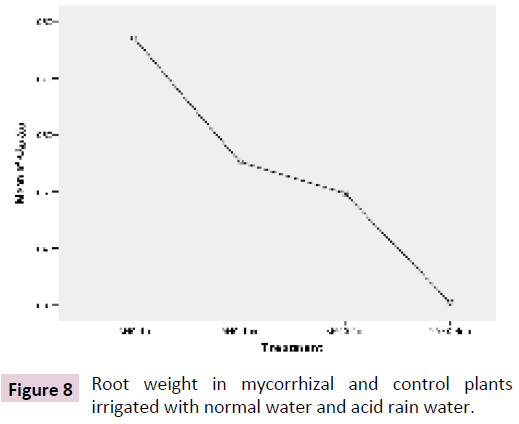
Figure 8: Root weight in mycorrhizal and control plants irrigated with normal water and acid rain water.
Number of fruits: As displayed in Figure 9, the fertilization of plants inoculated with mycorrhizal fungi is more than that of the control plants, which is not significantly different from the mycorrhizal plants irrigated with acid rain water and normal water. However, this index in mycorrhizal plants irrigated with normal water is significantly different from control plant irrigated with acid rain water. Even, the index in mycorrhizal plants irrigated with acid rain water is significantly different from control plants irrigated with normal water.
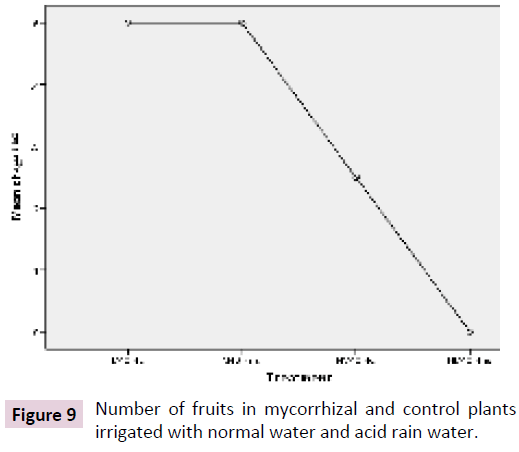
Figure 9: Number of fruits in mycorrhizal and control plants irrigated with normal water and acid rain water.
Chlorophyll
As shown in Table 5, the highest amount of chlorophyll a, b and total chlorophyll was reported in myrrhiza plants irrigated with normal water and the lowest in control plants irrigated with acid rain water. The amount of these indices was significantly higher in plants irrigated with acid rain water than that of control plants irrigated with normal water.
By improving the stress effects, mycorrhizal coexistence significantly increases the amount of chlorophyll a, b, total chlorophyll content in pistachio seedlings coexisting with mycorrhizal under drought stress conditions.
The amount of Chlorophyll in living plants is one of the important factors in preserving photosynthetic capacity. Based on the results (Figures 10-12), the photosynthesis rate in mycorrhiza plants is significantly higher than that of control plants. In addition, the amount of photosynthesis and consequently the amount of oxygen production in irrigated mycorrhiza plants irrigated with acid rain water and under environmental stress conditions is more than the control plants irrigated with normal water under non-stress conditions.
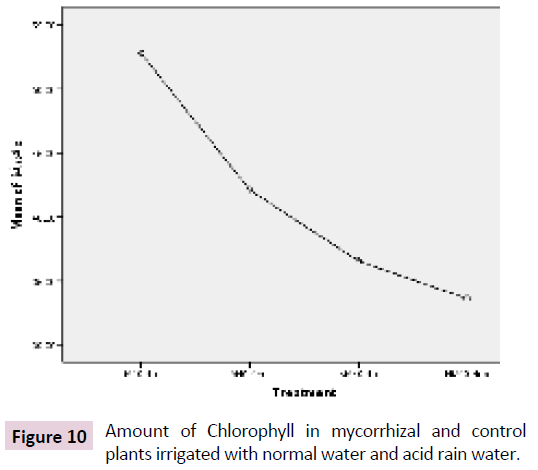
Figure 10: Amount of Chlorophyll in mycorrhizal and control plants irrigated with normal water and acid rain water.
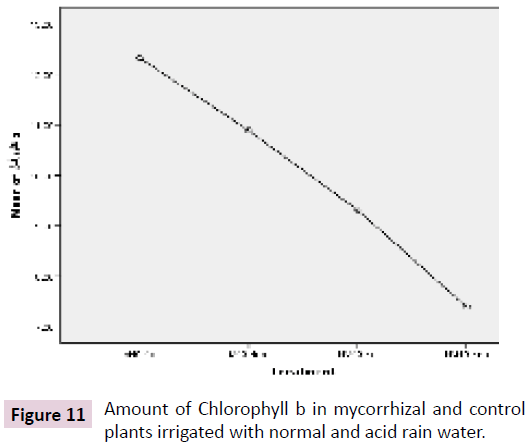
Figure 11: Amount of Chlorophyll b in mycorrhizal and control plants irrigated with normal and acid rain water.
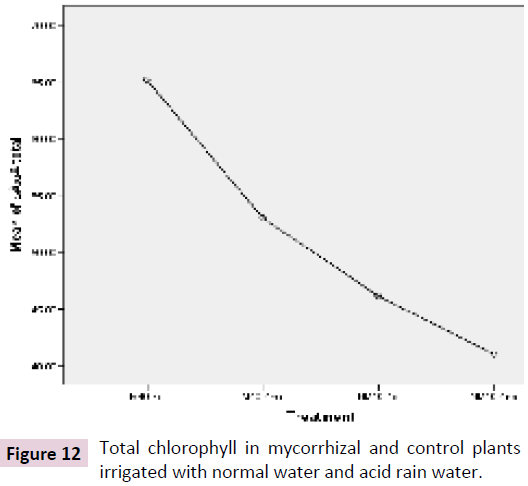
Figure 12: Total chlorophyll in mycorrhizal and control plants irrigated with normal water and acid rain water.
Carotenoids
As shown in Figure 13, the amount of carotenoids is the highest in mycorrhizal plants irrigated with normal water and the lowest in the control plants irrigated with acid rain water. The amount of this index in mycorrhiza plants irrigated with acid rain water was significantly higher than that of control plants irrigated with normal water.
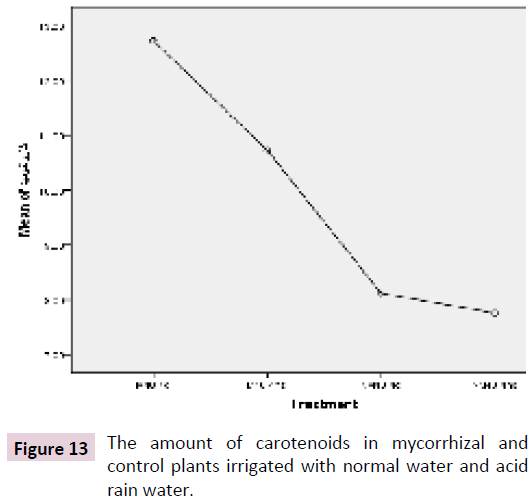
Figure 13: The amount of carotenoids in mycorrhizal and control plants irrigated with normal water and acid rain water.
Carotenoid pigments play two main functions: collecting the energy used in photosynthesis and protecting chlorophyll from light degradation when the intensity of light is high. Based on the results (Figure 13), the amount of carotenoids in Mycorrhiza plants and even mycorrhiza plants irrigated with acid rain water makes a significant difference in the amount of photosynthesis and their resistance to the light in comparison with the control plants.
Protein
The highest amount of protein was reported in the mycorrhiza plants irrigated with normal water while the lowest was reported in the control plants, irrigated with acid rain water. The rate of this index in mycorrhiza plants irrigated with acid rain water is higher than in control plants irrigated with normal water.
Some important and structural plant activities such as metabolism are regulated and controlled by the presence of proteins. Even, as shown in Figure 14, mycorrhiza plants irrigated with acid rain have better metabolism than control plants irrigated with normal water.
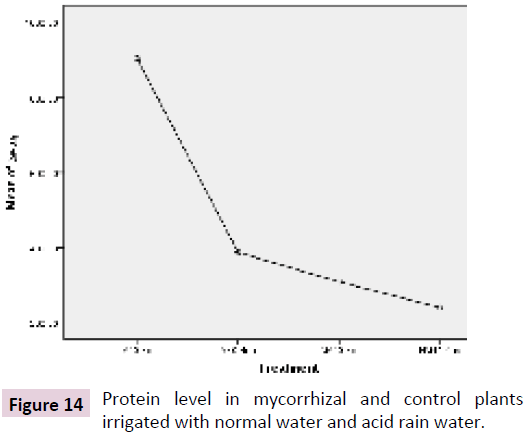
Figure 14: Protein level in mycorrhizal and control plants irrigated with normal water and acid rain water.
Conclusion
In the current century, the amount of chemicals entering the environment through industrial, agricultural, transportation, sewage and other human activities, as well as the amount of air pollution and acid rain have substantially increased. This pollutant not only causes the destruction of plants but also it can reduce photosynthesis and purges of the air on a smaller scale. Mycorrhizal fungi increase the plant absorption of water and nutrients and consequently lead to an increase in the plant growth due to the effective increase in root absorption level through the formation of a hyphae.
In addition, mycorrhizal fungi produce more types of chlorophyll and photosynthetic pigments and increase photosynthesis. Further, the production of protein and plant hormones such as cytokines is enhanced by mycorrhizal fungi, which increases photosynthesis in inoculated plants by affecting on metabolic processes. The results showed that mycorrhiza retained these properties to a great extent in Maize under environmental stress and air pollution and irrigated with acid rain water. The results also indicated that inoculation with mycorrhizal fungus in Maize caused plant resistance under air pollution and acid rain conditions, in addition to increasing the parameters such as chlorophyll, carotenoids, proteins and growth parameters, and consequently increaseS the photosynthesis and production of oxygen and purifies the air. Finally, these indices are higher in mycorrhizal plants under these environmental stresses than the non-micro-plants which are not placed in these conditions.
References
- https://www.springer.com/la/book/9780306426759
- Biggs AR, Davis DD (1980) Stomatal response of three birth species exposed to varying acute doses of sulphur dioxide. J Am Soc Hortic Sci 105: 514-516.
- Krupa SV, Gruenhage L, Jaeger HJ, Nosal M, Manning M, et al. (1995) Ambient ozone and adverse crop response: A unified view of cause and effect. Environ Pollut 87: 119-126.
- Heagle AS (1989) Ozon and crop yield. Annu Rev Phytopathol 27: 397-423.
- Hosono T, Nouchi I (1992) Effects of simulated acid rain on the growth of radish, spinach and bush bean plants. J Japanese Society for Air Pollution 17: 111-112.
- NAS (1971) Biological effects of atmospheric pollutants: Fluorides. NAS, Washington.
- Weinstein LH (1977) Fluoride and plant life. J Occup Med 19: 49-78.
- Galloway JN, Likens GE, Edgerton ES (1976) Acid precipitation in the northeastern United States: pH and acidity. Science 194: 722-723.
- https://www.amazon.in/Biofertilizers-Sustainable-Agriculture-K-Sharma/dp/8177541188
- Heinemeyer A, Fitter AH (2004) Impact of temperature on the arbuscular mycorrhizal (AM) symbiosis: growth responses of the host plant and its AM fungal partner. J Exp Bot 55: 525-534.
- Hause B, Fester T (2005) Molecular and cell biology of arbuscular mycorrhizal symbiosis. Planta 221: 184-196.
- Garcia-Garrido JM, Ocampo JA (2002) Regulation of the plant defence response in arbuscular mycorrhizal symbiosis. J Exp Bot 53: 1377-1386.
- Smith SE, Read DJ (2008) Mycorrhizal Sym biosis, third ed. Academic Press, London, UK.
- Rillig MC (2004) Arbuscular Mycorrhizae and Terrestrial Ecosystem Processes, University of Montana, USA.
- Tahat MM, Sijam K (2012) Mycorrhizal fungi and abiotic environmental conditions relationship. Res J Environ Sci 6: 125-133.
- Wellburn AR, Higginson C, Robinson D, Walmsley C (1981) Biochemical explanations.
- Arnon D (1949) Copper Enzymes in isolated chloroplasts.polyphenoloxidase in Beta vulgaris. Plant physiol 24: 1-15.
- Perner H, Schwarz D, Kngelika A, George E (2011) Influence of sulfur supply, ammonium nitrate ratio, and arbuscular mycorrhizal colonization on growth and composition of Chinese chive. Sci Hort 130: 485-490.
- Mahaveer PS, Alok A (2000) Enhanced growth and productivity following inoculation with indigenous AM fungi in four varieties of onion ( Allium cepa L.) in an alfisol. Biol Agri Hort 18: 1-14.
- Subramanian KS, Charest C (1997) Nutritional, growth and reproductive responses of maize (Zea mays L.) to arbuscular mycorrhizal inoculation during and after drought stress at tasselling. Mycorrhiza. 7: 25-32.
- Gaur A, Adholeya A, Mukergi KG (2000) On farm production of VAM inoculums and vegetable crops in marginal soil amended with organic matter. Tropical Agriculture 77: 21-26.
- Esmaielpour B, Amani N (2014) Investigating the effect of mycorrhizal inoculation on growth and uptake of nutrients in lactuca sativa cv Syaho. J of Soil Management and Sustainable Production 4.
- Gupta ML, Prasad A, Ram M, kumar S (2002) Effect of the vesicular-arbuscular mycorrhizal(VAM) fungus Glomus fasiculatum on the essential oil yield related characters and nutrient acquisition in the crops of different cultivars of menthol mint (Mentha arvensis) under field conditions. Bioresour Technol 81: 77-79.