Research Article - (2023) Volume 20, Issue 3
Inequalities in Willingness to Pay for Zambia’s National Health Insurance Scheme
Mulenga Kabaso* and
Frederik Booysen
Department of Health Economics and Policy Association, University of the Witwatersrand, Johannesburg, South Africa
*Correspondence:
Mulenga Kabaso, Department of Health Economics and Policy Association, University of the Witwatersrand, Johannesburg,
South Africa,
Email:
Received: 24-Nov-2022, Manuscript No. IPDEHC-22-14960;
Editor assigned: 28-Nov-2022, Pre QC No. IPDEHC-22-14960 (PQ);
Reviewed: 12-Dec-2022, QC No. IPDEHC-22-14960;
Revised: 24-Feb-2023, Manuscript No. IPDEHC-22-14960 (R);
Published:
03-Mar-2023, DOI: 10.21767/2049-5471.20.3.011
Abstract
This paper investigates socioeconomic inequalities in household willingness to pay for national health
Insurance. The paper used data from the nationally representative Zambia household health
expenditure and utilization survey. Contingent valuation was used to elicit willingness to pay using a
bidding game technique. A concentration curve and a concentration index were used to measure
inequalities in willingness to pay, while Wagstaff, et al. decomposition was used to identify the factors
that contribute to these inequalities. The concentration index for socioeconomic inequalities in
willingness to pay was estimated at 0.161, indicating that willingness to pay was concentrated among
affluent households. The Wagstaff, et al. decomposition results suggested that the ability to pay,
proxied by per capita expenditure, contributed most to the inequalities in willingness to pay.
Thus, policy makers should target programs that create employment and income generating
activities that absorb everyone regardless of their socioeconomic status.
Keywords
Willingness to pay; Socio-economic inequality; Concentration index; Decomposition;
Zambia
Introduction
Universal Health Coverage (UHC) is a global health policy
agenda that has been adopted as one of the health targets of
Sustainable Development Goal (SDG) number 3, which is to
ensure healthy lives and promote wellbeing for all ages
(World Health Organization, 2015). This target states that we
should “achieve UHC, including financial protection, access to
quality essential healthcare services and access to safe,
effective, quality and affordable essential medicines and
vaccines for all”. Consequently, a predictable and sustainable health financing mechanism is therefore pivotal to health
system reform if UHC is to be attained.
To this effect, the government of Zambia is in the process of
implementing a mandatory national health insurance scheme.
This is to avoid high costs people incur when seeking health
care. The purpose of the scheme is to ensure that everyone
starts paying in advance for future health care expenditures
instead of having to pay when they are sick. A national health
insurance scheme will offer people health care when they
need it and protect them from high health expenditures and
risks of being impoverished due to ill health and emergency
health expenditures. The scheme will also assist in ensuring sustainable, predictable and dedicated financing for the
health sector whilst at the same time providing financial risk
protection for its citizenry.
In Zambia, such financing mechanism could be an important
way for improving health care utilization and improving health
status. Some of the major problems facing the health sector in
the country include limited funds for healthcare, elevated
disease burden especially in this advent of HIV/AIDS and
COVID-19, staff shortages, low and inequitable utilization and
poor quality health services. These problems prevent health
care from having a notable impact on health. The national
health insurance scheme will provide additional funding to
the Zambian health sector along with tax financing, private
health insurance and community based insurance.
Only a single study on willingness to pay for health insurance
explored inequalities in willingness to pay. Dong, et
al., documented inequalities in willingness to pay for
Community Based Insurance (CBI) by expenditure quintile
using data collected from a household survey in Burkina
Faso. A bidding game method of contingent evaluation
was used to elicit willingness to pay. The results from
study show that the poorer people were willing to pay
less for CBI. Dong, et al., study further stated that,
households might be a better unit of enrolment in terms of
equity than the individual, since the distribution of
willingness to pay by household was less unequal than
the distribution of willingness to pay by individuals.
Unlike Dong, et al., study this paper adds to literature
by not only documenting socioeconomic inequalities
in household willingness to pay for national health
insurance in Zambia but also decomposing the factors that
contribute to the socioeconomic inequalities. Doing so will
help policy makers with the levers with which to address
inequalities in willingness to pay for the scheme [1-7].
Theoretical Framework
The conceptual framework discusses the way the analysis is
modeled and the reasons behind the choice of models, in line
with the literature review. The model specification is based on
the neoclassical theory of welfare economics that assumes
that households are rational. Households aim to maximize
their utility or satisfaction from consumption of any given
good, subject to their budget constraint. However, unlike in
the market for consumer goods, demand for health products
is derived demand. Implying that health is demanded not just
for its sake but to enable households to carry out certain
rewarding activities. In line with welfare economic theory
defined above, this study defines willingness to pay as the
maximum amount that a Zambian household is willing to pay
to participate in the national health insurance scheme (Figure
1).

Figure 1: Willingness to pay for how much a household values
health an improvement.
To illustrate household willingness to pay for the scheme as a
health improvement strategy, assume that household utility U
(∙) depends on income Mi. Assume further that the
introduction of national health insurance improves health
status of a household from H0 to H1. The willingness to pay for
national health insurance is thus defined as:
U (M-Y, P, H1)=U (M, P, H0 ) (1)
Where Y is willingness to pay and P is the price of non-health
goods. Therefore, willingness to pay is the amount of money
that if paid keeps the household at the initial level of utility. Figure 1 illustrates the concept of willingness to pay for
national health insurance. The two curves U0 and U1 show
how utility increases with income at two different health
states H0 and H1. To estimate a household’s maximum
willingness to pay for national health insurance, start with the
initial level of health status H0 and an income of M0 and a
utility level U*. Next determine the lower income M1 on an
improved health status H1 that results in the same utility level
U* as income M0 in the original health state H0. Willingness to
pay is the difference between M0 and M1. Thus, willingness to
pay is a measure of how much the household values
a particular improvement in health [8-12].
Materials and Methods
Data
This paper used secondary data from the 2014 Zambia
Household Health Expenditure and Utilization Survey
(ZHHEUS). The central statistical office with the support from
the ministry of health and the university of Zambia conducted
the survey to inform the national health accounts estimation
and the development of the healthcare financing strategy.
Using a two stage stratified sampling approach, it covered a
total of 12000 households, including some 59,500 individuals,
in all provinces and districts of the country.
Eliciting Willingness to Pay
Within the questionnaire, the bidding game version of
contingent valuation was used to estimate willingness to pay
for household head and other members of the family. Nine
iterations were used in the bidding game and the starting bid
was K3 000 per month, followed by the bids K2000, K1000,
K500, K300, K100, K50, K20 and then K10. The final bid question is a binary response question that indicates if the
respondent is willing to pay less than K10 per month or not.
This study mainly distinguished respondents who were willing
to pay for the scheme from those that were not willing to pay
at all.
Outcome Variable
The health outcome studied was willingness to pay, a binary
variable. The English translation of the relevant survey
question was: “Are you willing to pay for national health
insurance scheme?”
Socioeconomic Rank
Per capita expenditure was used as the measure of
socioeconomic status. Ekman explains that in situations with reliable income statistics and a large section of the population
in salaried work, socioeconomic status would be measured by
the reported income from labour and capital. But in settings,
such as those of most low-income countries, expenditure is
taken as that measure. The use of per capita expenditure as a
choice of socioeconomic status is necessitated by the
relatively large sections of the population in unsalaried labour
and the significant seasonal variations in household
income (Table 1) [13-17].
| Variable |
Definition |
Description |
| Age |
Age of household head at last birthday |
Continuous |
| Female |
Indicate gender of household head, encoded as female=1, male=0 |
Dichotomous |
| Marital status |
Indicate the marital status of household head: Never married=1, married=2, cohabiting=3, separated=4, divorced=5, widowed=6. |
Categorical |
| Education |
Highest attained level of formal education by household head: 0=none; 1=low; 2=middle and 3=high |
Categorical |
| Employment status |
Indicates employment type of the household head: Unemployed=1, informal employment=2 and formal employment=3 |
Categorical |
| Religion |
Denomination of household head: 1=catholic, 2=protestant, 3=Jehovah’s witness, 4=muslim, 5=traditionalist, 6=atheist and 7=others |
Categorical |
| Household size |
Number of people in a household |
Continuous |
| Children |
Number of children below the age of 5 years in a household |
Continuous |
| Elderly |
Number of persons above the age of 65 years in the household |
Continuous |
| Urban |
Location of household: 0=rural and 1=urban |
Dichotomous |
| Visits |
Total outpatient visits by household members in the last four weeks |
Continuous |
| Days |
Total number of inpatient days by household members |
Continuous |
| Illnesses |
Indicate whether any household member suffers from a chronic illness: 0=no, 1=yes |
Dichotomous |
| Insurance |
Health Insurance coverage of a household: 1=insured, 0=uninsured |
Dichotomous |
| Per capita expenditure |
Total per capita monthly household expenditure in Kwacha |
Continuous |
Note: All individual level characteristics refer to the characteristics of the respondent that answered the questions on household willingness to pay, namely the household head.
Table 1: Description of the factors.
Factors
The following factors were used in the decomposition
analysis.
Concentration Curve and Concentration Index
Analyses on the extent of households’ socioeconomic
inequalities in willingness to pay were done in two stages. The
first stage was to use a Concentration Curve (CC) to examine
socioeconomic inequalities in willingness to pay for national
health insurance. In the second stage, a Concentration Index
(CI) was used. The standard concentration index is defined
below:
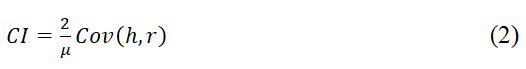
Where h is the willingness to pay for the scheme, r is the
fractional rank of a household in the expenditure score
distribution, Cov is covariance and μ represents the mean of
the willingness to pay values. Since the outcome variable is
binary, Erreyger’s corrected concentration index was used.
The index is desirable as it satisfies properties required for
bounded variables. The equation for the Erreyger index is as
follows:
CCI=4μ/(b-a)×C (3)
Where CCI is the corrected concentration index, μ is the mean
of the willingness to pay, a and b are minimum and maximum
values of willingness to pay, respectively, and C the
standardized concentration index defined in equation (2). This
study makes use of the coindex functionality in STATA to
calculate concentration index and concentration curve.
The concentration index can either be positive or negative.
The sign of the concentration index explains the relationship
that exists between willingness to pay and position in the
wealth score distribution. If the concentration index is zero, it
means that there is no inequality in the distribution of
willingness to pay by wealth and hence the concentration
curves will coincide with the line of equality. A negative value
of the concentration index is obtained if willingness to pay is
disproportionately concentrated among the poorest
households while a positive value of concentration index
suggests willingness to pay is concentrated among the richest
households. The value of the concentration index ranges
between -1 and +1 and the concentration index provides
information about the strength of the relationship. The closer
the absolute values of the concentration index to one, the
greater the level of inequality.
Decomposition Analysis
After estimating concentration index, the causes of the
socioeconomic inequalities were determined. Decomposing
socioeconomic inequalities helps to uncover specific factors
that are potentially modifiable by policy decision makers. This
was done using the Wagstaff, et al., decomposition method
proposed by Wagstaff, et al.
Wagstaff, et al., Decomposition
Wagstaff, et al., proposed an approach that identifies factors
that explain the socioeconomic inequalities in the willingness
to pay for the national health insurance scheme. Following
equation (4) below depicts the linear relationship between
willingness to pay and its determinants:

Where y is the binary outcome variable for willingness to pay,
α is a constant, β measures the relationship between each
explanatory factor (x) and the willingness to pay variable, and
ε the error term. Like the concentration indices, the
decomposition technique used for the standard
Concentration Index (CI) was modified to suit the Corrected
Concentration Index (CCI) as follows:
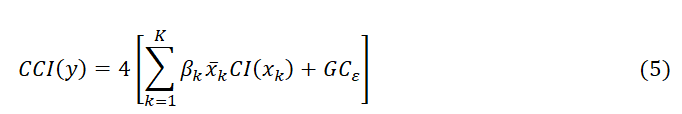
Where

Denotes the elasticity of willingness to pay to marginal
changes in the kth factor. CI (Xk) denotes the concentration
index of the kth contribution factor, while GCɛ notes the
generalized concentration index of the error term. The first
term in equation as follows:

Represents the contribution of factor k to socioeconomic
inequality in willingness to pay. It constitutes the
deterministic component of the willingness to pay
concentration index. The second term (GCε) captures the
unexplained component or the residual. The Generalised
Linear Model (GLM) with binomial family and logit link was
used to decompose the binary outcome variable. The use of
GLM with binomial distributed outcome variable and
specifying the identity link function is suitable choice in the
decomposition analysis of the binary outcome, because it
considers the structure of the distribution while preserving
the link between the regressors and dependent variables. The
contribution made by each factor is dependent on the sign
and size of the calculated elasticity and concentration index
for each factor.
All things being equal, an increase (decrease) in inequality will
increase (reduce) the degree of inequality in willingness to
pay. This study also computed bootstrapped standard errors
using 500 replications to determine whether the contribution
of each factor to socioeconomic inequality in willingness to
pay is statistically significant.
This study used the variables in Table 1 as contributing factors
in the decomposition. All categorical variables were converted
to dummies in the Wagstaff, et al., decompositions. Data
analyses were conducted in STATA software version 16.
Results
Socioeconomic and Demographic Characteristics
Table 2 shows the socio-demographic characteristics of the
households in the sample. The mean age for the household
heads is 43.3 years and the mean number of children under 5
years old in a household is about one child per household. On
average each household has 0.17 persons older than 65 years of age. Most household heads are males (75.4%) and the
majority of them are married (72.11%). The mean average
household size is 4.97 and most of the household heads only
reached a primary level of education (43%). Many of the
household heads are protestants (67.96%). Employed
household heads dominate the sample at about 78.81%, even
though most of them work in the informal sector (88.5%).
Many household heads reside in rural Zambia (58.11%)
compared to 41.89% urban. More than ninety percent of the
households (94.8%) do not have any insurance coverage. The
majority of households had no members with chronic
illnesses (60.31%), compared with those who had at least one
member with chronic illness (39.69%). The mean total
number of insured persons, the total number of outpatient
visits, the total number of inpatient days and per capita
household monthly expenditure (ZMK) are 1.25 persons, 67
visits, 1.25 days and K1,217.85 ($190.29) respectively.
| Characteristics |
Frequency |
Percentage/Mean |
Std. dev |
| Age in years |
11,743 |
43.3 |
14.98 |
| No. of children <5 years |
11,944 |
0.89 |
0.96 |
| No. of elderly >65 years |
11,944 |
0.17 |
0.43 |
| Gender |
| Male |
8,854 |
75.4 |
0.43 |
| Female |
2,891 |
24.6 |
0.43 |
| Marital status |
| Never married |
706 |
6.02 |
1.51 |
| Married |
8,467 |
72.11 |
1.51 |
| Cohabiting |
37 |
0.32 |
1.51 |
| Separated |
275 |
2.34 |
1.51 |
| Divorced |
796 |
6.78 |
1.51 |
| Widowed |
1,460 |
12.44 |
1.51 |
| Household size |
11,944 |
4.97 |
2.55 |
| Level of education |
| None |
1,183 |
10.18 |
0.83 |
| Low |
5,029 |
43.29 |
0.83 |
| Middle |
4,127 |
35.53 |
0.83 |
| High |
1,278 |
11 |
0.83 |
| Religion |
| Catholic |
2,583 |
21.99 |
0.95 |
| Protestant |
7,982 |
67.96 |
0.95 |
| Jehovah’s Witness |
766 |
6.52 |
0.95 |
| Muslim |
56 |
0.48 |
0.95 |
| Traditional |
92 |
0.78 |
0.95 |
| Atheist |
109 |
0.93 |
0.95 |
| Other |
157 |
1.34 |
0.95 |
| Employment status |
| Unemployed |
2,486 |
21.18 |
0.43 |
| Formal |
1,064 |
11.5 |
0.34 |
| Informal |
8,186 |
88.5 |
0.34 |
| Place of residence |
| Urban |
4,921 |
41.89 |
0.5 |
| Rural |
6,824 |
58.11 |
0.5 |
| Insurance |
| Insured |
624 |
5.2 |
0.24 |
| Uninsured |
11,320 |
94.8 |
0.24 |
| Illness |
| Yes |
4,741 |
39.69 |
0.39 |
| No |
7,203 |
60.31 |
0.39 |
| Total number of outpatient visits |
11,944 |
0.67 |
1.03 |
| Total number of inpatient days |
11,944 |
0.16 |
0.48 |
| Per capita monthly HH expenditure (ZMK) |
11,944 |
1,217.85 |
2,599.26 |
Note: Individual socio-demographic characteristics represent those of the household head.
Table 2: Socio-demographic and other household characteristics.
Willingness to Pay for National Health Insurance
Scheme
The data showed that there is overwhelming support for the
recently introduced national health insurance by the
government of Zambia. About 90 percent of households in
the sample rated the scheme as excellent, very good or good.
Households in the rural areas were more positive about the
scheme than urban households. Most households thought the
scheme will make health care affordable and protect them
against high health expenditures. The study found that,
majority (80%) of Zambian households was willing to pay
for the National Health Insurance scheme. The mean
national health insurance contribution to be paid monthly
was K90.76 (95% CI K84.29-K97.23) corresponding to 7.4%
of average monthly household expenditure (K1,217.85).
The median willingness to pay contribution was K10.00
implying that the 50th percentile of willingness to pay
laid at K10.00. The number of households not willing to pay for the scheme was 2,401 corresponding to 20% of all
households. Of these households, about 77% indicted that
they could not afford paying the contributions for the
scheme. About 67% of households who stated that, they
could not afford paying for the scheme were located in rural
areas and their household heads were either unemployed
or worked in the informal sector.
Concentration Curve and Concentration Index
Figure 2 below shows the concentration curve for willingness
to pay for national health insurance scheme. The curve lies
below the 45 degree line of equality, showing that willingness
to pay is concentrated among the affluent households. The CI
value of 0.161 is positive and highly significant at
conventional levels. Thus, willingness to pay for national
health insurance is concentrated among the non-poor
segments of the population. The results from the CC and CI,
therefore, indicate that willingness to pay for the scheme is higher among non-poor households. In other words, poorer
households are less willing to pay for national health
insurance scheme in Zambia.

Figure 2: Concentration curve for willingness to pay for
national health insurance.
Socioeconomic Related Inequality in Willingness to Pay
Table 3 shows that the per capita expenditure factor makes
the most statistically significant positive contribution to
inequalities in willingness to pay of about 92.212%. Thus,
reducing inequalities in households’ ability to pay which is
proxied by per capita expenditure reduces inequalities in
willingness to pay by about 92%. Equally, household size
makes the largest negative contribution to inequalities in
willingness to pay (-10.822%). This implies that eliminating
inequalities in household size will increase inequalities in
willingness to pay by about 11%.
| Factor |
Elasticity |
CI |
Absolute |
S.E |
% |
Total (%) |
| Age |
-0.067 |
-0.021 |
0.006*** |
0.001 |
3.6 |
3.6 |
| Gender |
-0.006 |
-0.045 |
0.001* |
0.001 |
0.663 |
0.663 |
| Marital status |
| Unmarried |
(base) |
(base) |
(base) |
(base) |
(base) |
|
| Married |
0.047 |
-0.025 |
-0.005*** |
0.001 |
-3.088 |
|
| Cohabiting |
0 |
0.279 |
0 |
0 |
-0.032 |
|
| Separated |
0.001 |
0.098 |
0.001 |
0 |
0.34 |
|
| Divorced |
0.002 |
-0.032 |
0 |
0 |
-0.149 |
|
| Widowed |
0.005 |
-0.067 |
-0.001 |
0.001 |
-0.883 |
|
| |
|
|
|
|
|
-3.812 |
| Religion |
| Catholic |
(base) |
(base) |
(base) |
(base) |
(base) |
|
| Protestant |
-0.019 |
-0.012 |
0.001** |
0 |
0.584 |
|
| Jehovah’s witness |
-0.002 |
0.062 |
0 |
0 |
-0.259 |
|
| Muslim |
0 |
0.22 |
0 |
0 |
0.233 |
|
| Traditionalist |
-0.001 |
-0.36 |
0.001** |
0 |
|
|
| Atheist |
-0.001 |
-0.169 |
0.001** |
0 |
0.469 |
|
| Other |
-0.001 |
-0.048 |
0 |
0 |
0.125 |
|
| |
|
|
|
|
|
1.759 |
| Urban |
-0.002 |
0.407 |
-0.003 |
0.007 |
-1.808 |
-1.808 |
| Education |
| None |
(base) |
(base) |
(base) |
(base) |
(base) |
|
| Low |
0.012 |
-0.244 |
-0.010** |
0.004 |
-6.445 |
|
| Middle |
0.022 |
0.166 |
0.014*** |
0.003 |
8.625 |
|
| High |
0.004 |
0.701 |
0.009 |
0.006 |
5.447 |
|
| |
|
|
|
|
|
7.627 |
| Insured |
-0.004 |
0.658 |
-0.012*** |
0.003 |
-7.362 |
-7.362 |
| Illness |
0.01 |
0.005 |
0 |
0 |
0.119 |
0.119 |
| Household size |
0.064 |
-0.064 |
-0.017*** |
0.003 |
-10.822 |
-10.822 |
| Children |
0.003 |
-0.16 |
-0.0019 |
0.003 |
-0.999 |
-0.999 |
| Employment status |
| Unemployment |
(base) |
(base) |
(base) |
(base) |
(base) |
|
| Formal |
0.004 |
0.571 |
0.008 *** |
0.005 |
5.249 |
|
| Informal |
0.028 |
-0.037 |
-0.004* |
0.001 |
-2.578 |
|
| |
|
|
|
|
|
2.671 |
| Elderly |
-0.008 |
-0.15 |
0.004*** |
0.001 |
2.698 |
2.698 |
| Visits |
0.001 |
-0.162 |
-0.001 |
0.002 |
-0.435 |
-0.435 |
| Total inpatient days |
0 |
-0.066 |
0 |
0 |
-0.06 |
-0.06 |
| Per capita expenditure |
| Quintile 1 |
(base) |
(base) |
(base) |
(base) |
(base) |
|
| Quintile 2 |
0.016 |
-0.4 |
-0.025*** |
0.003 |
-15.765 |
|
| Quintile 3 |
0.025 |
0 |
0.001*** |
0.001 |
0.015 |
|
| Quintile 4 |
0.026 |
0.4 |
0.041*** |
0.004 |
25.667 |
|
| Quintile 5 |
0.04 |
0.8 |
0.133*** |
0.011 |
82.295 |
|
| |
|
|
|
|
|
92.212 |
| Explained |
|
|
|
|
86.049 |
86.049 |
| Residual |
|
|
0.022** |
0.009 |
13.951 |
13.951 |
| Total |
|
|
0.161 |
|
100 |
100 |
Note: CI: Erreygers concentration index; Absolute: Absolute contribution; SE: Bootstrapped standard errors for the absolute contributions obtaineda bootstrapping method using 500 replications. *** p<0.01, ** p<0.05, * p<0.1
Table 3: Decomposition of concentration index for willingness to pay.
Other factors that made positive contributions to inequalities
in willingness to pay include age (3.6%), gender (0.66%),
religion (1.759%), education (7.627%), illness (0.119%),
employment status (2.671%), and being elderly (2.698%). All
positive contributions of variables show that reducing
inequalities in these variables reduces the degree of
inequalities in willingness to pay. Alternatively, eliminating
inequalities in the positive contributing variables lowers
inequalities in willingness to pay for Zambia’s national health
insurance scheme. The other factors that made negative
contributions to inequalities in willingness to pay include marital status (-3.812%), place of residence (-1.808%),
insurance status (-7.362%), children (0.999), visits (-0.435)
and total inpatient days (-0.06). Thus, all things being equal,
all negative contributions of the variables imply that the
elimination of inequality in these variables will increase the
degree of inequality in willingness to pay for the national
health insurance scheme.
The factors included in the paper explained about 86.049% of
the overall inequality in willingness to pay. The remaining
13.951% are due to unexplained factors (residual). The residuals are statistically not different from zero at the 1%
level. Figure 3 depicts the percentage of each contributing
factor to overall inequality in willingness to pay. The largest
contributor to the willingness to pay inequality is the ability to
pay factor.

Figure 3: Percentage contribution of each factor to
overall willingness to pay inequality.
Discussion
This study examined the socioeconomic inequalities in
household willingness to pay for national health insurance in
Zambia. Given low health insurance coverage and substantial
socioeconomic disparity in accessibility and afford-ability
of health care among Zambians, this is the first study
to undertake a comprehensive assessment of inequality
in household willingness to pay for national health
insurance scheme. Analyzing the population’s willingness to
contribute to financing the national health insurance scheme
is likely to have a positive influence on the success of its
implementation and its sustainability. This study finds that
willingness to pay for the scheme is more
concentrated among wealthy households in Zambia.
Thus, affluent households are more willing to pay for
national health insurance than poor households. Thus,
policymakers should ensure that willingness to pay is
evenly distributed among poor and affluent households.
Furthermore, this study set out to determine the
factors that contribute to socioeconomic inequalities in
willingness to pay, using Wagstaff, et al., decomposition.
Results from the Wagstaff, et al., decomposition
of the binary outcome variable showed that the ability to
pay proxied by per capita expenditure quintiles, which in
Zambia’s case remains indicative of socioeconomic status,
explains most of the inequality in willingness to pay.
Eliminating inequalities between non-poor and poor
households in the ability to pay would reduce inequalities in
willingness to pay for the national health insurance scheme.
The results also showed that eliminating inequalities in
educational attainment would reduce the inequalities in
willingness to pay. Dispatch, et al., explains that the poor
fail to access high school and college education in Zambia.
Thus, the government should not only make basic
education free but should also widen access to high
schools and especially colleges and universities. If this
problem is not addressed urgently, intergenerational
inequalities will continue, and less educated households
are unlikely to participate in health enhancing ventures such as participation in health insurance schemes.
Unemployment is another variable that is diverse in Zambia
across age, gender and location. Thus, it is no surprise that
employment status is among the variables that explain
inequalities in willingness to pay. This means equalizing the
distribution of employment status between non-poor and
poor households will reduce the willingness to pay for
national health insurance. Thus, the government should
venture into employment creation activities to reduce
inequalities in willingness to pay. The other factors that
significantly explained inequalities in willingness to pay
include age and having elderly members in the household. It
is not surprising that variables such as age and having elderly
household members showed an influence on inequalities in
willingness to pay. Older people generally have poor health
compared to young people. Ageing not only involves
biological changes but also reflects accumulated effects of
one’s exposure to external risks, such as poor diet, and can be
further influenced by social changes, such as isolation and
loss of loved ones. Hence, it is difficult to separate willingness
to pay for the scheme and age. Thus, in implementing
national health insurance scheme, age related inequalities
should take on greater urgency. The paper also alluded to the
fact that the elimination of gender disparities would eliminate
inequalities in the willingness to pay for the national health
insurance scheme. Gender shapes all aspects of health and
wellbeing, including the willingness to pay for the national
health insurance. This is embedded in socially and culturally
built restrictive gender norms that define roles and
opportunities for all people, affecting determinants of health,
risk behaviour and access to quality health services. As a
result, women lose out on income-generating opportunities
such as education and employment which may lead to them
not being willing to participate in any health insurance
scheme. Thus, gender equality should be an explicit goal for
the Zambian government for sustainable implementation of
the scheme.
Conclusion
The study examined socioeconomic inequalities in household
willingness to pay for national health insurance scheme in
Zambia. This study’s results established that socioeconomic
inequalities in willingness to pay are more concentrated
among affluent households. In addition, differences in per
capita expenditure accounted the most to socioeconomic
inequalities in willingness to pay. The study suggested
contributions adjusted for income and, use of exemptions or
subsidies to help the poor. Thus, to attain greater equity in
health, government should consider a policy of varying
contributions according to income or exemptions and
subsidies. In addition, policy makers should target policies that
increase the health insurance coverage of the uninsured
households to accelerate the global goals of financial
protection and universal health coverage.
Limitations
This study has several limitations. The first limitation concerns
the use of the bidding method of contingent valuation in
eliciting willingness to pay which has a number of potential
biases. Notable among them is the hypothetical bias. In this
study, hypothetical bias is less likely because a simple scenario
was provided to the respondents in the contingent valuation
questionnaire. In addition, the hypothetical bias was reduced
in that all the analyses were conducted only for the binary
outcome variable which is less likely to suffer from the
aforementioned bias.
The other limitation concerns the results the of the
decomposition analysis where it was stated that increases in
willingness to pay inequalities is desirable for crosssubsidization
to be possible. A problem arises in that it is
difficult to establish the optimal increase in inequality for
effective cross-subsidization. In other words, it is problematic
to make any judgment on what the optimal level of inequality
in willingness to pay for national health insurance should be.
Furthermore, this study is an observational study and,
therefore, does not imply causality of the findings. However,
despite these limitations, this study is important in that it
provides an understanding of the nature and drivers of
socioeconomic inequalities in willingness to pay for national
health insurance in Zambia.
Recommendations
The results of the paper confirmed that poor households are
willing to pay less for national health insurance scheme. This
reemphasizes the importance of households’ ability to pay in
designing good policies in the implementation of the scheme.
Thus, to effectively implement the scheme, the government of
Zambia needs to consider the economic status of households.
Contributions for the scheme can be set on a sliding scale
instead of flat rates. In addition, given that per capita
expenditure is the main factor that explain inequalities in
national health insurance, there is need to create employment
and income generating activities that absorb everyone
regardless of their economic status. Given that majority of
household heads are in the informal sector where incomes are
low, government should explore subsidization and variable
mechanisms of contribution collection from the informal
sector. These could include enrolment of microfinance loan
recipients through a partnership between the bank and
insurer, as piloted in Nigeria.
Ethical Approval
The Zambia statistical agency formerly central statistical office
under the provisions of the census and statistical act number
127 of the laws of Zambian granted ethical exemptions of this
study. In addition, no identifying information of individuals
was collected and only participants above the age of 16 years
were interviewed after giving informed consent.
Competing Interests
Authors declare that they have no competing interests.
Authors' Contributions
Both authors contributed to the design of the study, data
analysis, and drafting of the manuscript. Both authors have
reviewed and approved the final version of the manuscript.
Funding
The authors do declare that no funding was received from any
individuals or organization.
Availability of Data and Materials
The dataset can be collected from the Zambia statistical
agency offices.
References
- Bala MV, Mauskopf JA, Wood LL (1999) Willingness to pay as a measure of health benefits. Pharmacoeconomics. 15(1):9-18.
[Crossref] [Google Scholar] [PubMed]
- Chilufya C (2018) Zambia ’s national health insurance scheme. Health Press Zambia Bull. 2(4):5-16.
[Google Scholar]
- Dispatch A, Thomas N, Dryding D (2019) Zambians see progress on education despite persistent inequalities. Afrobarometer. 272:1-12.
[Google Scholar]
- Dong H, Kouyate B, Cairns J, Sauerborn R (2005) Inequality in willingness-to-pay for community-based health insurance. Health Policy. 72(2):149-156.
[Google Scholar]
- Ekman B (2007) Catastrophic health payments and health insurance: Some counterintuitive evidence from one low-income country. Health Policy. 83(3):304-313.
[Crossref] [Google Scholar] [PubMed]
- Erreygers G (2006) Beyond the Health Concentration Index: An atkinson alternative for the measurement of the socioeconomic inequality of health. Biol Sci. 37:759–765.
[Google Scholar]
- Johannesson M (1996) A note on the relationship between ex ante and expected willingness to pay for health care. Soc Sci Med. 42(3):305-311.
[Crossref] [Google Scholar] [PubMed]
- Kennedy E, Binder G, Waa KH, Tidhar T, Cini K, et al. (2020) Gender inequalities in health and wellbeing across the first two decades of life: An analysis of 40 low-income and middle-income countries in the Asia-Pacific region. Lancet Glob Health. 8(12):1473-1488.
[Crossref] [Google Scholar] [PubMed]
- Ministry of health (2015). Zambia household health expenditure and utilisation survey (Zhheus) 2014 final report. Ministry of health (Zambia), Lusaka, Zambia. 1-150.
- Mitchell RC (2013). Using surveys to value public goods. 1st ed. RFF Press, New York, USA. 1-484.
[Crossref] [Google Scholar]
- O’Donnell O, Wagstaff A, Lindelow M (2008). Analyzing health equity using household survey data. World bank publications, Washington DC, USA. 2008.
[Google Scholar]
- O’Donnell O, O’Neill S, Van Ourti T, Walsh B (2016) Conindex: Estimation of concentration indices. Stata Journal. 16(1):112-138.
[Google Scholar]
- Ogundeji YK, Akomolafe B, Ohiri K, Butawa NN (2019) Factors influencing willingness and ability to pay for social health insurance in Nigeria. PLoS ONE, 14(8):1–10.
[Crossref] [Google Scholar] [PubMed]
- Peterson A, Omasanjuwa E, Ambrose K, Hatt LLC (2015) Extending health insurance to informal sector workers in urban settings: Findings from a micro insurance pilot in Lagos, Nigeria. Health Fin Govern Proj. 1:1-35.
[Google Scholar]
- Vasoontara Y, Lim LY, Gordon LA, Keith CBG, Adrian CS (2010) Decomposing socioeconomic inequality for binary health outcomes: An improved estimation that does not vary by choice of reference group. BMC Research Notes. 3(57):1-8.
[Crossref] [Google Scholar] [PubMed]
- Wagstaff A (1986) The demand for health: Theory and aplications. J Epidemiol Community Health. 40(1):1-11.
[Crossref] [Google Scholar] [PubMed]
- Wagstaff A, Doorslaer EV (2003) Catastrophe and impoverishment in paying for health care: With applications to Vietnam 1993--1998. Health Econ. 934:921-934.
[Crossref] [Google Scholar] [PubMed]
Citation: Kabaso M, Booysen F (2023) Inequalities in Willingness to Pay for Zambia’s National Health Insurance Scheme. Divers
Equal Health Care. 20:011.
Copyright: © 2023 Kabaso M, et al. This is an open-access article distributed under the terms of the Creative Commons Attribution
License, which permits unrestricted use, distribution, and reproduction in any medium, provided the original author and source
are credited.