Keywords
Arterial hypertension; Hypertensive heart disease; Risk factors; Predictive index
Introduction
Arterial hypertension (HBP) is a very common condition in the world population, particularly in individuals of both sexes over 60 years of age. It is one of the most important risk factors for the development of heart conditions, so it is crucial to control hypertension to avoid heart disease [1].
In Cuba, the prevalence of HBP in the year 2011 was of 201, 2 and in Granma province it amounted to 198, 9 per 1000 inhabitants [2].
HBP should not be seen as an isolated condition because, as a result of its natural development, the risk of organ damage, impairment and death is increased significantly due to cardiovascular causes [1,3].
Among the conditions resulting from HBP which are capable of compromising target organs, hypertensive heart disease is the one with the highest morbidity and mortality. It is defined as a complex and variable group of effects which cause a chronic increase of arterial pressure in the heart, and is characterized by the presence of anatomic and biochemical signs of left ventricular hypertrophy (LVH), myocardial ischemia, diastolic or systolic ventricular dysfunction, and alterations of the heart rate [4].
It has been well established that the hemodynamic overloading produced by HBP is an important factor in the development of cardiomyocyte hypertrophy, however, there are other important pathologic processes mediated by hormones, growth factors, cytosines and other inflammatory molecules whose action on the cardiomyocyte and the rest of the cell and non-cell components of a hypertensive patient’s myocardium can explain the development of LVH and myocardial remodeling [4].
An adequate treatment can prevent target organ damage in hypertensive patients [2,5-8]. Keeping HBP under control, however, not always guarantees the prevention of target organ damage. This fact suggests that the presence of other factors increase the risk of hypertensive heart disease, and these are independent of HBP control [5,9-12].
Therefore, in spite of all the research on cardiovascular risk factors and the significance of the existing knowledge on the topic, it is necessary to continue with the study of this phenomenon due to the high incidence and prevalence of hypertensive heart disease, which increases the morbidity and mortality rates as a result of cardiovascular disease (CVD) in developed as well as in developing countries like Cuba.
For the reasons previously stated, the objective of this paper was to design and validate an index based on risk factors that allow predicting the development of hypertensive heart disease in hypertensive patients.
Methodological Design
An analytical study was carried out in which cases and controls, paired off by sex, were selected among hypertensive patients followed at the HBP Out-Patient Department of the “Carlos Manuel de Céspedes” General University Hospital, Bayamo Municipality, Granma province, Cuba, from January 1st, 2004 to December 31st, 2009.
Inclusion criteria for the selection of cases and controls
Hypertensive patients over 20 years of age with a past history of essential HBP over five years, a period of time when organ damage occurs more frequently [1,4-6,13-17].
Cases
Hypertensive patients [1], with one or more of the following diagnostic signs characteristic of hypertensive heart disease, who did not have any other cause that accounted for it: echocardiographic pattern of LVH (the Devereux’s formula [18] was used and hypertrophy was considered for values ≥ 125 g/m2 in men and ≥ 110 g/m2 in women). Diastolic dysfunction was also considered (alteration in diastolic distensibility, filling or relaxation of the left ventricle) or signs of systolic dysfunction (ejection fraction <45%), by echocardiogram [4,19,20]. And finally, atrial fibrillation that was not caused by valve disease, myocardial pathologies, myocarditis and drugs. Criteria established by the American College of Cardiology and the American Association were taken into consideration [21].
The echocardiograms were performed by two cardiologists specialized in echocardiography who have more than 15 years of experience. An ASAOTE Caris PLUS machine was used under the American Society of Echocardiography guidelines.
Controls
Hypertensive patients who did not meet the criteria defined above. Patients affected by ischemic heart disease and interventricular and auriculoventricular conduction disorders were excluded from the study because, although the role of HBP was evident, it was not the only contributing factor to hypertensive heart disease; for the same token, patients who suffered from other morbid states that might contribute to the development of this condition were also excluded.
Universe
4857 patients were seen at the HBP Out-Patient Department within a five-year period. Out of the total number of cases in the province, n=3067 patients (63, 15%) came from the urban area and n=1790 patients (36, 85%) belonged to the rural area.
To determine the sample size for paired studies the EPIDAT 3.0. software was used, taking into consideration the following parameters: 95% confidence level, 90% study power, 1:2 case-control relationship, 52,80% rate of exposed cases, 35,87% rate of exposed controls, and an odds ratio (OR: 2), as a minimal relative opportunity to be detected. A hundred and eighty-three pairs were obtained.
Simple random sampling was used to select the patients, and they were paired off by sex. The study included 1200 patients (400 cases and 800 controls). The sample was randomly split into two parts. Seventy-five per cent of the sample was used to perform univariate and multivariate analyses and to construct the predictive index, while the remaining 25% was used to validate it.
Typical history of the patients
The screening began on January 1, 2004. Patients were referred to the hospital from their community HBP consultation. Each patient was assigned a medical reference with the necessary data for the research. Each subject was interviewed and a detailed physical examination was performed separately by two different specialists who gathered all the necessary information for treatment and for the study. The patients were followed up for clinical evaluation every three months, and an echocardiogram was done every six months.
When an excluding condition appeared, the patients were excluded from the study. Each individual evaluation concluded when the patient was assigned as a case. The subjects that at the end of the selection process did not have a diagnosis of hypertensive heart disease were assigned as controls.
Delimitation and operacionalization of variables. Dependent variable: hypertensive heart disease. Independent variable: factors being evaluated as capable of bearing any influence on the development of hypertensive heart disease.
Age was treated as a dichotomic variable since patients over 65 years of age were considered exposed.
Smoking was evaluated according to two different categories: exposed smokers, those who smoked cigarettes, cigars, or pipe daily or nearly on daily basis, independently of the number of smokes per day; and ex-smokers, those who had quit the habit less than a year ago, while the non-smokers were considered unexposed. Alcoholism was considered if the patient drank more than 1 ounce of pure alcohol daily. In the case of female and underweight patients, the amount considered was 15 ml per day [22-25].
Obesity was established according to body mass index (BMI ≥ 30, weight in kilograms/height in m2) or waist circumference ≥ 102 cm for men and 88 cm for women, or both.
Patients who spent daily or nearly daily less than 25 (women) or 30 (men) minutes in leisure time activities (any exercise of similar or greater intensity than brisk walking) was considered sedentary [26,27]. The patient’s occupation was also taken into account.
Excessive sodium intake was considered when the amount of sodium in the patient’s diet was higher than 5 grams/day/per person.
The biological markers selected as possible risk factors were cholesterol, uric acid, triglycerides, HDL-cholesterol, glycemia, microalbuminuria and the cholesterol/HDL quotient.
An HITACHI 902® machine was used to measure the blood sample biomarkers, except for non-ultrasensible C-reactive protein (CRP), which was determined by the quantitative turbidimetric method. As significant values for the study the following were established: serum cholesterol >4,8 mmol/L, HDL <1,5 mmol/L, hypertriglyceridemia >1,7 mmol/L, glycemia >5,4 mmol/L, creatinine >80 μmol/L, uric acid >375 μmol/L, CRP >4,5 mg/L and cholesterol/HDL quotient >3,5.
Patients were considered to be affected by microalbuminuria if their values ranged from 0, 02 to 0, 2 g/L in 24 h [5] and the measurements were done using the Microalb-Latex technique [28].
The significant values for the quantitative variables used in the univariate analysis were established according to statistical estimates obtained by using the SPSS statistical package (box diagram and ROC curve, to determine the points of higher sensibility and specificity).
As controlled patients were defined those with arterial blood pressure under 140 and 90 mm Hg (systolic and diastolic respectively) in 100% of the determinations and uncontrolled those who did not meet the previously stated criterion [29].
Finally, the time of evolution and the HBP stage were taken into consideration. For the former, the patients were grouped into two categories: patients with an evolution time between 5 and 10 years and patients with an evolution time greater than 10 years. The latter was classified according to the Seventh Report of the NYHA.1.
Statistical analysis
The statistical analysis started with the characterization of the sample, including the description of all the variables. For the quantitative variables the means were determined (and the median was also calculated due to the presence of several variables with extreme values). The standard deviations and the minimum and maximum values of each distribution were also calculated.
Sample cases and controls were compared during the processes of index construction and validation; for the qualitative variables, Pearson’s Chi-square was calculated (Independence test) and for the quantitative variables the T-test was calculated; but when the variable distribution was similar to the normal distribution, Mann Whitney’s U was used. When the variable distribution differed from the normal distribution, the level of significance was also determined for each of them.
For the analysis of the predictive factors for hypertensive heart disease a univariate strategy was used, considering risk estimation and taking as a point of departure the OR values obtained for paired samples. OR punctual estimations and confidence intervals (95%) were obtained. Each variable was tested for the hypothesis that the population OR was really greater than two with a significance level minor than 0, 05.
The multivariate strategy was based on the adjustment of a binary logistic regression model using the “step-by-step forward” method with all the variables that proved to be risk factors in the univariate analysis. The adjustment of the logistic regression function was done using the maximum verisimilitude method. The statistical Hosmer and Lemeshow’s Chi-square adjustment goodness method was also used.
Index construction: It was thought that the index would be formed by items integrated into a total index, as a lineal combination of the individual items: I=W1X1+W2X2+…… +WKXK. Where Xi is the i-ieth variable that constitutes a risk factor in each statistical analysis and Wi is the “weight” chosen for that variable. So, the construction phase was based on the selection of the items that would be the constituent elements of the indicator and the determination of the ponderations that would be assign to each item in the lineal combination.
The index was obtained from the binary logistic regression analysis. For this, continual variables were categorized in intervals. As the most significant values were assumed those that contributed most to the model and, at the same time, were clinically significant. Each variable assumed by the model was assigned a score by amplifying its regression coefficient, after that it was multiplied by 10 and approximated to whole numbers, which were then grouped into risk categories according to morbidity. Then, risk was classified in an ordinal scale, by dividing the index distribution into four areas corresponding to percentiles 10, 50 and 90. In this way, a risk index proposal was obtained, which can be classified as an ordinal variable with four categories from highest to lowest risk (category 1 {low}: 0 to 16 points; category 2 {moderate}: 17 to 55 points; category 3 {high}: 56 to 121 points; category 4 {very high}: 122 to 176 points).
Comparison of the different models: Once the indexes were obtained, they were applied and sifted immediately. The predictive capacity was calculated for each model: sensitivity, specificity, false positive rate (1- Specificity), positive predictive value, negative predictive value, positive and negative probability coefficient and general precision of the test. The scale discrimination capacity was determined by analyzing the data obtained from the ROC curves. The predictive capacity was determined by means of the comparison of the areas under the curve in the different models. The model adjustment goodness was estimated with the Hosmer and Lemeshow’s test, with a contrast of 10 points between observed and expected results. A test value over 0,05 was considered an expression of good calibration.
Index validation: Content validity, presentation, and construction criterion were evaluated. Criterion validity was obtained only in the new group of 300 patients. Content validity and presentation: in this phase both types of validity were explored together by surveying 10 experts (clinicians and cardiologists with more than ten years of professional experience), who appraised whether the five basic requirements indices should meet were fulfilled in the study [30].
Construction validity: It was taken into consideration that the greatest morbidity corresponded to the patients classified in the highest risk categories. Association between ordinal index and risk of hypertensive heart disease was evaluated by calculating the association coefficient of ordinal and nominal variables. Index average values among patients with and without it were determined by means of t-test for independent samples.
Criterion validity: Correlation between the four-category index and an indicator of cardiovascular risk (the Framingham index) was calculated. Since the Framingham index is a quantitative index, it was divided into categories and the Kendall’s Tau-b association coefficient and Chi-square were used to calculate their possible association with the proposed index. Lineal association between the quantitative and Framingham’s index [31] with hypertensive heart disease was evaluated by means of Pearson’s correlation coefficient.
Comparison of the areas under the curve of the models was used to identify the index with greater prediction capacity. The area under each curve was estimated by punctual estimation and by 95% confidence interval. Finally, model adjustment goodness was estimated by means of the Hosmer and Lemeshow’s test.
Reliability: Equivalence was assessed by five doctors who acted as “judges” and applied separately the instrument to the 300 forms which comprised the validation sample. Concordance among “judges” was evaluated by calculating the correlation coefficients for all likely pairs of judges. For the ordinal index, the weighed kappa coefficient was determined for more than two judges, and the kappa coefficient for each level. Statistical significance was calculated for total kappa and for each individual kappa according to category.
General Cronbach’s alpha coefficient and standardized alpha were used for evaluation of internal consistency. All the statistical processing was carried out with the SPSS program, version 17.0 for Windows, except sample size, OR for paired studies, and kappa coefficients, which were calculated with the EPIDAT 3.0 program.
Esthetical considerations: The basic ethical principles for clinical and epidemiological studies were observed in the present study, which was approved by board of directors and the ethics committee of the hospital.
Bias control: Selection, classification, information, and precision biases were taken into consideration with the aim of increasing the precision and accuracy of the necessary data for the study.
Results
Age over 65 years represented 66, 08% of all the cases, with a slight predominance of male patients (50, 75%). These results coincide with the age where arterial hypertension is more frequent in Cuba. Most patients fell into the stage 1 HBP group (60, 33%) and more than half of them were controlled (60%). Our study demonstrated that a frequent and timely follow up of hypertensive patients allows a better control of them.
The greatest standard deviation of the average values were for uric acid (343.84; ± 100.06) and creatinine (79, 17; ± 25.33).
As can be seen in Table 1, only three of the variables selected showed significant differences when they were compared with the frequencies among the construction and validation groups, representing 16. This aspect was crucial since it permitted to compare the two groups with less probability of selection bias.
| |
Variables |
Construction N=900 |
Validation N=300 |
|
| |
|
Number |
% |
Number |
% |
*p |
| |
Smoking |
378 |
73,97 |
133 |
26,03 |
0,479 |
| |
Alcoholism |
244 |
65,77 |
127 |
34,23 |
0,000 |
| |
Obesity |
320 |
71,91 |
125 |
28,09 |
0,058 |
| |
Sedentarism |
430 |
75,05 |
143 |
24,95 |
0,973 |
| |
Excessive sodium intake |
318 |
68,09 |
149 |
31,91 |
0,000 |
| |
HBP control |
349 |
72,70 |
131 |
27,30 |
0,134 |
| |
Stage 2 HBP |
344 |
72,27 |
132 |
27,73 |
0,076 |
| |
Microalbuminuria |
297 |
70,54 |
124 |
29,46 |
0,009 |
| Variables |
Construction N=900 |
Validation N=300 |
|
|
| |
Mean |
†SD |
Median |
Mean |
†SD |
Median |
‡p |
| Age |
57,63 |
12,07 |
59,00 |
58,62 |
12,13 |
60,00 |
0,223 |
| Triglycerides |
1,71 |
0,75 |
1,68 |
1,71 |
0,87 |
1,55 |
0,963 |
| Glycemia |
4,69 |
0,98 |
4,60 |
4,70 |
1,05 |
4,50 |
0,822 |
| Creatinine |
78,70 |
24,81 |
76,00 |
80,85 |
28,69 |
75,00 |
0,185 |
| HDL |
1,53 |
0,52 |
1,67 |
1,52 |
0,59 |
1,72 |
0,868 |
| C/HDL |
3,94 |
3,35 |
2,77 |
4,04 |
2,58 |
2,99 |
0,148‡ |
| Uric acid |
340,64 |
101,10 |
325,00 |
354,68 |
97,08 |
3,42 |
0,055 |
| CRP |
4,14 |
1,88 |
4,10 |
4,11 |
1,79 |
3,95 |
0,846 |
| Cholesterol |
4,69 |
1,11 |
4,50 |
4,82 |
1,30 |
4,60 |
0,148‡ |
| HBPET |
19,79 |
8,83 |
18 |
19,69 |
9,02 |
19 |
0,686‡ |
*Pearson’s Chi-square (p<0,0001); † SD (Standard Deviation); ‡p was calculated using Mann Whitney’s test (non-parametric) due to the asymmetry in variable distribution. In the remaining variables p was calculated using t test C/HDL: Cholesterol/HDL; CRP: C-Reactive Protein; HBPET: Arterial Hypertension Evolution Time
Table 1: Clinical and demographic characteristics of the study population.
Table 2 represents the results of the univariate analysis of the qualitative variables, except for alcoholism (OR=1,187; p=0,240); the rest of the variables had an OR significantly higher than two. Alcoholism is not frequent in most subjects with chronic conditions, at least in our context. The remaining variables had an important association with the risk of developing cardiopathy.
| Variables |
Number of exposed pairs |
OR |
Confidence Interval
(CI 95%) |
*p |
| Cases |
Controls |
| % |
% |
| No HBP control |
290 84,5 |
53 15,5 |
5,471 |
3,844-7,829 |
0,000 |
| Stage 2 HBP |
287 83,2 |
58 16,8 |
4,948 |
3,523-6,982 |
0,000 |
| Microalbuminuria |
276 81,7 |
62 18,3 |
4,451 |
3,195-6,226 |
0,000 |
| Smoking |
223 69,5 |
98 30,5 |
2,275 |
1,711-3,029 |
0,000 |
| Excessive sodium intake |
220 67,5 |
106 32,5 |
2,075 |
1,572-2,743 |
0,000 |
| Obesity |
216 67,3 |
105 32,7 |
2,057 |
1,555-2,723 |
0,000 |
| Sedentarism |
211 67,0 |
104 33,0 |
2,028 |
1,531-2,691 |
0,000 |
| Alcoholism |
114 54,3 |
96 45,7 |
1,187 |
0,855-1,649 |
0,240 |
*0,000 indicates p<0,001
Table 2: Results of the univariate analysis of qualitative variables.
The univariate analysis of the quantitative variables, represented in Table 3, shows that all of them had ORs significantly higher than two. The most important factor was CRP, which increased the risk to develop hypertensive cardiopathy 9, 82 times (CI 95%=6, 44-15, 14; p=0, 0000) when its values were higher than 4, 5 UI/L. This result is not casual since the importance of inflammation is well known in the development of atherosclerosis and cardiovascular complications.
| Variables |
Number of exposed pairs |
OR |
Confidence Interval
(CI 95%) |
*p |
| Cases |
Controls |
| % |
% |
| C-reactive protein |
344 90,8 |
35 9,2 |
9,828 |
6,449-15,140 |
0,000 |
| Cholesterol |
268 85,9 |
44 14,1 |
6,090 |
4,142-9,021 |
0,000 |
| HBP evolution time>10 years |
325 85,3 |
56 14,7 |
5,803 |
4,125-8,205 |
0,000 |
| Cholesterol/HDL |
284 84,8 |
51 15,2 |
5,568 |
3,886-8,024 |
0,000 |
| Glycemia |
271 84,4 |
50 15,5 |
5,420 |
3,766-7,846 |
0,000 |
| Creatinine |
273 81,5 |
62 18,5 |
4,403 |
3,159-6,161 |
0,000 |
| HDL |
266 80,9 |
63 19,1 |
4,222 |
3,034-5,899 |
0,000 |
| Uric acid |
229 76,3 |
71 26,7 |
3,225 |
2,341-4,456 |
0,000 |
| Age>65 years |
313 73,8 |
111 26,2 |
2,819 |
2,177-3,656 |
0,000 |
| Triglycerides |
228 72,6 |
86 27,4 |
2,651 |
1,968-3,577 |
0,000 |
* 0,000 indica p<0,001
Table 3: Results of the univariate analysis of the quantitative variables.
The logistic regression model adjusted by the “step-by-step forward” method (Table 4) showed that CRP was the factor with the greatest independent relation and statistical significance for the risk to develop hypertensive cardiopathy (OR=10, 98; CI 95%=6.350-19,002; p=0,000), followed by glycemia (OR=5, 01; CI 95%=2,907-8,635; p=0,000). C-reactive protein is a biological marker of active vascular processes, which has a direct action on heart function and morphology and thus contributes to the prognosis of a hypertensive patient. These aspects justify their findings in the present study.
| Variables (step 13) |
*B |
DE |
†Wald |
p |
OR |
CI=95,0% |
| Inferior |
Superior |
| C-reactive Protein |
2,397 |
0,280 |
73,461 |
0,000 |
10,985 |
6,350 |
19,002 |
| Glycemia |
1,612 |
0,278 |
33,676 |
0,000 |
5,010 |
2,907 |
8,635 |
| Cholesterol |
1,587 |
0,291 |
29,670 |
0,000 |
4,889 |
2,762 |
8,654 |
| Microalbuminuria |
1,550 |
0,271 |
32,729 |
0,000 |
4,713 |
2,771 |
8,017 |
| >10 years of HBP evolution time |
1,550 |
0,280 |
30,630 |
0,000 |
4,711 |
2,721 |
8,156 |
| Uric acid |
1,548 |
0,287 |
29,158 |
0,000 |
4,704 |
2,682 |
8,252 |
| No control of HBP |
1,494 |
0,273 |
29,844 |
0,000 |
4,453 |
2,606 |
7,611 |
| Stage 2 HBP |
1,431 |
0,269 |
28,206 |
0,000 |
4,181 |
2,466 |
7,089 |
| Creatinine |
1,238 |
0,271 |
20,837 |
0,000 |
3,448 |
2,027 |
5,868 |
| HDL |
1,006 |
0,273 |
13,583 |
0,000 |
2,734 |
1,601 |
4,668 |
| Excessive sodium intake |
0,811 |
0,285 |
8,097 |
0,004 |
2,250 |
1,287 |
3,933 |
| >65 years of age |
0,769 |
0,293 |
6,870 |
0,009 |
2,158 |
1,214 |
3,835 |
| Smoking |
0,637 |
0,272 |
5,479 |
0,019 |
1,890 |
1,109 |
3,221 |
| Constant |
-27,235 |
2,011 |
183,454 |
0,000 |
0,000 |
|
|
Hosmer and Lemeshow Test X2=3,510; degrees of freedom=8; p=0,898
*Model estimated coefficients which express the likelihood of developing the disease as suggested by the variables. †Standardized coefficients
Table 4: Multivariate logistic regression model. Results of the step-by-step regression (forward method).
Index construction
The index was constructed following a process of selection of variables and their scores using the amplification of the regression quotients obtained by the “step-by-step forward” method (Table 5). This method was chosen to guarantee more accuracy compared to the odds ratio values. In this way a quantitative variable was obtained.
| Items |
Index |
| Present |
Absent |
| C-reactive protein |
24 |
0 |
| Cholesterol |
16 |
0 |
| >10 years of HBP evolution time |
15 |
0 |
| No control of HBP |
15 |
0 |
| Glycemia |
16 |
0 |
| Stage 2 HBP |
14 |
0 |
| Microalbuminuria |
15 |
0 |
| HDL |
10 |
0 |
| Creatinine |
14 |
0 |
| Uric acid |
15 |
0 |
| >65 years of age |
8 |
0 |
| Smoking |
6 |
0 |
| Excessive sodium intake |
8 |
0 |
| Total |
176 |
0 |
Table 5: Weighting of variables obtained from the selection process.
Table 6 shows that the index average values were significantly higher in the cases (106,266; p=0,000) than in the controls, disclosing a linear relationship, that is, the higher the punctuation the higher the probability of developing hypertensive cardiopathy.
| Index |
N |
Media |
Standard Deviation |
t* |
p‡ |
| Complex |
Hypertensive YesHeart disease No |
300600 |
106,26641,635 |
24,59723,298 |
38,50 |
0,000 |
*T test (p<0,0001)
Table 6: Comparison of averaged values of patients’ indexes.
The relation between the ordinal index and the risk to develop hypertensive cardiopathy (Table 7) was demonstrated by the Eta coefficient value (0,726). 98% of the cases were assigned to categories 3 and 4, which are the categories with greater risk. The approximation of the coefficient to 1 indicates that there is an association between the risk categories and the probability of developing hypertensive cardiopathy.
| Categories |
Hypertensive Heart disease |
Total % |
| Cases % |
Controls % |
| Complex Index |
| Low risk |
0 |
0 |
102 |
10,5 |
102 |
11,3 |
| Moderate risk |
6 |
2,0 |
342 |
51,0 |
348 |
38,7 |
| High risk |
205 |
68,3 |
156 |
38,0 |
361 |
40,1 |
| Very high risk |
89 |
29,7 |
0 |
0 |
89 |
9,9 |
| Total |
300 |
100 |
600 |
100 |
600 |
100 |
Coefficient: Eta=0,726
Table 7: Relation between the index categories and risk of developing hypertensive heart disease.
Figure 1 represents the index prediction capacity to develop hypertensive cardiopathy. The area under the ROC curve was of 0,967 (CI 95% 0,957-0,977; p: 0,000). It shows that the index is a practical tool to discriminate which hypertensive patients will develop hypertensive cardiopathy and which will not.

Figure 1: Evaluation of predictive capacity of hypertensive heart disease predictive index. Construction process.
As can be seen in Table 8, the index has a high sensitivity (98%) and an adequate specificity (74%). The high negative predictive value (98, 67) indicates that it is unlikely that the instrument classifies as a low-risk an individual with high probability of developing hypertensive cardiopathy, a crucial aspect in patient evaluation.
| Parameters |
Confidence Interval
CI=95% |
| Inferior |
Superior |
| Patients correctly diagnosed |
82,00% |
79,30 |
84,42 |
| Sensitivity |
98,00% |
95,48 |
99,18 |
| Specificity |
74,00% |
70,26 |
77,43 |
| Positive predictive value |
65,33% |
60,71 |
69,69 |
| Negative predictive value |
98,67% |
96,97 |
99,46 |
| Positive probability coefficient |
3,77 |
3,29 |
4,32 |
| Negative probability coefficient |
0,03 |
0,01 |
0,06 |
Table 8: Predictive capacity of hypertensive heart disease predictive index. Construction Process.
The index (Table 9) also had an adequate calibration as the Hosmer and Lemeshow test shows (p: 0,871).
| Steps |
Healthy |
Diseased |
Total |
| Observed |
Expected |
Observed |
Expected |
| 1 |
91 |
90,431 |
0 |
0,569 |
91 |
| 2 |
86 |
87,203 |
6 |
4,797 |
92 |
| 3 |
66 |
67,573 |
23 |
21,427 |
89 |
| 4 |
33 |
32,471 |
51 |
51,529 |
84 |
| 5 |
18 |
14,417 |
75 |
78,583 |
93 |
| 6 |
5 |
4,702 |
80 |
80,298 |
85 |
| 7 |
1 |
2,064 |
97 |
95,936 |
98 |
| 8 |
0 |
0,787 |
91 |
90,213 |
91 |
| 9 |
0 |
0,270 |
88 |
87,730 |
88 |
| 10 |
0 |
0,083 |
89 |
88,917 |
89 |
Hosmer and Lemeshow test X2=3,839; degrees of freedom=8; p=0,871
Table 9: Comparison between observed and expected morbidity in the index. Construction process.
Validation
Table 10 presents the results obtained when the index components were evaluated by the specialists, as part of the presentation and content validity analysis. It stands out that 80% of them considered that the content could be obtained from available data and the components were clearly defined.
| Content |
None
No. % |
Moderate
No. % |
A lot
No. % |
| Reasonable and understandable |
0 0 |
3 30,0 |
7 70,0 |
| Sensitive to variations of the phenomenon measured |
0 0 |
5 50,0 |
5 50,0 |
| Justifiable basic suppositions |
0 0 |
4 40,0 |
6 60,0 |
| Clearly defined components |
0 0 |
3 30,0 |
7 70,0 |
| Obtainable from available data |
0 0 |
2 20,0 |
8 80,0 |
Table 10: Index components content and presentation validity according to experts’ opinions.
The validity criterion showed the significant statistic relation between the categories of the proposed index and the categories of Framingham index. The association coefficient (Tau b) was 0,366 (Table 11).
| Index categories |
| Hypertensive heart disease |
1 |
2 |
3 |
4 |
Total |
| Yes |
Framingham’s index categories |
1 |
0 |
0 |
2 |
0 |
2 |
| 2 |
0 |
3 |
26 |
3 |
32 |
| 3 |
0 |
0 |
28 |
17 |
45 |
| 4 |
0 |
0 |
9 |
12 |
21 |
| Total |
0 |
3 |
65 |
32 |
100 |
| No |
Framingham’s index categories |
1 |
5 |
20 |
5 |
0 |
30 |
| 2 |
11 |
50 |
34 |
0 |
95 |
| 3 |
5 |
27 |
34 |
1 |
67 |
| 4 |
0 |
5 |
3 |
0 |
8 |
| Total |
19 |
102 |
76 |
1 |
200 |
X2=67,17; p<0,001; Tau-b=0,366
>
Table 11: Relation between the ordinal index and Framingham’s index with hypertensive heart disease risk.
The proposed index, in its purely quantitative way, showed a lineal and statistically-significant correlation (p: 0,000) with the Framingham index, as it was demonstrated by the value of the Pearson’s correlation coefficient (0,504), so the higher the scores the higher the risk of developing the condition.
As can be seen in Figure 2, when the proposed index prediction capacity was compared to the Framingham index during the validation process, both had a good capacity to discriminate which patients might develop hypertensive heart disease from those who might not, but the former had a better predictive value with an area under the ROC curve very close to 1 (0,957). Nevertheless, the Framingham index, which was not designed to predict the development of this cardiopathy, can also be used to this purpose (area under the curve: 0,716).
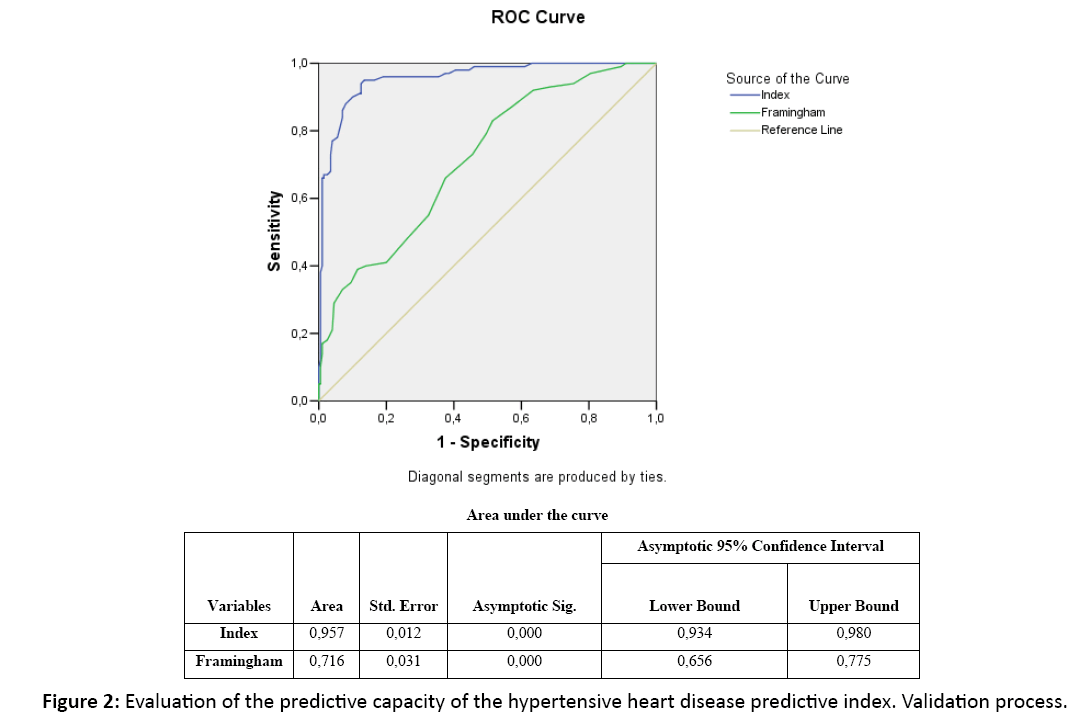
Figure 2: Evaluation of the predictive capacity of the hypertensive heart disease predictive index. Validation process.
An adequate relation between observed and expected cases at all risk levels are shown in Table 12. Hosmer and Lemeshow’s test shows a good calibration (p: 0, 0,783). This demonstrates that the scale prediction is observable in the researched population, so the index can be generalized.
| Steps |
Healthy |
Diseased |
Total |
| Observed |
Expected |
Observed |
Expected |
| 1 |
28 |
28,492 |
1 |
0,508 |
29 |
| 2 |
28 |
28,295 |
3 |
2,705 |
31 |
| 3 |
24 |
22,298 |
7 |
8,702 |
31 |
| 4 |
13 |
12,396 |
16 |
16,604 |
29 |
| 5 |
3 |
4,935 |
27 |
25,065 |
30 |
| 6 |
2 |
2,034 |
29 |
27,966 |
30 |
| 7 |
1 |
0,946 |
28 |
29,054 |
30 |
| 8 |
1 |
0,412 |
29 |
29,588 |
30 |
| 9 |
0 |
0,147 |
30 |
29,853 |
30 |
| 10 |
0 |
0,045 |
30 |
29,955 |
30 |
Hosmer and Lemeshow test X2=4,762; degrees of freedom=8; p=0,783
Table 12: Comparison between observed and expected morbidity in the complex index. Validation process.
The value of the R reliability coefficient showed that the greatest part of the variation was significantly due to the patients (R=0,704; p=0,000) and not to the index items, which indicates a greater reliability. The correlation coefficients for all the pairs of observers were greater than 0,965 (p: 0,000).
Concordance was present in the 10 pairs of “judges,” for all categories (all greater than 0), total kappa coefficient was 0,975 (p<0,001). These results speak of the easy of application of the index.
Cronbach’s alpha coefficient to evaluate internal consistency was 0,637 (Table 13). Until a new index to his purpose appears and demonstrates to have better internal consistency, our proposal can be used for the evaluation of the hypertensive patient.
| Variables |
Item-total corrected correlation |
Determination Coefficient |
Alpha after variable elimination |
| >10 years of HBP evolution time |
0,479 |
0,218 |
0,597 |
| No control of HBP |
0,456 |
0,141 |
0,611 |
| Cholesterol |
0,430 |
0,115 |
0,611 |
| Stage 2 HBP |
0,426 |
0,111 |
0,611 |
| Glycemia |
0,419 |
0,101 |
0,614 |
| HDL |
0,400 |
0,118 |
0,615 |
| C-reactive protein |
0,395 |
0,210 |
0,616 |
| >65 years of age |
0,385 |
0,088 |
0,618 |
| Microalbuminuria |
0,374 |
0,099 |
0,619 |
| Creatinine |
0,363 |
0,145 |
0,625 |
| Uric acid |
0,353 |
0,041 |
0,631 |
| Smoking |
0,344 |
0,080 |
0,634 |
| Excessive sodium intake |
0,341 |
0,116 |
0,635 |
Cronbach Alpha Coefficient: 0,637; Alpha standardized items: 0,655
Table 13: Elements of the internal consistency for the complex index. Construction process.
Discussion
Hypertensive heart disease is one of the most frequent, important and earliest complications found in hypertensive patients and it is associated to a high mortality [1,4-6], so an early identification of risk factors is useful to take measures to prevent the disease.
The findings in the present series are explained by the complex relation between several risk factors and the likelihood of developing hypertensive heart disease, due to different physiopathologic mechanisms which have a blurry interaction among them [4,32-35]. Other authors have also concluded that there is a relationship between the factors studied and the development of hypertensive heart disease. Although the role of the hemodynamic overload exerted by HBP on the myocardium has been acknowledged, there are other factors that have an independent relation with the development of this entity [36- 40], a fact that appoints them as risk predictors.
An index based on the predictive factors found in the present series, has not been evaluated for hypertensive heart disease. In a study to estimate cardiovascular risk in a Cuban population, De la Noval García [41] found that the cardiovascular risk prediction tables of the WHO/ISH, underestimates this risk in the Cuban population.
Ang [42] validates a clinical scale to identify HVI by echocardiogram; the study comprised only a limited number of factors, so the use of this scale in our country may result in underestimation of risk in the Cuban population.
In a previous study carried out by the present authors, an index to evaluate this risk was published but it had a lower discriminating capacity, despite the fact that a larger number of factors were taken into consideration and a univariate analysis was done.
To solve this problem, an index was constructed and validated to predict the risk of developing hypertensive heart disease that suited the context where the research was carried out and a morbidity probabilistic need in vulnerable populations.
The construction process demonstrated that the proposed index has the necessary capacity to predict the risk of developing hypertensive heart disease. It should be pointed out that the high negative predictive values indicate that it is not likely that the index classifies individuals who get the condition as low risk.
For the determination of the presentation and content validity, the recommendations found in the literature [43] were taken into consideration and satisfactory results were obtained.
Construction validity was corroborated because it was shown that the higher risk categories are included in the majority of the cases; criterion validity was demonstrated by comparing the index with a version of Framingham’s index. The proposed scale had a higher discriminating capacity, perhaps due to the fact that a larger number of variables were studied, based on up-to-date physiopathologic knowledge and new hypertensive heart disease risk factors [4,44-46] and assuming significant values based on higher sensitivity and specificity for the biological variables, keeping in mind the characteristics of the population studied, without extrapolation from foreign studies.
The correlation coefficients obtained from concordance between judges and kappa were adequate according to the literature [43,47,48]. The results showed that after a brief training period, the doctors who provide care for hypertensive patients can use the index to predict hypertensive heart disease with a minimal error probability.
The index had an adequate internal consistency. Although Cronbach’s alpha coefficient did not reach high enough values, it was not considered invalidating since a scale used for research purposes is valid with values of 0, 5 or higher [49].
This predictive index can be used as a clinical and epidemiological surveillance tool, because it is a valuable aid to identify subjects with higher probabilities of developing a disease and to stratify risk.
The theoretical contribution of the present study consists in the identification of the pathogenic value of a group of risk factors for the development of hypertensive cardiopathy, as well as the construction of an index based on the most important factors, which due to their excellent predictive capacity can be used in clinical practice to foresee the development of the condition. The novelty consists on the fact that the index is authentic and unique to predict the incidence of hypertensive cardiopathy; it neither reproduces nor complements existing scales for the evaluation of cardiovascular risk.
As part of the practical significance and clinical application of the study it can be said that we provide an index that is based on data obtained easily, with a minimum of resources and it can be adapted to any circumstance; furthermore, its appropriate use in the health care system makes possible to estimate accurately the risk of developing hypertensive cardiopathy in hypertensive patients, both in primary and secondary health care.
Another aspect of practical implication in this study is the selection of cutpoints of greater sensitivity and specificity for the biological variables to predict the condition in studied population, a fact that does not limit its extrapolation to the rest of the country and other parts of the world.
Conclusion
The present study demonstrates the greater pathogenic value of C reactive protein, glycemia, cholesterol and time of evolution of arterial hypertension in the development of hypertensive cardiopathy.
The index constructed and validated, based on the most important risk factors, demonstrated an excellent discriminative capacity. The index calibration and reliability were also adequate.
For the reasons stated above, we recommend to include the index created and validated in the National Guide of Arterial Hypertension to test its usefulness and efficiency, and to use it in the stratification of the risk to develop hypertensive cardiopathy.
We also recommend to consider the follow up of patients with arterial hypertension at primary and secondary health care levels, bearing in mind the identified risk factors to prevent the development of hypertensive cardiopathy; and, finally, use in the stratification of risk for hypertensive cardiopathy, the value of the new cutpoints obtained from the biologic variables to predict this condition in patients with arterial hypertension.
In spite of the present results, the authors would like to continue improving the index in a future study by improving the validation process with a greater number of subjects in a ten-year cohort.
Limitations
Among the limitations of this study we can point out that it was not possible to study the new predictors of cardiovascular risk such as hypersensitive C reactive protein, endostatin, homocysteine, among others. Likewise, it was not possible to measure the excretion of urine sodium to evaluate salt ingestion more objectively
Authors' Contributions
AA conceived of the study, participated in its design and coordination, and performed the statistical analysis. JG, LM, AF and AQ participated in the sequence alignment. All authors read and approved the final manuscript.
References
- The seventh report of the joint national committee on prevention, detection, evaluation and treatment of high blood pressure. JAMA 2003; 289: 2560-2571.
- Oficina Nacional de Estadísticas e Información. Anuario Estadístico de Salud, Cuba 2012.
- Sociedad Española de Hipertensión-Liga Española para la Lucha contra la Hipertensión Arterial SEH-LELHA. Guía sobre el diagnóstico y el tratamiento de la hipertensión arterial en España 2005. Hipertensión 2005; 22: 1-84.
- Díez J, Frohlich ED. A translational approach to hypertensive heart disease. Hypertension. 2010; 55: 1-8.
- Mancia G, Laurent S, Agabiti-Rosei E, Ambrosioni E, Burniere M, et al. Reappraisal of European guidelines on hypertension management: A European Society of Hypertension Task Force document. J Hypertens 2009; 27: 1-38.
- Mancia G, De Backer G, Dominiczak A, Cifkova R, Fagard R, et al. Guidelines for the management of arterial hypertension: The task force for the management of arterial hypertension of the European Society of Hypertension (ESH) and of the European Society of Cardiology (ESC). J Hypertens. 2007; 25: 1105-1187.
- Maione A, Annemans L, Strippoli G. Proteinuria and clinical outcomes in hypertensive patients. Am J Hypertens. 2009; 22: 1137-1147.
- Sierra C, de la Sierra A. Early detection and management of the high-risk patient with elevated blood pressure. Vasc Health Risk Manag. 2008; 4: 289-296.
- Tzoulaki I, Murray GD, Lee AJ, Rumley A, Lowe GDO, et al. Relative value of inflammatory, hemostatic, and rheological factors for incident myocardial infarction and stroke: The Edinburgh Artery Study. Circulation. 2007; 115: 2119-2127.
- Alfonso Guerra JP. Daño en órganos relacionados con la hipertensión arterial. Factores de riesgo modificables. Hipertensión arterial en la atención primaria de salud. Editorial Ciencias Médicas, La Habana 2009; 129-139.
- Sharman JE. New insights into cardiovascular risk from the exercise central waveform. Artery Res 2009; 2: 132-137.
- Tocci G, Valenti V, Scierretta S, Volpe M. Multivariate risk assessment and risk score cards in hypertension. Vasc Health Risk Manag. 2007; 3: 313-320.
- Tousoulis D, Koumallos N, Antoniades C, Antonopoulos AS, Bakogiannis B, et al. Genetic polymorphism on type 2 receptor of angiotensin II, modifies cardiovascular risk and systemic inflammation in hypertensive males. Am J Hypertens 2010; 23: 237-242.
- García Barreto David, Álvarez González Julio, García Fernández Raymid, Valiente Mustelier Juan, Hernández Cañero Alberto. La hipertensión arterial en la tercera edad. Rev Cubana Med. 2009; 48.
- Diamond JA, Phillips RA. Hypertensive heart disease. Hypertens Res. 2005; 28: 191-202.
- Mitchell JA, Ventura HO, Mehra MR. Early recognition and treatment of hypertensive heart disease. CurrOpinCardiol 2005; 20: 282-289.
- López B, González A, Querejeta R, Díez J. The use of collagen derived serum peptides for the clinical assessment of hypertensive heart disease. J Hypertens 2005; 23: 1445-1451.
- Devereux RB, Reichek N. Echocardiographic determination of left ventricular mass in man. Anatomic validation of the method. Circulation.1977; 55: 613-618.
- Graf K, Schaefer-Graf UM. Is Smad3 the key to inflammation and fibrosis in hypertensive heart disease? Hypertension. 2010; 55: 1088-1089.
- Khouri MG, Peshock RM, Ayers CR, de Lemos JA, Drazner MH. A 4-tiered classification of left ventricular hypertrophy based on left ventricular geometry: The Dallas Heart Study. Circ Cardiovasc Imaging. 2010; 3: 164-171.
- Fuster V, Rydén LE, Cannom DS, Crijns HJ, Curtis AB, et al. ACCF/AHA/HRS focused updates incorporated into the ACC/AHA/ESC 2006 guidelines for the management of patients with atrial fibrillation. J Am Coll Cardiol 2011; 123: 104-123.
- Klatsky AL. Alcohol and cardiovascular mortality. Common sense and scientific truth. J Am Coll Cardiol. 2010; 55: 1336-1338.
- Simona Costanzo S, Di Castelnuovo A, Donati MB, Iacoviello L, de Gaetano G. Alcohol consumption and mortality in patients with cardiovascular disease. A meta-analysis. J Am Coll Cardiol 2010; 55: 1339-1347.
- Zimmermann-Viehoff F, Weber C, Merswolken M, Rudat M, Deter H-C. Low anxiety males display higher degree of salt sensitivity, increased autonomic reactivity and higher defensiveness. Am J Hypertens 2008; 21: 1292-1297.
- Silla Stoel M, Rosón Hernández B. Evaluación del consumo de alcohol y diagnóstico de patrón de consumo. Trastornos Adictivos. 2009; 11: 191-199.
- Cabrera de León A, Rodríguez-Pérez C, Rodríguez-Benjumeda M, Anía-Lafuente B, Brito-Díaz B, et al. Sedentarismo: Tiempo de ocio activo frente a porcentaje del gasto energético. RevEspCardiol 2007; 60: 244-250.
- Organización Mundial de la Salud. Health and development through physical activity and sport. WHO 2003.
- https://www.gdsrl.com/upload/prodotti/gd8439_00_microalbumin_1.pdf
- Pérez Caballero MD, Dueñas Herrera A, Alfonso Guerra JP, Vázquez Vigoa A, Navarro Despaigne D, et al. Hipertensión arterial. Guía para la prevención, diagnóstico y tratamiento. Comisión Nacional Técnica Asesora del Programa de Hipertensión Arterial. La Habana: Editorial Ciencias Médicas 2008.
- Moriyama IM. Problems in the measurement of health status. Indicators of social change: Concepts and measurements. Rusell Sage foundation, New York 1968: 573-599.
- D'Agostino RB, Grundy S, Sullivan LM, Wilson P; The CHD Risk Prediction Group. Validation of the Framingham coronary heart disease prediction scores: Results of a multiple ethnic groups investigation. JAMA 2001; 286: 180-187.
- HeribertSchunkert H, Samani NJ. Elevated C-reactive protein in atherosclerosis chicken or egg? N Engl J Med 2008; 359: 1953-1955.
- Tomiyama H, Matsumoto C, Yamada J, Yoshida M, Odaira M, et al. Predictors of progression from prehypertension to hypertension in Japanese men. Am J Hypertens. 2009; 22: 630-636.
- De Marco M, de Simona G, Roman MJ, Chinali M, Lee ET, et al. Cardiovascular and metabolic predictors of progression of prehypertension into hypertension: The strong heart study. Hypertension 2009; 54: 974-980.
- Álvarez Aliaga A, González Aguilera JC. Algunos factores de riesgo de la cardiopatía hipertensiva. Rev Cubana de Med. 2009; 48: 139-151.
- Ridker PM, Nina P, Paynter NP, Rifai N, Gaziano JM, et al. C-reactive protein and parental history improve global cardiovascular risk prediction the Reynolds risk score for men. Circulation. 2008; 118: 2243-2251.
- Piskorz D, Quaglino M, Pigozzi F, Vitelleschi M. Importancia de las variables no hemodinámicas en el desarrollo de hipertrofia ventricular izquierda en hipertensión. Rev Fed Arg Cardiol 2010; 39: 288-293.
- Zhang R, Zhang YY, Huang XR, Wu Y, Chung AC, et al. C-reactive protein promotes cardiac fibrosis and inflammation in angiotensin II-induced hypertensive cardiac disease. Hypertension. 2010; 55: 953-960.
- Nagai T, Anzai T, Kaneko H, Mano Y, Anzai A, et al. C-reactive protein overexpression exacerbates pressure overload-induced cardiac remodeling through enhanced inflammatory response. Hypertension 2011; 57: 208-215.
- Wende AR, Abel ED. Lipotoxicity in the heart. Biochim Biophys Acta 2010; 1801: 311-319.
- De la Noval García R, Armas Rojas NB, de la Noval González I, Fernández González Y, Pupo Rodríguez HB, et al. Estimación del riesgo cardiovascular global en una población del área de salud Mártires del Corynthia Ciudad Habana, Cuba. Rev Cubana Cardiol Cir Cardiovasc 2011; 17: 62-68.
- Ang DSC, Fahey TP, Wright GA, Struthers AD. Development and validation of a clinical score to identify echocardiographic left ventricular hypertrophy in patients with cardiovascular disease. Am J Hypertens 2008; 21: 1011-1017.
- Streiner DL, Norman GR. Health measurement scales. A practical guide to their development and use. Oxford University Press, Oxford 1989; 144-161.
- Creemers EE, Pinto YM. Molecular mechanisms that control interstitial fibrosis in the pressure-overloaded heart. Cardiovasc Res 2011; 89: 265-272.
- Drazner MH. The progression of hypertensive heart disease. Circulation 2011; 123: 327-334.
- Drazner MH, Rame JE, Marino EK, Gottdiener JS, Kitzman DW, et al. Increased left ventricular mass is a risk factor for the development of a depressed left ventricular ejection fraction within five years: The cardiovascular health study. J Am Coll Cardiol 2004; 43: 2207-2215.
- Jiménez RE, Vázquez J, Fariñas H. Construcción y validación de un índice de gravedad de la enfermedad para pacientes hospitalizados en áreas clínicas. GacSanit. 1997; 11: 122-130.
- Feinstein AR, Cicchetti DV. High agreement but low kappa I: The problem of two paradoxes. J Clin Epidemiol 1990; 43: 543-549.
- García Cadena CH. La medición en las ciencias sociales y la psicología, en estadística con SPSS y metodología de la investigación de René Landeros Hernández y Mónica T González Ramírez. Trillas (comp), México 2006.

