Research Article - (2023) Volume 31, Issue 1
Forgotten “Primum Non Nocere” and Increased Mortality after Covid-19 Vaccination
Amrit Srečko Šorli1*,
Tomaž Makovec2,
Živan Krevel3 and
Rado Gorjup4
1Department of Medical Sciences, Bijective Physics Institute, Slovenia
2Institute of Biochemistry and Molecular Genetics, Faculty of Medicine, University of Ljubljana, Slovenia
3Department of Medical Sciences, Homeopatic Center Krevel, Slovenia
4Department of Medical Sciences, ITR-Institute for Trans-disciplinary Research and Development, Slovenia
*Correspondence:
Amrit Srečko Šorli,
Department of Medical Sciences, Bijective Physics Institute,
Slovenia,
Email: ,
Received: 31-Jan-2023, Manuscript No. IPQPC-23-15790;
Editor assigned: 02-Feb-2023, Pre QC No. IPQPC-23-15790 (PQ);
Reviewed: 16-Feb-2023, QC No. IPQPC-23-15790;
Revised: 21-Feb-2023, Manuscript No. IPQPC-23-15790 (R);
Published:
28-Jan-2023, DOI: 10.36648/1479-1064.23.31.06
Abstract
Background: The main impetus behind the worldwide COVID-19 vaccination campaign in 2021 was to reduce the mortality attributed to SARS-CoV-2 infection in the preceding year. Nevertheless, rigorous analyses of the mortality benefits conferred by this massive vaccination effort have been lacking.
Methods: Statistics offers us an essential methodological approach for measuring the impacts of COVID-19 vaccination on public health. The mathematical relation between vaccinated alive groups can be repeated between vaccinated dead groups with relatively high statistical reliability because of the large population numbers involved. This method also confers greater statistical usefulness because it eliminates the Simpson effect.
Results: Calculations were performed for each of the following 5-4 week intervals: weeks 35-38 (2021), weeks 39-42 (2021), weeks 43-46 (2021), weeks 47-50 (2021), and weeks 50(2021)-1(2022). The results obtained confirm that the mortality of the vaccinated coronavirus infected groups was 14.5% higher on average than the mortality of non-vaccinated coronavirus infected groups.
Conclusion: Vaccinated infected groups appear to have higher average mortality than their non-vaccinated infected counterparts. The findings suggest the legitimacy of extending the statistics between vaccinated livings and vaccinated dead individuals for different age groups. Calculating the impact of COVID-19 vaccination on the mortality rate is a necessary step towards satisfying the first principle of medicine: “Primum non nocere”, “First do no harm”.
Keywords
COVID-19 vaccination; Death rate; Sick status days; Excess mortality rate
Introduction
The main public health rationale for the worldwide COVID-19
vaccination in 2021 was to reduce the large scale mortality
that had been attributed to widespread infection by the novel
coronavirus, SARS-CoV-2, beginning in the spring of 2020.
The central research question to be answered in this paper
is whether the COVID-19 vaccinations are saving more lives
from COVID-19 infection, or whether these vaccinations are
causing excess deaths due to lethal adverse events following
the inoculation. In theory, COVID-19 vaccination should markedly
reduce the number of COVID-19 related deaths in comparison
to COVID-19 related deaths among the unvaccinated.
Indeed, theoretical research published in 2021 estimated that
COVID-19 vaccination will reduce the mortality rate [1]. The
public health argument for ongoing vaccinations is based largely on this assertion.
Soon after the vaccination campaign began, however, many
medical professionals argued that infection by the coronavirus
would provide sufficient natural immunity to afford sufficient
protection against subsequent infectious diseases in the form
of COVID-19 Gazid and colleagues demonstrated that natural
infection by SARS-CoV-2 confers antiviral adaptive immunity
superior to that afforded by COVID-19 vaccination [2]. Furthermore,
the healthcare workers expressed a logical, evidence informed
concern that the COVID-19 vaccination, which was being
mandated for hospital personnel in many countries, might
lead to adverse outcomes for individuals previously infected by
SARS-CoV-2. These concerns can be traced back to as early as
2012 when laboratory mice developed severe pulmonary immunopathology
after being vaccinated and then exposed to the
SARS coronavirus [3]. A decade later, other mouse data linked
the mRNA lipid nano-particle based COVID-19 vaccine platform
to the phenomena of adaptive immune cell exhaustion and
non-responsiveness, both secondary to the chronic stimulation
of immune-inflammatory pathways [4].
Well-designed human studies to address the question of a
combined impact of coronavirus infection and subsequent
COVID-19 vaccination are lacking. However, a recent study by
Otto and colleagues concluded that COVID-19 infection can
cause severe disease and death in vaccine recipients, particularly
in older adults and those with comorbidities [5]. Given the
fact that SARS-CoV-2 viral variants are highly transmissible and
have already infected the majority of the population in western
countries, such concerns regarding the combined impact of
natural infection and subsequent vaccinations could have serious
public health implications, particularly in light of ongoing
COVID-19 booster campaigns worldwide.
Analyses of the clinical trial risks of vaccine associated adverse
effects provide additional support for an undesirable impact
on mortality. In a secondary analysis of serious adverse events
(SAEs) reported in the placebo controlled group, phase III randomized
clinical trials of the mRNA COVID-19 vaccines, the authors
found a 36% higher risk of SAEs in the Pfizer vaccine group
versus the placebo group, with 18 additional SAEs per 10,000
vaccinated [6]. The SAEs included death and various life threatening
conditions, notably ischemic stroke, brain hemorrhage,
and acute coronary syndrome. Notably, for both the Pfizer and
Moderna clinical trials, the excess risk of SAEs was two to four
times higher than the risk reduction for COVID-19 hospitalization.
Most of these SAEs are relatively common events. Given
the short follow-up observation periods for these trials, these
risk estimates may be considered conservative.
Given these findings and concerns, it seems imperative that the
medical scientific community devotes more attention to assessing
the mortality risks resulting from the impact of COVID-19
vaccination in populations with prior or concurrent SARS-CoV-2
infection based on a positive PCR test result. Estimations of
the number of COVID-19 deaths are, from an epidemiological
perspective, relatively straightforward and unhampered by the
complications of morbidity estimates. With population wide
mortality as an outcome, there are no major confounders or
“hidden variables” that could influence the results because, in
free living populations exposed to SARS-CoV-2 and occupying similar geo-graphic regions, vaccinated and unvaccinated persons
are living under the same general conditions, the same
sets of risk factors evenly distributed. Vaccinated and non-vaccinated
persons in a given region are consuming similar diets and
are exposed to other similar environmental variables, notably
air, and water.
Differences in the distribution of SARS-CoV-2 infection between
those who have been vaccinated and those who have not been
vaccinated are negligible [7]. Moreover, COVID-19 is spreading
at a similar rate between unvaccinated and vaccinated: the
apparent impact of vaccination on community transmission
of circulating variants of the coronavirus was not significantly
different from the impact among unvaccinated people [8]. For
these reasons, population wide data on vaccination status for
individuals of different age groups living in the same geographic
region should be able to provide meaningful data on the mortality
related effects of the vaccines in the context of SARSCoV-
2 infection. These epidemiological considerations enable
us to perform a rigorous analysis of the impact of large scale
COVID-19 vaccination on the mortality rate of vaccinated versus
non-vaccinated groups.
Methods
For the purposes of the analysis, people who are living in a given
region (state or country) may be designated as “alive”. In this
group, we can further delineate “vaccinated” from “unvaccinated”
persons. As people are dying within a given time frame, we
can then also estimate total deaths and include subsets based
on vaccination status.
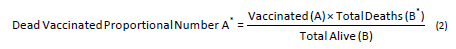
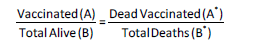
Therefore, to assess the impact of vaccination on the mortality
rate, we employ the following equation:
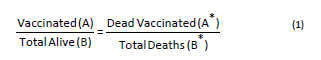
We calculate the proportional number of dead vaccinated as
follows:
The proportional number for a given time period should always
be larger than the statistical estimate of dead vaccinated, the
product obtained from the calculation. In this case, vaccines
are saving lives. If the proportional number is smaller than the
statistical number, however, vaccines are increasing the death
rate. This calculation should be done for each month of the year
2021 for five age groups: up to 20 years, from ages 20 to 40,
from ages 40 to 60, from ages 60 to 80, and above age 80. In
this way, the statistical problem known as the Simpson Effect (or
Yule-Simpson Paradox, whereby an association between two
variables in a population emerges, disappears or reverses when
the population is divided into subpopulations) is excluded.
For the rigorous mathematical evaluation of COVID-19 vaccine
efficacy, a recent BMJ editorial advocates the use of row data
[9]. We can calculate the exact impact on the entire population
in a given country and worldwide by utilizing data on how many
deaths occurred in a given 4 week period have been at least
once vaccinated (referred to by some authors as “ever vaccinated”). This would allow calculating the proportional number of
“dead vaccinated” and comparing it with the actual statistical
calculation of the number of dead vaccinated people.
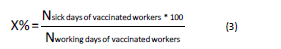
Corporations and government agencies have provided useful
data for this purpose. For each company or governmental agency,
we can calculate the effectiveness of the COVID-19 vaccination
by comparing the days of work with the sick status days in
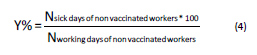
percentage in a given month or year is as follows:
Working days of vaccinated workers in one month………..100%
Sick days of vaccinated workers in one month……….. X%
Working days of non-vaccinated workers in one
month………..100%
Sick days of non-vaccinated workers in one month……….. Y%
For a given company, we can easily see which percentage of
sick days is higher. Let’s imagine we have a company with 100
employees, 50% of whom are vaccinated, and 50% of whom
are not vaccinated. Vaccinated workers are protected from
COVID-19, and should have a much smaller percentage of sick
days than non-vaccinated workers. According to the COVID-19
vaccination doctrine percentage of sick days should be much
smaller in the vaccinated group of people than in the non-vaccinated
group of people.
It should be noted that neonatal mortality has emerged as another
factor contributing to changes in population mortality
rate. In Slovenia and worldwide, we observe highly increased
rates of neonatal mortality in 2022 compared to the previous
years. The first check that should be done in this context is the
possible influence of COVID-19 vaccination. The number of neonatal
deaths  is the sum of the following numbers:

Where X6 is the number of neonatal deaths where both parents
are each three times vaccinated, where X5 is the number of neonatal
deaths where one parent is three times vaccinated, and
another parent is two times vaccinated (and so on), where X0 is the number of neonatal deaths where both parents have not
been vaccinated. Using this model, we could see possible relations
with the COVID-19 vaccination. EMA, VAERS, and the Yellow
card reports on high numbers of vaccine’s side effects [10-12] are alarm bells for detailed analysis proposed in this article.
The proposed statistical analysis presented in this paper can
verify the theoretical study of how many lives were saved by
the vaccines in a particular country not only for ages above 60
but for the entire population.
Calculations of the Death Rate of the Infected Vaccinated Group
and Infected Non-Vaccinated Group Using Official Data of the
UK Health Security Agency
In the calculations, we compare the sample  of the entire
population with the sample
of the entire
population with the sample  in the dead group of persons.
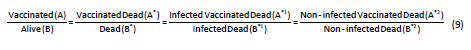
Formula (1) is valid for statistics involving large sample sizes and
provides precise results. As medical authorities are hiding the
vaccination status of most dead person’s  , this is not feasible
at this time. We can, however, obtain official data in England
about the infected dead group
, this is not feasible
at this time. We can, however, obtain official data in England
about the infected dead group  and write following equation:

The problem is that for non-infected vaccinated dead  , we
have no data because medical authorities are not allowing public
excess to information on vaccination status of dead persons.
, we
have no data because medical authorities are not allowing public
excess to information on vaccination status of dead persons.
Taking into account that vaccines do not impact on mortality,
the subgroup  and subgroup have the same rate of mortality.
When both groups would be persons of different ages,
let’s say in the subgroup most persons would be under 40
years and in the subgroup most persons would be above
40 years, the Simpson effect could occur. This is not the case in
both groups the age distribution is very similar and Simpson’s
effect is excluded.
and subgroup have the same rate of mortality.
When both groups would be persons of different ages,
let’s say in the subgroup most persons would be under 40
years and in the subgroup most persons would be above
40 years, the Simpson effect could occur. This is not the case in
both groups the age distribution is very similar and Simpson’s
effect is excluded.
Taking into account that vaccines do not impact on mortality,
the subgroup and subgroup  have the same rate of mortality.
Producers of the vaccines are declaring that effectiveness
of vaccines is around 95% which means that the group’s , , , and have very similar mortality rates that are within the
value of 5%, so we write the following equation:
have the same rate of mortality.
Producers of the vaccines are declaring that effectiveness
of vaccines is around 95% which means that the group’s , , , and have very similar mortality rates that are within the
value of 5%, so we write the following equation:
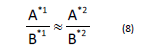
Out of (7) follows:
Out of (8) follows equation:
The impact of the COVID-19 virus on the death rate in group and in group is the same. The proportional numbers obtained in all five of the 28 day time periods are always smaller
than the statistical numbers. This provides strong proof that
vaccines are increasing the death rate. The statistics pertain to
a short time span (four weeks, 28 days); therefore the time variable
cannot significantly influence the results. In group and
in group , people could die because of some unknown reasons.
Both groups were living under the same living conditions,
so some other cause of death would have the same impact on
both groups.
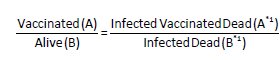
In population statistics for England, we obtained data for the
number of infected vaccinated dead and data of infected dead . Using equation (9), we calculated the proportional number
of infected vaccinated dead and compared it with the
statistical number of actual infected vaccinated dead. Thus, we
obtained the decreased or increased mortality rate (percentage)
associated with or likely attributed to vaccination. The
proportional number is the number indicating no impact vaccination on the death rate. When 10% of the population is
vaccinated in the group of SARS-CoV-2-infected dead person’s , 10% will be vaccinated. When 20% of the population is vaccinated
in the group of SARS-CoV-2 infected dead person’s ,
20% will be vaccinated, and so on. When 100% of the population
is vaccinated in the group of SARS-CoV-2 infected dead person’s , 10% will be vaccinated. When 20% of the population is vaccinated
in the group of SARS-CoV-2 infected dead person’s ,
20% will be vaccinated, and so on. When 100% of the population
is vaccinated in the group of SARS-CoV-2 infected dead
person’s , 100% will be vaccinated.
Now we will compare the numbers of SARS-CoV-2 infected vaccinated
dead persons in official statistics with the SARS-CoV-2
infected vaccinated deaths proportional number . The statistical
number of SARS-CoV-2 infected vaccinated dead persons must be lower than the proportional number . In that case,
vaccines would be saving people’s lives. We can then calculate
how many SARS-CoV-2 infected persons have been saved from
death with vaccination for a given 4 week period, using the following
equation:

In this case, the statistical number of SARS-CoV-2 infected vaccinated
dead is bigger than the proportional number , and
therefore vaccination has a negative impact on mortality rate. In
other words, the vaccination is stealing more lives than it saves,
i.e., more people have died prematurely because of getting vaccinated than would have occurred had they chosen not to get
vaccinated (Figure 1).

Figure 1: Comparing proportional number with statistical number.

The Calculation for Weeks 35-38 in Year 2021
Homogeneous distribution of all age groups can be seen in data
source. Below is the table from the UK data source [13]. We can
see that most of the vaccinated is elderly population. We calculate
COVID infected vaccinated deaths =2447 by summing
colons “Received one dose” and “Second dose”. We calculate =3165 by summing colon “Total” (Table 1).
| Death within 28 days of positive COVID-19 test by date of death between 35 and week 38 2021 |
Total |
Unlinked* |
Not Vaccinated |
Received one dose (1-20 days before specimen date) |
Received one dose, ≥ 21 days before specimen date |
Second dose ≥ 14 days before specimen date |
Rates among persons vaccinated with 2 doses (per 100,000) |
Rates among persons not vaccinated (per 100,000) |
| Under 18 |
6 |
2 |
4 |
0 |
0 |
0 |
0.0 |
0.0 |
| 18-29 |
20 |
1 |
15 |
0 |
0 |
4 |
0.1 |
0.4 |
| 30-39 |
42 |
1 |
30 |
0 |
0 |
11 |
0.2 |
1.0 |
| 40-49 |
92 |
3 |
52 |
0 |
7 |
30 |
0.5 |
3.1 |
| 50-59 |
251 |
5 |
125 |
0 |
12 |
109 |
1.5 |
12.2 |
| 60-69 |
419 |
4 |
121 |
0 |
21 |
273 |
4.8 |
22.4 |
| 70-79 |
804 |
4 |
151 |
0 |
26 |
623 |
13.4 |
61.2 |
| 80+ |
1531 |
10 |
189 |
1 |
43 |
1288 |
50.1 |
149.4 |
Table 1: Covid infected vaccinated deaths between weeks 35 and 38.
A “vaccinated” person in this calculation is the person that
was vaccinated with the first dose or more. Let’s calculate the
proportional number of dead vaccinated in England between
weeks 35 and 38. In this time frame, there were 3165 COVID-19
deaths in the United Kingdom; 2448 of those persons had been
vaccinated [13]. We see that the percentage of vaccinated UK
people with one dose in this period is 65.1%. In 2021 the population
of the United Kingdom was 56,191,000 people. 65.1% of
the entire population is 36,580,300 people.
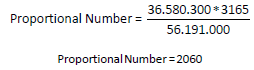
Officially declared vaccinated COVID dead persons between 35 and 38 weeks are 2447.
COVID infected vaccinated deaths declared=2447.
This means that 2448-2060=387 persons had prematurely
passed away due to the vaccination in the period of week 35-38.
Lost lives=2447-2060=387
The Calculation for Weeks 39-42, 2021
Let’s calculate the proportional number of dead vaccinated in
England between weeks 39 and 42. In this period there were
2772 COVID deaths in the UK. 2270 of them have been vaccinated
[13]. We see that the percentage of vaccinated people in the
UK with one dose in this period is 66.1% [13]. The population
of the UK was 56.191.000 people in 2021. 66.1% of the entire
population is 37.142.200 people (Table 2).
| Cases presenting to emergency care (within 28 days of a positive test) resulting in overnight inpatient admission, by specimen date between week 39 and week 42 2021 |
Total |
Unlinked* |
Not Vaccinated |
Received one dose (1-20 days before specimen date) |
Received one dose, ≥ 21 days before specimen date |
Second dose ≥ 14 days before specimen date |
| Under 18 |
633 |
17 |
592 |
12 |
11 |
1 |
| 18-29 |
324 |
8 |
212 |
2 |
28 |
74 |
| 30-39 |
708 |
10 |
446 |
2 |
47 |
203 |
| 40-49 |
991 |
14 |
495 |
5 |
40 |
437 |
| 50-59 |
1139 |
13 |
447 |
1 |
46 |
632 |
| 60-69 |
1177 |
12 |
288 |
3 |
33 |
841 |
| 70-79 |
1642 |
1 |
195 |
3 |
34 |
1409 |
| ≥ 80 |
1724 |
2 |
157 |
0 |
38 |
1527 |
Table 2: Covid infected vaccinated deaths between week 39 in week 41.
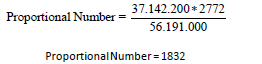
Officially declared vaccinated COVID dead persons between 39 and 42 weeks are 2270.
COVID infected vaccinated dead declared=2270.
This means that 2270-1832=438 persons had prematurely
passed away due to the vaccination in the period weeks 39-42:
Lost lives=2270-1832=438
The Calculation for Weeks 43-46, 2021
Let’s calculate the proportional number of dead vaccinated in
England between weeks 43 and 46. In this 4 week period, there
were 3726 COVID deaths in the UK. 2992 of them have been
vaccinated [13]. We see that the number of vaccinated people
in England in this period with the first dose is 67.4% [13]. The
population of the UK was 56.191.000 people in 2021. 67.4% of
the entire population is 37.872.700 people (Table 3). We use
equation (7) and we get:
| Death within 28 days of positive COVID-19 test by date of death between week 43 and week 46 2021 |
Total** |
Unlinked* |
Not Vaccinated |
Received one dose (1-20 days before specimen date) |
Received one dose, ≥ 21 days before specimen date |
Second dose ≥ 14 days before specimen date |
| These data should be interpreted with caution. See information below in footnote about the correct interpretation of these figures. |
| Under 18 |
9 |
1 |
8 |
0 |
0 |
0 |
| 18-29 |
13 |
0 |
9 |
0 |
2 |
2 |
| 30-39 |
44 |
1 |
28 |
0 |
4 |
11 |
| 40-49 |
104 |
3 |
51 |
0 |
4 |
46 |
| 50-59 |
250 |
5 |
108 |
0 |
11 |
126 |
| 60-69 |
555 |
3 |
154 |
0 |
18 |
380 |
| 70-79 |
1025 |
6 |
163 |
1 |
9 |
846 |
| ≥ 80 |
1726 |
7 |
187 |
5 |
35 |
1492 |
Table 3: Covid infected vaccinated deaths between weeks 43 in week 46.
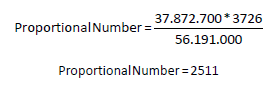
Officially declared vaccinated COVID dead persons between 43
and 46 weeks are 2992.
COVID infected vaccinated deaths declared=2992.
This means that 2992-2511=481 persons had prematurely
passed away due to the vaccination in the period weeks 43-46:
Lost lives=2992-2511=481
The Calculation for Weeks 47-50, 2021
Let’s calculate the proportional number of dead vaccinated in
England between weeks 47 and 50. In this period there were 2956 COVID deaths in the UK. 2140 of them have been vaccinated
[13]. By 19 December 2021, the overall vaccine uptake
in the UK for dose 1 was 68.2%, see page 3 COVID-19 vaccine
surveillance report week 51 [13]. The population of the UK was
56.191.000 people in 2021. 68.2% of the entire population is
38.322.200 people (Table 4). We use equation (7) and we get:
| Death within 28 days of positive COVID-19 test by date of death between week 47 and week 50 2021 |
Total** |
Unlinked* |
Not Vaccinated |
Received one dose (1-20 days before specimen date) |
Received one dose, ≥ 21 days before specimen date |
Second dose ≥ 14 days before specimen date |
| These data should be interpreted with caution. See information below in footnote about the correct interpretation of these figures. |
| Under 18 |
4 |
0 |
3 |
0 |
0 |
1 |
| 18-29 |
14 |
0 |
9 |
0 |
1 |
4 |
| 30-39 |
53 |
0 |
43 |
0 |
1 |
9 |
| 40-49 |
113 |
3 |
60 |
0 |
4 |
46 |
| 50-59 |
244 |
5 |
116 |
1 |
10 |
112 |
| 60-69 |
453 |
5 |
141 |
0 |
9 |
296 |
| 70-79 |
725 |
8 |
169 |
1 |
22 |
525 |
| ≥ 80 |
1350 |
13 |
241 |
4 |
37 |
1055 |
Table 4: Covid infected vaccinated deaths between weeks 47 in week 50.
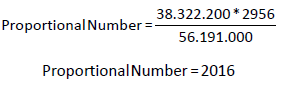
Officially declared vaccinated COVID dead persons (one dose or
more) between 47 and 50 weeks are 2140.
COVID infected vaccinated deaths declared=2140
This means that 2140-2016=124 persons had prematurely
passed away due to the vaccination in the period weeks 47-50:
Lost lives=2140-2016=124
The Calculation for Weeks 50, 2021-1, 2022
Let’s calculate the proportional number of dead vaccinated in
England between week 51, 2021 and week 1, 2022. In this period there were 3893 COVID deaths in the UK. 2878 of them
have been vaccinated. By 16 January 2022, the overall vaccine
uptake in England for dose 1 was 68.9%, see page 3 [13]. The
population of the UK was 56.191.000 people in 2021 68.9% of
the entire population is 38.322.200 people (Table 5). We use
equation (4) and we get:
| Death within 28 days of positive COVID-19 test by date of death between week 50 2021 and week 1 2022 |
Total** |
Unlinked* |
Not Vaccinated |
Received one dose (1 to 20 days before specimen date) |
Received one dose, ≥ 21 days before specimen date |
Second dose ≥ 14 days before specimen date |
| These data should be interpreted with caution. See information below in footnote about the correct interpretation of these figures. |
| Under 18 |
8 |
0 |
8 |
0 |
0 |
0 |
| 18 to 29 |
23 |
0 |
15 |
0 |
0 |
8 |
| 30 to 39 |
64 |
0 |
37 |
0 |
3 |
24 |
| 40 to 49 |
115 |
2 |
69 |
0 |
5 |
39 |
| 50 to 59 |
263 |
2 |
116 |
1 |
15 |
129 |
| 60 to 69 |
499 |
10 |
181 |
0 |
21 |
287 |
| 70 to 79 |
715 |
6 |
196 |
2 |
35 |
476 |
| 80 or over |
1487 |
11 |
302 |
4 |
44 |
1126 |
Table 5: Covid infected vaccinated deaths between week 50 (2021) and week 1 (2022).
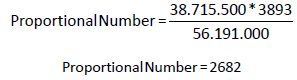
Officially declared vaccinated COVID dead persons (one dose or
more) between week 50, 2021 and week 1, 2022 are 2878.
Coronavirus infected (test positive) vaccinated deaths declared=
2878
This means that 2878-2682=196 persons had prematurely
passed away due to the vaccination in the period weeks 47-50:
Lost lives=2878-2682=196
Below we have the results of all calculated periods:
Weeks 35-38: total coronavirus infected deaths are 3165, number
of COVID infected vaccinated deaths is 2448, number of
dead because of heavy adverse effects caused by vaccination
is 388 which is 15% of coronavirus infected vaccinated deaths
Weeks 39-42: total coronavirus infected deaths are 2772, number
of COVID infected vaccinated deaths is 2270, number of
dead because of heavy adverse effects caused by vaccination
is 438 which is 19% of coronavirus infected vaccinated deaths
Weeks 43-46: total COVID infected deaths are 3726, number
of COVID infected vaccinated deaths are 2992, number of dead
because of heavy adverse effects caused by vaccination is 481
which is 16% of coronavirus infected vaccinated deaths
Weeks 47-50: total coronavirus infected deaths are 2956, number
of COVID infected vaccinated deaths is 2140, number of
dead because of heavy adverse effects caused by vaccination is
124 which is 6% of coronavirus infected vaccinated deaths
Weeks 50(2021)-1(2022): total coronavirus infected deaths are
3893, number of COVID infected vaccinated deaths is 2878, the
number of dead because of heavy adverse effects caused by
vaccination is 196 which is 7% of coronavirus infected vaccinated
deaths.
In 20 weeks, the total number of deaths among persons who
had tested positive for SARS-CoV-2 infection was 16.505. The
total number of the COVID-19 test positive vaccinated deaths is
12.728. The total number of deaths because of heavy adverse
effects caused by vaccination is 1627 persons. This means in the
group of COVID test positive vaccinated deaths which is 12.728
persons, 12.8% have died because of heavy adverse effects. By
including all time periods in the calculation, we will have a more
comprehensive estimate.
The total number of deaths of the COVID-19 test positive people
that died in 20 weeks was 12.728. The total proportional number
of vaccinated infected people that died was 11.101. Thus, in
the group of test positive vaccinated deaths, there was a 14.5%
higher rate of mortality than in the group of COVID positive unvaccinated
considering vaccines would not have any influence
on the death rate. Our data indicate that infected vaccinated
persons have a 14.5% higher probability of dying (ostensibly
from prior or concurrent COVID- 19 infection, or vaccination, or
both) than infected unvaccinated persons.
According to the official narrative, vaccines are saving lives,
which mean the number of coronavirus infected vaccinated
deaths statistically recorded should be significantly lower than the proportional calculated number of the coronavirus infected
vaccinated deaths. As shown in Table 1, our results indicate that
the opposite is true. The statistical number of the coronavirus
infected vaccinated deaths is significantly higher than the calculated
proportional number of coronavirus infected vaccinated
deaths, which means that infected vaccinated people are dying
at a higher rate than their infected unvaccinated counterparts,
presumably because of adverse effects of the vaccines themselves
(Figure 2).

Figure 2: Obtained results.
Evaluation of Obtained Results
In principle, the gene based COVID-19 vaccines (mRNA vaccines
and adenovirus vector vaccines) were designed to significantly
decrease the number of deaths associated with SARS-CoV-2 infection
when compared to the number of deaths among infected
unvaccinated persons. However, the present analysis points
to a net negative benefit in terms of mortality reduction. Based
on UK population data at five 28 day intervals in 2021-2022,
we found that infected vaccinated persons have a 14.5% higher
probability of dying than infected unvaccinated persons.
Our findings are limited in scope but of major statistical relevance.
The proposed statistical approach offers a highly reliable
estimate of how the COVID-19 vaccination campaign has been
impacting the mortality rate for entire populations, apparently
adding in a major way to deaths attributed to COVID-19. The
relation between the “vaccinated corona virus infected deaths”
and “non-vaccinated coronavirus infected deaths” in a short 4
week period is a statistically viable measure of the unfavorable
impacts of these immunizations on COVID-19 mortality. Based
on the rules of statistics, if we were to calculate the relationship
between the proportional and real number of vaccinated
COVID-19 deaths for all other time periods, we would not expect
to see results that contradict the present findings. We are
therefore inclined to propose that COVID-19 vaccines are causing
lethal adverse effects. It seems reasonable to surmise that
such impacts on mortality are not only relevant to England but
also to other countries where the vaccines have been adopted
on a massive scale.
To widen the scope of this research, we could calculate the mortality
impacts on the entire population in England and worldwide.
This would require data on how many people who died
in a given 4 week period have been at least once vaccinated (or ever vaccinated). This would allow calculating the proportional
number of “dead vaccinated” and comparing it with the actual
statistical number of deaths. Because the proposed calculation
might be difficult to understand for medical professionals, here
is an example: Let’s imagine that in a given country, in January
2024, we will place a red bracelet on the hands of 30% of the
entire population. In every age group, exactly 30% of people will
have red bracelet. We follow a number of deaths in the ensuing
months and see that exactly 30% dead people in each age
group will have a red bracelet. This is how statistics work out
when applied to large population sizes. We can imagine that
COVID-19 vaccine is a red bracelet and has no impact on the
health of the vaccinated person. On this plausible sup-position,
we calculate a proportional number of deaths. Comparing the
proportional number of deaths with the real statistical number
of deaths shows us the real impact of vaccination on the population
death rate.
Calculation of the impact of COVID-19 vaccination on increased
mortality is so straightforward that it could be done by anyone
with middle school mathematics ability who has an interest in
assessing and monitoring the mortality impact. Most of the
published statistics pertaining to COVID-19 vaccine effectiveness
are avoiding this calculation because of immense pressures
on the medical profession to hide the disastrous results
of the vaccination program; however, it is only a matter of time
before the truth is revealed. Human society is evolving rapidly
and will not support the unbearable falsehoods concerning how
COVID-19 vaccines are impacting human lives.
In this simple effective calculation, the entire population of a
given country is divided into five age groups: 0-20 years, 21 to
40 years, 41 to 60 years, 61 to 80 years, and over 80 years. Each
age group (total number-TN) consists of two sub-groups: vaccinated
subgroup (VA) and unvaccinated subgroup (UN):

Where TN stands for all people in a particular group, VA stands
for vaccinated persons and UN stands for unvaccinated persons.
A certain number of people die each month in each age group:

Where D means all dead people in a certain age group, Dva
means dead vaccinated people and Dun means unvaccinated
dead people. Unvaccinated people are not protected from the
deadly virus COVID-19 and therefore should die in greater numbers.
The calculation of mortality expressed in percentage in
the vaccinated subgroup in a certain age group for each month is calculated as follows:

The calculation of the mortality in percentage in the unvaccinated
subgroup in a certain age group for each month is as follows:

For each month, it is possible to accurately calculate the mortality
of the vaccinated subgroup in a certain age group and
the mortality of the unvaccinated sub- group within a certain
age group. Avoiding these calculations is avoiding the fact that
COVID-19 vaccination has done major harm to public health
worldwide. Carrying out these calculations on a monthly basis
and informing the medical community and general public about
them is the main obligation of every medical journal. A simple
calculation at the end of each monthly report would provide a
concise updated analysis of the COVID-19 vaccination impact
on the mortality rate for that particular month. Such calculations
would reveal the true impact of COVID-19 vaccinations.
This must be done immediately in order to preserve the first
principle of medicine: “Primum non nocere”.
The results obtained by the present analysis would seem to
reinforce the findings of Tojersen and colleagues, who reported
that the COVID-19 vaccinations have led to increased death
rates among the elderly population [14,15]. A report from the
insurance company One America is similarly discouraging, with
actual data from the latter half of 2021 indicating an unprecedented
40% increase in death rates for individuals aged 18 to 64
when compared to the pre-pandemic period [16]. According to
the company’s CEO, this represented the highest mortality rate
in the history of insurance records, which entail extensive death
data collection annually. Previous large scale catastrophes had
increased death rates by no more than 10% [16]. It seems increasingly
clear that COVID- 19 vaccination programs are not
living up to the “safe and effective” terms they had promised to
the general public.
Other concerning data come from German public health authorities
showing that “sudden death of unknown cause” increased
dramatically in the past two years. In 2021 and 2022, according
to official German statistics, approximately 14,800 people died,
compared to an annual average of only 1,600 people in the previous
five years. According to the report from The Group in the
German parliament in December 2022, “the sudden death of
unknown cause” increased by about 560% in 2021 and 2022
over previous years [17]. These data are sounding off alarms
that something went terribly wrong with the public health response
to COVID-19 (Figure 3).

Figure 3: Increase of sudden death cause unknown in Germany in 2021 and 2022.
Data from Slovenia’s National Institute of Public Health (NIJZ)
are also ringing alarm bell. Pulmonary embolism increased by
about 36% from 2021 to 2022. In that same two year period,
chronic myocarditis increased by about 65%, while viral pneumonia
increased by about 149% [18] (Figures 4-6).

Figure 4: Increase of pulmonary embolism in 2021.

Figure 5: Increase of chronic myocarditis in 2021.

Figure 6: Increase of viral pneumonia in 2021.
The status of the vaccination of these patients is not publicly
known, which makes it impossible to calculate the exact impact
of COVID-19 vaccination on the increase of these diseases.
Despite several calls of researchers from different fields, NIJZ
is keeping these data confidential. It is unprecedented that a
scientific organization of public health is hiding data that could
prove the danger of a given medical treatment. In the lives of
people in Slovenia, the only big change of life in 2021 was massive
COVID-19 vaccination, so the vaccines represent the most
logical candidate for the increased morbidity and mortality.
Only when the data become publicly available will we be able
to carry out calculations of exact per cent of patients that were
vaccinated.
Results and Discussion
Numbers of Vaccination are Coinciding with the
Numbers of Death Rate
Below is the official statistics of excess mortality for November
2022 for European countries (Figure 7).

Figure 7: Excess mortality in EU in November 2022.
“Excess mortality rates continued to vary across the EU Member
States. All Member States registered increases in excess
mortality, except for Romania (-6%), Bulgaria (-3%) and Slovakia
(-2%), which recorded no excess deaths. Italy recorded
few excess deaths, with its rate standing at +0.5%. After these
Member States, the next lowest rates were recorded in Belgium
and Lithuania (both +1%), Sweden (+2%), and Poland and Spain
(both +3%), all less than half of the EU average. The most affected
countries in November 2022 were Cyprus and Finland, which
recorded excess mortality rates of +24% and +21%, respectively.
Germany also recorded a high rate of +16%” [19].
Calculations on the 14.5% excess mortality rate are supported
by official data of the EU, which confirm that excess mortality is
higher in countries where the percentage of vaccination is higher.
In general, we can see, the higher the percentage of vaccination
in a given country, the higher is the excess mortality. We
could have a better overview if we would have data on excess
mortality for the entire year 2022 per given country (Table 6).
| Country |
Death rate |
Percentage of vaccinated with at least one dose |
| Romania |
-6% |
42% |
| Bulgaria |
-3% |
30% |
| Slovakia |
-2% |
48% |
| Lithuania |
+1% |
70% |
| Belgium |
+1% |
81% |
| Latvia |
+1.3% |
70% |
| Sweden |
+2% |
76% |
| Spain |
+3% |
88% |
| Poland |
+3% |
60% |
| Hungary |
+6.7% |
66% |
| Swiss |
+11.6% |
71% |
| Slovenia |
+14.7% |
61% |
| Germany |
+16% |
78% |
| Finland |
+21% |
82% |
| Cyprus |
+24% |
56% |
Table 6: Mortality rate in some European countries in October 2022.
Calculations on 14.5% excess mortality rate are supported by
official data of “Our World in Data” which confirm that excess
mortality is higher in countries where the number of vaccinations
per 100 habitants is higher. Further on these data are
confirming that with the increase in the number of vaccinations
in a given month, excess mortality is increasing too. With the
decrease in the number of vaccinations, excess mortality is decreasing
[20] (Figures 8-27).

Figure 8: Excess mortality and number of daily vaccinations in Japan.

Figure 9: Excess mortality and number of daily vaccinations in Australia.

Figure 10: Excess mortality and number of daily vaccinations in Guatemala.

Figure 11: Excess mortality and number of daily vaccinations in Albania.

Figure 12: Excess mortality and number of daily vaccinations in Slovenia.

Figure 13: Excess mortality and number of daily vaccinations in USA.

Figure 14: Excess mortality and number of daily vaccinations in UK.

Figure 15: Excess mortality and number of daily vaccinations in Colombia.

Figure 16: Excess mortality and number of daily vaccinations in Israel.

Figure 17: Graphs of vaccination and excess mortality in Germany.

Figure 18: Graphs of vaccination and excess mortality in Austria.

Figure 19: Graphs of vaccination and excess mortality in Croatia.

Figure 20: Excess mortality and number of daily vaccinations in Brazil.

Figure 21: Excess mortality and number of daily vaccinations in Finland.

Figure 22: Excess mortality and number of daily vaccinations in Russia.

Figure 23: Excess mortality and number of daily vaccinations in Jamaica.

Figure 24: Excess mortality and number of daily vaccinations in Malta.

Figure 25: In Turkey, a high mortality rate after an intense period of vaccination

Figure 26: In Monaco, a high mortality rate period happened after an intense period of vaccination.

Figure 27: In Malaysia, a high mortality rate periods happened after an intense periods of vaccination.
Slovenia is a country where in a given time period, vaccination
has increased and mortality has decreased. This happened between
28th December 2020 (dark spot) and 14th February 2021
(light brown spot). After 14th February 2021 with the increased
vaccination, the mortality rate is increasing (Figure 12 above).
The USA is a country where in a given time period, vaccination
has increased and mortality has decreased. This has happened
between 20th December 2020 (dark spot) and 12th April 2021
(red spot). From 9th July 2021 (green spot) the graphs show
clearly that with the increase in vaccination, the rate of mortality
has increased. The USA is the only country where the graph
in increased mortality and the number of vaccinations are getting
aligned in July 2021. In all countries, we study, this occurs
already in March 2021, see Figures below.
The UK is also a country where in a given time period at the beginning
of vaccination with the increase of the daily number of
vaccination, mortality has decreased. This happened between
11th January 2021 (dark spot) and 22nd March 2021 (orange
arrow). After 22nd March with the increase in vaccination; the
mortality rate is also increasing (Figures 14 above).
Germany is also a country where in a given time period at the
beginning of vaccination with the increase of the daily number
of vaccination, mortality has decreased. This happened between
28th January 2020 (dark spot) and 7th March 2021 (green
spot). After 7th March 2021 with the increase of vaccination
mortality rate is also increasing (Figure 17 above).
Austria is also a country where in a given time period at the beginning
of vaccination with the increase of the daily number of
vaccinations, mortality has decreased. This happened between
29th December 2020 (dark spot) and 7th March 2021 (green
spot). After 7th March with the increase in vaccination, the mortality
rate is also increasing. The last red vertical arrow on the
left graph is showing excess mortality on 24th July 2022. The last
red vertical arrow on the right graph is showing the peak of vaccination
15th July 2022 (Figure 18 above).
Croatia is also a country where in a given time period at the beginning
of vaccination with the increase of the daily number of
vaccination, mortality has decreased. This happened between
31th December 2020 (dark spot) and 7th March 2021 (light
brown spot). After 7th March with the increase in vaccination,
the mortality rate is also increasing.
When we compare graphs that show the mortality rate and the
number of vaccinations per day and can see that graphs for all
countries have similar shapes. On the left, we see decreased
mortality rate. On the right, we see the number of vaccinations
in time. We can see that the mortality rate is increasing with the
increasing number of vaccinations per day. We can see that the
mortality rate is decreasing with the decreasing number of vaccinations
per day. In a few countries, there is an exception in the
first two months of vaccination, with the increase of vaccination
mortality rate is increasing.
COVID vaccination was introduced in 2021 and 2022 because
of the high excess mortality rate in 2020 that was caused by
COVID-19. People that are vaccinated are protected from
COVID-19 and should have a lower mortality rate. The lower
number of vaccinated in a given month should increase the
mortality rate, but we see that it is the opposite. This proves
that COVID vaccines are increasing the death rate.
In general, to the official narrative, we should have the opposite
situation. In the time period where vaccination is increasing,
we should have a lower rate of mortality and in time periods
where vaccination is decreasing, we should have a higher mortality
rate. We have the opposite situation that is confirming
that COVID vaccines are increasing the mortality rate.
In Figure 24 in the graph on the right, we see that the highest
death rates (red dots) occurred after the peak of vaccination.
Therefore, we decided to verify the direct causal correlation
between maximum mortality in a given period and vaccination
intensity in the preceding period, see the three figures below.
(Figures 25, 26 and 27).
The first blue arrow on the left represents the beginning of intense
vaccination period between 1st July and 31st August 2021.
The first red arrow on the right represents the beginning of a
high mortality period between 1st August 2021 and 30th September
2021. The second blue arrow on the left represents the beginning
of intense vaccination period between 1st February and
31st March 2022. The second red arrow on the right represents
the beginning of a high mortality period between 1st March
2022 and 31st April 2022.
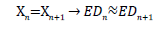
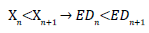
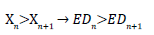
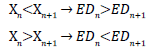
The mathematical algorithm of correlation between mortality
rate and vaccination is following. Let’s take that  is the number
of vaccinations in the time period of 30 days.
is the number
of vaccinations in the time period of 30 days.  is the
number of vaccinations in the time period of next 30 days.
is the
number of vaccinations in the time period of next 30 days.
When =, the numbers of excess deaths (ED) in both time
periods are close to equal:
When <, the numbers of excess deaths are as follows:
When >, the numbers of excess deaths are as follows:
If vaccines saved lives, the situation would be the opposite:
Unfortunately, this is not the case. The rule is general, with
only a few exceptions in some countries in the first two months
of vaccination. In general, analysis is confirming that vaccines
cause “sudden deaths with unknown reason” in the time frame
of 30 days. That’s why the increase in vaccination, in general,
has increased the mortality rate.
The algorithm could be used to carry out detailed computer
analysis where all data-bases [20] will be evaluated. This will
give us the final result about the impact of vaccination on the
mortality rate.
The Intensity of Vaccination with Boosters Coincides
with the Mortality Rate
We used data sources [20] and we compared graphs of vaccination
with boosters administrated per 100 people with the
graphs of excess mortality rate. The analysis confirmed the direct
causal relation between covid vaccination with boosters
and increased mortality rate (Figures 28-31).

Figure 28: Intensity of vaccination with boosters and excess mortality in Chile and Brazil.

Figure 29: Intensity of vaccination with boosters and excess mortality in Chile and Israel.

Figure 30: Intensity of vaccination with boosters and excess mortality in Chile and Albania.

Figure 31: Intensity of vaccination with boosters and excess mortality in Italy and Russia.
Conclusion
COVID-19 vaccination policies have been widely adopted on the
supposition that COVID-19 vaccination was “safe and effective”,
a slogan that was widely circulated, even in the medical literature.
These present calculations suggest that, rather than “safe
and effective”, COVID-19 vaccination has done irreparable harm
to the health and lifespans of billions of people worldwide.
Based on calculations performed for each of five 28 day intervals
in 2021 and 2022, our results indicate that the mortality of
the vaccinated coronavirus infected groups was 14.5% higher
on average than the mortality of non-vaccinated coronavirus
infected groups.
The findings of this analysis warrant an extensive reassessment
of UK Health Security Agency data on COVID-19 related mortality
and vaccination status for different age groups in England. Every
UK County has accurate data on vaccination status, including
information on who was vaccinated, how many times they were
vaccinated, and who was not vaccinated. As long as the person
is alive, vaccination status can be verified. After death, however,
vaccination status is usually lost or disregarded, and yet death
rate comparisons between the vaccinated and non-vaccinated
groups offer us the most reliable evidence for the vaccination’s
relative impact on mortality. Similarly, it is common practice to
hide the vaccination status of sick people, whether the diagnosis
is COVID-19 or other illnesses. When a person gets sick and
visits his or her doctor, the physician typically will not ask about
COVID-19 vaccination status. In this way, the potentially catastrophic
impact of COVID-19 vaccination, now and in the future,
continues to remain obscure.
How this horrible stain on public health and the medical system
has been allowed to persist is a complex question. By the end
of 2020, all of the established security measures and scientific
standards for public health responsiveness to a pandemic had
been subverted. Early treatment protocols using low-cost, effective
off label drugs were banned, thanks to an intensive misinformation
campaign orchestrated by the vaccine establishment.
Nutritional and lifestyle measures for bolstering antiviral
immunity were ignored by the mainstream medical community.
In clinical practice, the new rules for treatment and management
of COVID-19 related disease were not evidence based but
instead were driven primarily by political and financial interests
that have their roots in the medical pharmaceutical industrial
complex. The modern medical system of many westernized
countries has forsaken its ethical center, which is best summarized
by the ancient Latin dictum of Primum Non Nocere, “First,
Do No Harm”. The only way for medical doctors to reclaim the
ethos of their once noble profession, and to do so with grace
and respect, is to stop acquiescing to corrupt federal agencies
and pharmaceutical influence, to take medicine back into their
own hands.
Perhaps we can learn from the example set by India, the second
largest country in the world. Despite enormous media pressure
worldwide declaring that vaccination was the only way to
prevent COVID-19 infection, many clinics and hospitals in India
endorsed the use of the low-cost anti-parasitic drug Ivermectin,
and with excellent results [21]. This shows that East Indian
doctors are maintaining a high level of medical ethics, and this
has likely saved many lives while preserving the original spirit of “good medicine”. The primary aim of medical care should
be to increase health and well-being, not to increase illness so
that more drugs can be sold. For the last two decades, the use
of pharmaceuticals has increased drastically all over the world.
This is not a coincidence; it is the Big Pharma business plan. Because
healthy human beings with competent immune systems
are not customers for this gargantuan industry, they represent
an obstacle to the industry’s progress. This is where medicine
must fight to reclaim its independence, by asserting that its purpose
is
• To promote health,
• To prevent disease, and
• To cure of disease, in that order. In India, this original purpose
of medicine is still alive and well.
Acknowledgement
None.
Conflict of Interest
None.
References
- Meslé MM, Brown J, Mook P, Hagan J, Pastore R, et al. (2021) Estimated number of deaths directly averted in people 60 years and older as a result of COVID-19 vaccination in the WHO European Region, December 2020 to November 2021. Euro Surveill 26; 2101021.
[Crossref] [Google Scholar]
- Gazid S, Shlezinger R, Perez G, Lotan R, Peretz A, et al. (2021) Comparing SARS-CoV- 2 natural immunity to vaccine-induced immunity: reinfections versus breakthrough infections. Medvix Preprint.
[Crossref] [Google Scholar]
- Tseng CT, Sbrana E, Iwata-Yoshikawa N, Newman PC, Garron T, et al. (2012) Immunization with SARS coronavirus vaccines leads to pulmonary immunopathology on challenge with the SARS virus. PLoS One 7; e35421.
[Crossref] [Google Scholar]
- Qin Z, Bouteau A, Herbst C, Igyártó BZ (2022) Pre-exposure to mRNA-LNP inhibits adaptive immune responses and alters innate immune fitness in an inheritable fashion. PLoS Pathog 18: e1010830.
[Crossref][GoogleScholar]
- Otto M, Burrell AJC, Neto AS, Alliegro PV, Trapani T, et al, (2022) Clinical characteristics and outcomes of critically ill patients with one, two and three doses of vaccination against COVID-19 in Australia. Intern Med J.
[Crossref] [Google Scholar]
- Fraiman J, Erviti J, Jones M, Greenland S, Whelan P, et al. (2022) Serious adverse events of special interest following mRNA COVID-19 vaccination in randomized trials in adults. Vaccine 40; 5798-5805.
[Crossref] [Google Scholar]
- Lei Y, Zhang J, Schiavon CR, He M, Chen L, et al. (2021) SARS- CoV-2 Spike Protein Impairs Endothelial Function via Downregulation of ACE 2. Circ Res 128; 1323-1326.
[Crossref] [Google Scholar]
- Mallapaty S (2021) COVID vaccines cut the risk of transmitting Delta but not for long. Nature.
[Crossref] [Google Scholar]
- Doshi P, Godlee F (2022) Editorial: Covid-19 vaccines and treatments: We must have raw data, now. Bmj 376:o102.
[Crossref] [Google Scholar]
- Vigilance, safety alerts and guidance (2023) Coronavirus (COVID-19) vaccines adverse reactions. Medicines and Healthcare products Regulatory Agency.
- En Espanol (2023) VAERS Vaccine Adverse Event Reporting System.
- European Medical Agency (2023) Covid-19 Pandemic. EMA.
- Gov UK (2023) COVID-19 vaccine monthly surveillance reports (week 39 2021 to week 9 2023). UK HEALTH SECURITY AGENCY.
- Tojersen I (2021) Covid-19: Norway investigates 23 deaths in frail elderly patients after vaccination. BMJ 372; 149.
[Crossref] [Google Scholar]
- Tojersen I (2021) Covid-19: Pfizer-BioNTech vaccine is “likely” responsible for deaths of some elderly patients, Norwegian review finds. BMJ 373: 1372.
[Crossref] [Google Scholar]
- Blaylock RL (2022) COVID UPDATE: What is the truth? Surg Neurol Int 13:167.
[Crossref] [Google Scholar]
- Paul-Ehrlich-Institute (2023) Unclear deaths.
- NIJZ (2023) National Institute of Public Health.
- EUROSTAT (2023) Excess mortality dropped to 6.7% in November 2022.
- OUR WORLD IN DATA (2023) Excess mortality: Deaths from all causes compared to average over previous years.
- Behera P, Patro BK, Singh AK, Chandanshive PD, Pradhan SK, et al. (2021) Role of ivermectin in the prevention of SARS-CoV-2 infection among healthcare workers in India: A matched case-control study. PLoS One. 16; 16(2).
[Crossref] [Google Scholar]
Citation: Å orli AS, Makovec T, Krevel Z, Gorjup R (2023) Forgotten â??Primum Non Nocereâ? and Increased Mortality after COVID-19
Vaccination. Qual Prim Care. 31.003.
Copyright: © 2023 Šorli AS, et al. This is an open-access article distributed under the terms of the Creative Commons Attribution
License, which permits unrestricted use, distribution, and reproduction in any medium, provided the original author and source
are credited.

