Keywords
Biological Markers; Calcitonin;, Meta-Analysis; ROC Curve; Pancreatitis,, Acute Necrotizing; Sensitivity and Specificity
Abbreviations
FN: false negative; FP: false, positive; FPR: false positive rate MeSH:, medical subjects heading; SROC: summary, receiver operating curve; TN: true negative, TP: true positive; TPR: true positive rate
INTRODUCTION
Acute pancreatitis is usually a mild disease, with minimal organ dysfunction. However,, 15-20% of all cases demonstrate severe acute, pancreatitis [1, 2]. In acute pancreatitis, early, assessment of the patient which can lead to an, accurate prediction of the severity is useful, for several reasons. The first well-established, step is the need to categorize patients at risk, for complications for appropriate stratification, in clinical trials. Furthermore, it is important, to identify the patients who are at risk for, developing complications in order to be able, to initiate effective management before those, complications develop.
The lack of accurate predictors of disease, severity makes such categorization difficult., Several biochemical parameters [3], contrastenhanced, computed tomography [4, 5], and, multiple clinico-biochemical scores [6, 7], have been used to assess the severity of acute, pancreatitis. An ideal prognostic method, should be simple, inexpensive, routinely available and highly accurate. Such a method, is however not yet available.
Procalcitonin is a 116-amino acid propeptide, of calcitonin with a molecular weight of 13, kDa [8]. It has been introduced as an early, marker of severe infection and inflammation, [9, 10]. Several studies [11, 12, 13, 14, 15, 16, 17, 18, 19, 20] have evaluated the usefulness, of procalcitonin as a predictor of severity and, the development of infected necrosis in acute, pancreatitis.
In view of the conflicting reports of the, diagnostic accuracy of procalcitonin in, predicting the severity of pancreatitis, we, aimed at adopting a meta-analytic approach, for arriving at a conclusion regarding this test, as a predictor of severity.
METHODS
We systematically searched MEDLINE and, EMBASE for all relevant articles until, November 2004. We first researched medical, subject heading (MeSH) terms and textwords, for "Markers" AND "Acute Pancreatitis"., Secondly, we researched MeSH terms and, textwords for "Procalcitonin" AND "Acute, Pancreatitis" AND "Severity". We then, combined the two searches and retrieved all, the relevant articles found by either search., The manual search was carried out by looking, at the reference lists of the retrieved articles, and the Index Medicus. All the relevant, articles thus obtained were combined with, those obtained from the electronic search
Data Extraction
Two investigators conducted the search, independently. Studies in which at least one, of the markers for predicting the severity of, pancreatitis using procalcitonin were, included. Studies had to present the sensitivity, and specificity of the procalcitonin test as a, predictor of the severity of pancreatitis to be, considered for inclusion. Otherwise, the study, had to present enough data to allow them to, be calculated. Studies conducted exclusively, in patients with post-ERCP pancreatitis, and, those evaluating outcomes other than the severity of pancreatitis, such as the, development of infected necrosis or multiple, organ failure only, were excluded from the, evaluation.
Analysis
A summary receiver operating curve (SROC), as described previously [21] was generated., Briefly, in tests of diagnostic accuracy,, sensitivity and specificity are calculated using, a particular threshold. For the determination, of sensitivity and specificity, a threshold, value is generally decided a priori. Several, studies done to evaluate the effectiveness of a, particular diagnostic test in predicting some, outcomes may show different sensitivity and, specificity values because of different, thresholds. SROC is a method of pooling the, results of different studies to judge the, predictive value of a test. The following, parameters were calculated from the studies:, true positive (TP), false negative (FN), false, positive (FP) and true negative (TN). The true, positive rates (TPR) and false positive rates, (FPR) were converted to their logistic, transformations by using the formulae given, below:
Logit (TPR) = ln (TPR / (1 - TPR))
Logit (FPR) = ln (FPR / (1 - FPR))
The sum (S) and difference (D) of the two, transformations were then calculated:
S = Logit (TPR) + Logit (FPR)
D = Logit (TPR) - Logit (FPR)
D is equivalent to the diagnostic log-odds, ratio (ln(OR)), which conveys the accuracy of, the test in discriminating cases from noncases., S can be interpreted as a measure of the, diagnostic threshold, with high values, corresponding to liberal inclusion criteria for, cases. S = 0 when TPR= 1 - FPR, that is, on, the anti-diagonal from the top-left to bottomright, corners of the SROC space [22]., Next, in order to estimate the relationship, between D and S, the two were adapted to a, linear model:
D = b S + i
The coefficient b represents the dependence, of the test accuracy on the threshold; if b is, near 0, then the studies are homogeneous and, can by summarized by an overall OR, noting, that i = ln(OR). If b is not equal to 0, then the, studies are heterogeneous with respect to OR., In this case, i can be thought of as the value of, ln(OR) when S = 0 [22].
Weights were employed to reflect inter-study, heterogeneity with respect to the sample, variance of D [22]. The weighting parameter, ‘w’ was defined as:
w=1/(1/(TP+0.5)+1/(FN+0.5)+1/(TN+0.5)+1/(FP+0.5))
Both weighted and unweighted regression line, parameters b and i were obtained., These values were then utilized to return to, the transformed values for TPR as given by, the following formula:
TPR=1/(1+(1/(ei/(1-b).(FPR/(1-FPR))(1+b)/(1-b))))
A plot between TPR thus obtained and FPR, gave the SROC.
STATISTICS
Estimates were tested vs. 0 by the t-test and, were reported together with their standard, errors (SE) and 95% confidence intervals, (CI). The chi-squared test and linear, regression were applied. The statistical, analyses were performed by running the SPSS, (version 8.0 for Windows) using a personal, computer.
RESULTS
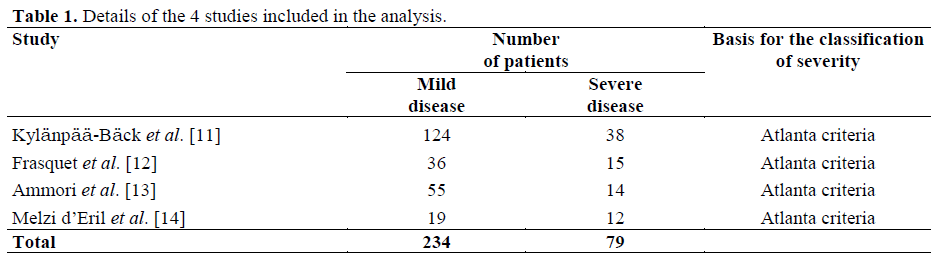
Ten studies were identified [11, 12, 13, 14, 15, 16, 17, 18, 19, 20] out of which four [11, 12, 13, 14] were finally included in the, analysis (Figure 1). The details of the studies, included are given in Table 1. These studies, included a total of 313 patients with acute, pancreatitis. These patients had been, categorized into mild and severe cases, irrespective of the etiology of the pancreatitis., The TP, FP, FN, TN values, their logit, transformed values and the 95% confidence, intervals are given in Table 2.
Figure 1. Flowchart of studies evaluated for inclusion
in the meta-analysis.

The parameters b and i (±SE) obtained from, these data by unweighted regression analysis, (r=0.968; P=0.016) were 3.584±0.381 (95%, CI: 1.946-5.222; P=0.011) and 1.297±0.166, (95% CI: 0.580-2.013; P=0.016), respectively., The values for b and i for weighted regression, line (r=0.964; P<0.001) were 3.601±0.142, (95% CI: 3.280-3.922; P<0.001) and, 1.332±0.085 (95% CI: 1.139-1.524; P<0.001),, respectively. Both the estimated b values were, significantly different from 0 and, therefore,, the studies resulted heterogeneous with, respect to OR.
The unweighted SROC generated from the, reverse extrapolated values of TPR plotted, against FPR demonstrates that procalcitonin is not a good predictor of the severity of acute, pancreatitis (Figure 2). Out of the 4 studies, included in our analysis, two showed very, low sensitivities [12, 14], and paradoxically,, higher false positive rates than the other two, studies [11, 13]. To rule out random error as, being a cause of such a finding [23], TPR, values were confirmed to be nonhomogeneously, distributed among the 4, studies (P<0.001), while no significant, differences were obtained for FPR values, (P=0.750).
Figure 2. Summary receiver operating (SROC) curve
for procalcitonin as a marker of the severity of acute
pancreatitis.
Moreover, the regression coefficient for TPR, and FPR was negative (r = -0.894) when all, the studies were considered, suggesting that,, basically, a valid SROC curve cannot be, found using the present data, and therefore, a, single summary curve should not be, constructed [23].
DISCUSSION
In our study, we have used a relatively new, approach of meta-analyzing diagnostic, studies, namely the SROC method for, assessing the utility of procalcitonin as a, predictor of the severity of acute pancreatitis., Reports on diagnostic tests when being, evaluated in the initial stages, may show a, large discrepancy. Such a situation was also, observed for ‘procalcitonin’ as a marker for the severity of acute pancreatitis. A plot, between TPR and FPR at various thresholds,, the ROC plot, is commonly used in presenting, the report of a single study. SROC curves, give a good overview of pooled results of, several studies [24]., The results of our meta-analysis show that, procalcitonin may not be a useful marker for, estimating the severity of acute pancreatitis., Several elements of this analysis merit further, discussion. First, two studies [12, 14] showed very low, sensitivity, and paradoxically, higher false, positive rates than the other two studies [11,, 13]. In view of this lack of a monotonically, increasing relationship between TPR and FPR, in two of the studies included in our metaanalysis,, we needed to rule out random error, as being a cause of such a finding [23]. This, was done showing that the TPRs were not, found to be homogenous. Because of this lack, of homogeneity among the studies, pooling of, such data may be problematic. However,, exclusion of negative studies from systematic, reviews and meta-analyses may not be the, best approach [24] since they already suffer, the drawback of publication bias (negative, studies are less likely to be published)., Therefore, we decided to include all eligible, studies in our meta-analysis.q
There may be several reasons for the, heterogeneity observed. First, studies showing, procalcitonin to be a poor marker of the, severity of pancreatitis had a greater, percentage (70% versus 35%) of patients with, pancreatitis of biliary origin [12, 14] and it, has been observed that procalcitonin may not, be a sensitive marker for this type of, pancreatitis [14, 18]. This could have, contributed to the heterogeneity observed., Secondly, different assay techniques (manual, methods or kits) were used in different, studies. Also, the coefficient of variation was, not reported by any of the studies. These, factors may also have contributed to the, heterogeneity. Thirdly, the time of blood, sampling with respect to the onset of, symptoms may also lead to some discrepancy, in test results. For example, in one study [11], showing good correlation of procalcitonin, with severity, the procalcitonin was measured, even after 4 days of the onset of the, symptoms and in another [12] showing poor, correlation, the measurement was done early, (within the first 24 hours of the onset of, symptoms). Since the markers of severity may, be highly time-sensitive [12], such differences, can also account for the heterogeneity among, the studies.
It is well-known that the closer the ROC and, the SROC curves are to the upper left-hand quadrant, the more accurate they are, because, the TPR is 1 and the FPR is 0. The SROC, curve obtained by us does not lie in the upper, left quadrant as would be desired. Other than, the explanations given above, a small sample, size (with respect to both the number of, studies available for analysis as well as the, number of patients included in each study), may be another possible explanation for our, SROC curve not occupying the upper lefthand, corner [22]. The total sample size in our, study was 313 patients, with two studies [12,, 14] having sample sizes less than fifty., However, the position of the graphical points, obtained in the subgroup analysis shown in, Figure 2 may be expected to result in an, optimal SROC curve provided a larger, number of studies with similar results are, available.
Other studies [15, 18] have evaluated, procalcitonin as a predictor of the, development of complications such as, pancreatic necrosis, multiple dysfunction, syndrome, but not for the severity of the, disease per se. Our exclusion criteria did not, permit us to incorporate these studies in our, analysis.
In a review on biological markers for, assessing the severity of acute pancreatitis [3],, procalcitonin was considered to be a good, marker in predicting disease severity early on, and it was assigned to category ‘A’. However,, in this review, studies [12, 14] showing low, sensitivity of procalcitonin as a marker for, severity were not mentioned.
In conclusion, a valid SROC curve cannot be, found in our data and this result indicates that,, from the data available so far, procalcitonin, cannot be considered a good marker for, assessing the severity of acute pancreatitis., Studies with larger numbers of patients, with, more homogenous patient populations, and, better correlation between the onset of, symptoms and blood sampling and more, similarity in the assay techniques are required, in order to resolve the issue.
Acknowledgements
Ashok Saluja, UMASS,, and the Editor of Hepatogastroenterology for, providing us some of the articles for our, meta-analysis
References
- Steinberg W, Tenner S. Acute pancreatitis. N Engl J Med 1994; 330:1198-210. [PMID 7811319]
- Barie PS. A critical review of antibiotic prophylaxis in severe acute pancreatitis. Am J Surg 1996; 172:38S-43S. [PMID 9003689]
- Werner J, Hartwig W, Uhl W, Muller C, Buchler MW. Useful markers for predicting severity and monitoring progression of acute pancreatitis. Pancreatology 2003; 3:115-27. [PMID 12748420]
- Kivisaari L, Somer K, Standertskjold-Nordenstam CG, Schroder T, Kivilaakso E, Lempinen M. Early detection of acute fulminant pancreatitis by contrastenhanced computed tomography. Scand J Gastroenterol 1983; 18:39-41 [PMID 6675177]
- London NJ, Neoptolemos JP, Lavelle J, Bailey I, James D. Contrast-enhanced abdominal computed tomography scanning and prediction of severity of acute pancreatitis: a prospective study. Br J Surg 1989; 76:268-72. [PMID 2720324]
- Ranson JH, Rifkind KM, Roses DF, Fink SD, Eng K, Spencer FC. Prognostic signs and the role of operative management in acute pancreatitis. Surg Gynecol Obstet 1974; 139:69-81. [PMID 4834279]
- Wilson C, Heath DI, Imrie CW. Prediction of outcome in acute pancreatitis: a comparative study of APACHE II, clinical assessment and multiple factor scoring systems. Br J Surg 1990; 77:1260-4. [PMID 2253005]
- Oczenski W, Fitzgerald RD, Schwarz S. Procalcitonin: a new parameter for the diagnosis of bacterial infection in the peri-operative period. Eur J Anaesthesiol 1998; 15:202-9. [PMID 9587727]
- Oberhoffer M, Vogelsang H, Russwurm S, Hartung T, Reinhart K. Outcome prediction bytraditional and new markers of inflammation in patients with sepsis. Clin Chem Lab Med 1999; 37:363-8. [PMID 10353484]
- Hensel M, Volk T, Docke WD, Kern F, Tschirna D, Egerer K, et al. Hyperprocalcitonemia in patients withnoninfectious SIRS and pulmonary dysfunction associated with cardiopulmonary bypass. Anaesthesiology 1998; 89:93-104 [PMID 9667299]
- Kylanpaa-Back ML, Takala A, Kemppainen E, Puolakkainen P, Haapiainen R, Repo H. Procalcitonin streip test in the early prediction of severe acute pancreatitis. Br J Surg 2001; 88:222-7. [PMID 11167871]
- Frasquet J, Saez J, Trigo C, Martinez J, Such J, Perez-Mateo M. Early measurement of procalcitonin does not predict severity in patients with acute pancreatitis. Br J Surg 2003; 90:1129-30. [PMID 12945081]
- Ammori BJ, Becker KL, Kite P, Snider RH, Nylen ES, White JC, et al. Calcitonin precursors in the prediction of severity of acute pancreatitis on the day of admission. Br J Surg 2003; 90:197-204. [PMID 12555296]
- Melzi D'Eril GV, Merlini G, Finazzi S, Bosoni T, Barakat B, Pezzilli R. Procalcitonin is not a reliable marker for the assessment of severity in acute pancreatitis without infectious complications. Clin Chem 2000; 46:428-430 [PMID 10702536]
- Kylanpaa-Back ML, Takala A, Kemppainen EA, Puolakkainen PA, Leppaniemi AK, Karonen SL, et al. Procalcitonin, soluble interleukin-2receptor, and soluble E-selectin in predicting the severity of acute pancreatitis. Crit Care Med 2001; 29:63-9. [PMID 11176162]
- Muller CA, Uhl W, Printzen G, Gloor B, Bischofberger H, Tcholakov O, Buchler MW. Role of procalcitonin and granulocyte colony stimulating factor in the early prediction of infected necrosis in severe acute pancreatitis. Gut 2000; 46:233-8. [PMID 10644318]
- Oezcueruemez-Porsch M, Kunz D, Hardt PD, Fadgyas T, Kress O, Schulz HU, et al. Diagnostic relevance of interleukin pattern, acute-phase proteins, and procalcitonin in early phase of post-ERCP pancreatitis. Dig Dis Sci 1998; 43:1763-9. [PMID 9724166]
- Rau B, Steinbach G, Gansauge F, Mayer JM, Grunert A, Beger HG. The potential role of procalcitonin and interleukin-8 in the prediction of infected necrosis in acute pancreatitis. Gut 1997; 41:832-40. [PMID 9462219]
- Pindak D, Parrak V, Pechan J, Vavrecka A, Kuzela L, Fuchs D, Irsakova J. The clinical value of procalcitonin in prediction of severity and outcome in acute pancreatitis. Hepatogastroenterology 2003; 50(Suppl II):28-9. [PMID 15244180]
- Pezzilli R, Melzi d'Eril GV, Morselli-Labate AM, Merlini G, Barakat B, Bosoni T. Serum amyloid A, procalcitonin, and C-Reactive protein in early assessment of severity of acute pancreatitis. Dig Dis Sci 2000; 45:1072-8. [PMID 10877218]
- Littenberg B, Moses LE. Estimating diagnostic accuracy from multiple conflicting reports: A new meta-analysis method. Med Decis Making 1993; 13:313-21. [PMID 8246704]
- Walter SD. Properties of the summary receiver operating characteristic (SROC) curve for diagnostic test data. Stat Med 2002; 21:1237-56. [PMID 12111876]
- Midgette AS, Stukel TA, Littenberg B. A metaanalytic method for summarizing diagnostic test performances: receiver-operating-characteristicsummary point estimates. Med Decis Making 1993; 13:253-7. [PMID 8412556]
- Sutton AJ, Abrams KR, Jones DR, Sheldon TA, Song F. In Methods for meta-analysis in medical research. John Wiley & Sons Ltd. New York. 2000 ; 205-28]