May E Montasser*, Yu-Ching Cheng, Keith Tanner, Alan R Shuldiner and Jeffrey R O’Connell
Department of Medicine, School of Medicine, University of Maryland, Baltimore, MD, USA
*Corresponding Author:
May E Montasser
Department of Medicine, Program for Personalized and Genomic Medicine
School of Medicine, University of Maryland
Baltimore, MD, USA.
Tel: 410-706-1514
Fax: 410-706-1622
E-mail: mmontass@som.umaryland.edu
Received date: May 25, 2017; Accepted date: June 12, 2017; Published date: June 16, 2017
Citation: Montasser ME, Cheng YC, Tanner K, et al. Epigenetic Signature of Impaired Fasting Glucose in the Old Order Amish. J Clin Epigenet. 2017, 3:18. doi: 10.21767/2472-1158.100052
Copyright: © 2017 Tanner K, et al. This is an open-access article distributed under the terms of the Creative Commons Attribution License, which permits unrestricted use, distribution, and reproduction in any medium, provided the original author and source are credited.
Keywords
Old Order Amish (OOA); DNA methylation; Impaired Fasting Glucose (IFG)
Introduction
Type 2 Diabetes (T2D) is a common chronic disease with substantial disease burden and economic impact. Lifestyle changes can significantly alter the course of the disease, notably if detected prior to having established diabetes. However, needed pre-clinical markers of disease are still lacking to enable early detection. Such markers would potentially have the greatest impact on disease progression by allowing targeted early interventions. Besides genetics and environmental factors, epigenetic changes have emerged as playing a significant role in T2D development and progression. Indeed, DNA methylation, a key epigenetic modification of gene expression, has been linked to several diseases and traits [1,2], including T2D [3-8] and its glycemic traits [9,10]. An early Epigenome-Wide Association Study (EWAS) found significant hypomethylation in the FTO gene within T2D patients compared to healthy controls [11]. Using pancreatic islets from 15 T2D patients and 34 controls, significant differential methylation levels were identified in several genes including some well-known diabetes related genes like TCF7L2 and KCNQ1 [4]. Subsequent studies identified several loci but results did not overlap [3,8-9] with the exception of TXNIP which has been found to be significantly associated with T2D in 3 recent studies [5-7].
These results suggest that the DNA methylation signatures may serve as biomarkers for early detection of increased T2D risk. However, these studies were cross sectional, and thus unable to distinguish between changes in methylation that predate the development of diabetes versus those caused by it. The cross sectional nature of these studies may, at least partially, explain the lack of consistency between their results.
To overcome this limitation we used a longitudinal study design to identify differentially methylated sites between 24 normoglycemic Old Order Amish (OOA) individuals who later developed IFG (cases), and 24 OOA individuals who remained normoglycemic after an average follow up of 10 years (controls).
Dissecting epigenetic causes and consequences of the disease can help in early disease prediction, better understanding of the molecular mechanisms of the disease, and identifying potential new drug targets.
Materials and Methods
Study samples
The OOA first emigrated from Central Europe (mainly Switzerland) to America in the 1700s. Currently, there are about 30,000 OOA living in Lancaster County. They maintain detailed genealogical records and nearly all Amish can trace their ancestry back to approximately 750 original founding individuals. The Lancaster Amish are mostly farmers, do not use modern technology, and have a very homogeneous life style. Both the environmental and genetic homogeneity of this community make it excellent for genetic and epigenetic studies, as methylation levels can be affected by both genetic and environmental factors. The Amish Complex Disease Genetic Program [12] has been studying a variety of complex traits and diseases over the last 20 years and has recruited more than 7,000 subjects, many of whom have participated in several studies [13-16]. By searching our database, we were able to identify 24 normoglycemic OOA individuals ( 70 ≤ fasting glucose (FG) <100 mg/dL and 75 g Oral Glucose Tolerance Test (OGTT) post-load glucose: <140 mg/dL) who later developed IFG (100 ≤ FG < 126 mg/dL) (cases), and 24 OOA individuals who remained normoglycemic after an average follow up of 10 years (controls). Cases and controls were matched on age, sex, BMI, baseline FG, and glucose levels 2 h post 75 g OGTT.
The samples used in this study were selected from the participants of Amish Family Diabetes Study [13]. The study protocol was approved by the institutional review board at the University of Maryland. Informed consent was obtained from each of the study participants.
Methylation chip and QC
Genome-wide DNA methylation profiling for the baseline whole blood was performed using the Illumina Infinium Human Methylation 450K Bead chip array (450K) [17]. Sample preparation and hybridization were performed by the same technician, and the arrays were processed using the same scanner to reduce batch effects. Genome Studio (GS) (V2011.1) was used to process the raw intensity files and perform both sample and probe QC. GS normalization and background correction were applied according to Illumina’s recommendation. Examining internal control probes did not identify any samples for removal, and all samples had >95% of probes detected with average p-value < 0.01. Probes with average detection p-value >0.01 or call rate < 95% were removed from analysis. In addition sex chromosome probes and previously identified cross-reactive probes [18-20] were excluded, thus leaving 318,165 probes for analysis, of which only 274,088 were successfully tested (the model didn't converge for some probes with low variation). Blood cell subtype composition was estimated using the Housman method [21,22].
Statistical analysis
To test global methylation, the mean beta value of all probes per individual was calculated. To test for methylation per different genomic annotation, we also calculated the mean beta values for probes within each genomic region or distance to CpG Island according to Illumina’s manifest.
Mixed model analysis was used to calculate the inverse normalized residual of the methylation level of each probe (in single probe analysis or mean values in global/regional methylation test) adjusted for age, sex, cell subtype composition, and technical covariates as fixed effects, as well as the family structure as a random effect. Linear regression was used to test the association between each inverse normalized residual as a dependent variable with case control status. A conservative Bonferroni corrected p value of 1.8E-7 was used as the significance threshold.
Results
The overall design of this study is shown in Figure 1. The study used 24 normoglycemic OOA individuals (70 ≤ FG < 100 mg/dL and 75 g OGTT post-load glucose: <140 mg/dL) who later developed Impaired Fasting Glucose (IFG) (100 ≤ FG < 126 mg/dL) (cases), and 24 OOA individuals who remained normoglycemic after an average follow up of 10 years (controls). Cases and controls were matched on age, sex; BMI, baseline fasting glucose, and glucose level 2 h post 75 g OGTT as shown in Table 1.
| |
Cases (n=24) |
Controls (n=24) |
p-value |
| Age at baseline, years |
42.5 (6.9) |
42.4 (7.7) |
0.9 |
| BMI at baseline, kg/m2 |
29.3 (3.5) |
28.4 (3.6) |
0.3 |
| Fasting glucose at baseline, mg/dL |
91.1 (5.2) |
88.7 (5.2) |
0.1 |
| 2h OGTT at baseline, mg/dL |
103.6 (18.0) |
102.0 (22.2) |
0.7 |
| Duration of follow-up, years |
9.5 (3.4) |
10.2 (3.7) |
0.5 |
| Fasting glucose at follow-up , mg/dL |
106.6 (6.1) |
85.9 (7.3) |
6.93E-14 |
Table 1: Descriptive characteristics of the study population in mean (sd).
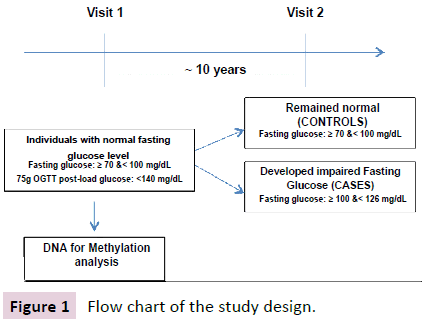
Figure 1: Flow chart of the study design.
There was no significant difference in global methylation between cases and controls (p=0.22). There was also no difference in methylation levels for probes annotated based on their gene region or distance to CpG Island (Figures 2 and 3) between cases and controls. However, the pattern of methylation across the genome showed the lowest mean and variance methylation level in the promoter region that includes the 1st exon, TSS200 (200 base pairs within the Transcription Start Site), 5’ UTR and TSS1500 (1500 base pairs within the TSS excluding the TSS200 region) while higher methylation level and variance was found in the gene body, 3’ UTR, and intergenic probes. In terms of distance from islands, the lowest mean and variance methylation level was found for probes located in CpG islands, followed by those in shores (0-2 kb around the CpG Island). Probes in shelves (2-4 kb around the CpG Island) and open sea had the highest mean and variance.
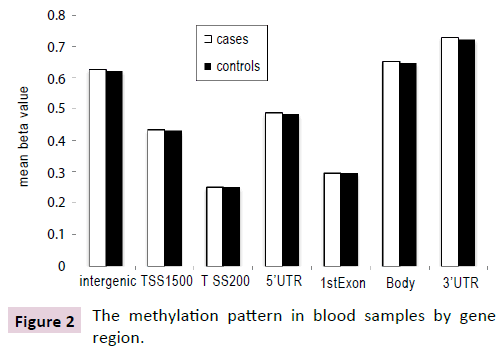
Figure 2: The methylation pattern in blood samples by gene region.
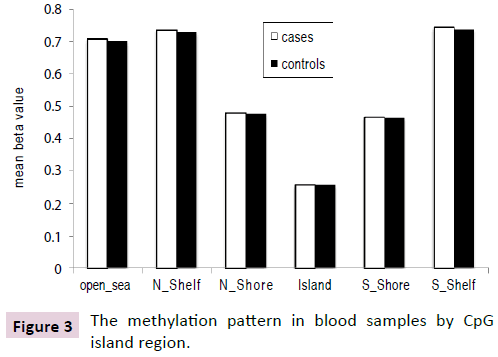
Figure 3: The methylation pattern in blood samples by CpG island region.
Of the 274,088 successfully tested probes, we identified 17,702 probes with p-value <0.05 which is significantly higher than that expected by chance alone (p=2.2E-16, X2 test). While no probe reached the genome wide significance threshold of 1.8E-7, we identified 34 probes with suggestive p-values <1.0E-5, 23 of which are located inside genes (Table 2). Nine of the 34 sites were hypomethylated in cases, while 25 were hypermethylated. Twelve of the 34 sites were located inside enhancer region.
| ILMNID |
Hypo/Hyper p-value |
Chr |
Pos |
Gene |
Gene region |
Relation to island |
Enhancer |
| cg02333875 |
↑ |
7.19E-06 |
6 |
29618205 |
|
|
S_Shore |
TRUE |
| cg23606751 |
↓ |
1.67E-05 |
14 |
62228873 |
SNAPC1 |
TSS1500 |
N_Shore |
|
| cg07875069 |
↑ |
2.27E-05 |
7 |
129985025 |
CPA5 |
1stExon |
|
TRUE |
| cg19412743 |
↓ |
2.95E-05 |
4 |
190747919 |
|
|
|
TRUE |
| cg13916874 |
↑ |
3.14E-05 |
6 |
4286300 |
|
|
S_Shelf |
|
| cg01403103 |
↓ |
3.33E-05 |
16 |
112852 |
RHBDF1 |
Body |
Island |
|
| cg17257444 |
↑ |
3.76E-05 |
11 |
59224044 |
0R4D6 |
TSS1500 |
|
|
| cg22387253 |
↑ |
3.95E-05 |
15 |
61310104 |
RORA |
Body |
|
TRUE |
| cg21464903 |
↑ |
4.12E-05 |
8 |
41220059 |
|
|
|
TRUE |
| cg14442421 |
↑ |
4.31E-05 |
9 |
19788257 |
SLC24A2 |
TSS1500 |
Island |
|
| cg21062902 |
↑ |
4.34E-05 |
6 |
34162022 |
|
|
N Shelf |
|
| cg22212260 |
↑ |
4.62E-05 |
3 |
33468135 |
UBP1 |
Body |
|
TRUE |
| cg16218910 |
↑ |
4.76E-05 |
17 |
78878579 |
RPTOR |
Body |
N_Shore |
|
| cg10796022 |
↑ |
4.83E-05 |
8 |
61227705 |
|
|
|
TRUE |
| cg23254538 |
↑ |
4.90E-05 |
6 |
31556919 |
NCR3 |
3'UTR |
|
|
| cg10981651 |
↑ |
4.98E-05 |
5 |
153853545 |
|
|
Island |
TRUE |
| cg08031810 |
↑ |
5.10E-05 |
2 |
52856918 |
|
|
Island |
|
| cg23200357 |
↑ |
5.16E-05 |
21 |
33108677 |
|
|
S_Shelf |
|
| cg19872284 |
↑ |
5.23E-05 |
10 |
49607582 |
|
|
|
TRUE |
| cg21944022 |
↑ |
5.28E-05 |
5 |
178288650 |
ZNF354B |
Body |
S_Shore |
|
| cg13491945 |
↑ |
5.37E-05 |
12 |
107078410 |
RFX4 |
TSS200 |
|
|
| cg11617821 |
↑ |
6.17E-05 |
4 |
75672135 |
BTC |
3'UTR |
|
|
| cg06002516 |
↑ |
6.32E-05 |
12 |
57666521 |
R3HDIv12 |
Body |
|
TRUE |
| cg13853141 |
↓ |
6.65E-05 |
2 |
98329942 |
ZAP70 |
TSS200 |
|
|
| cg25375293 |
↓ |
6.87E-05 |
12 |
54718868 |
COPZ1 |
TSS200 |
|
|
| cg13993764 |
↑ |
6.88E-05 |
4 |
102269779 |
PPP3CA |
TSS1500 |
S_Shore |
|
| cg07904475 |
↓ |
7.04E-05 |
4 |
151500931 |
LRBA |
Body |
Island |
TRUE |
| cg21120478 |
↓ |
7.78E-05 |
12 |
6833063 |
COPS7A |
TSS200 |
Island |
|
| cg01382688 |
↓ |
7.91E-05 |
2 |
131672054 |
|
|
N_Shore |
|
| cg00154957 |
↑ |
8.84E-05 |
1 |
109850562 |
IvlYBPHL |
TSS1500 |
|
|
| cg10196026 |
↑ |
9.01E-05 |
5 |
35003575 |
AGA-2 |
Body |
|
|
| cg13050884 |
↑ |
9.45E-05 |
3 |
171976122 |
FNDC3B |
Body |
|
TRUE |
| cg16997488 |
↓ |
9.70E-05 |
5 |
52083949 |
ITGA1:PELO |
1stExon |
Island |
|
| cg00096979 |
↑ |
9.93E-05 |
16 |
2116141 |
TSC2 |
Body |
S_Shore |
|
ILMNID: Illumina probe ID, ↑ Hypermethylated in cases, ↓ Hypomethylated in cases, Chr: Chromosome, Pos: Position build 37
Table 2: The top 34 probes associated with impaired fasting glucose.
None of the top 34 probes was previously reported among 1828 probes that were identified in previous studies [3-7], however, out of these 1828 probes, 1219 were tested in our study and 80 of them had a p-value <0.05, including those in insulin like growth factor 1 receptor (IGF1R).
Discussion and Conclusion
The aim of this study was to identify methylation sites associated with IFG that could be used as biomarkers for early detection of individuals at high risk of T2D to target for preventive intervention. We compared methylation profiles of 24 normoglycemic Old Order Amish (OOA) individuals who later developed IFG (cases), and 24 OOA individuals who remained normoglycemic after an average follow up of 10 years (controls).
We were unable to find significant differences in global methylation levels by gene region or distance to island between cases and controls in our study. To date the evidence for the association between global methylation and T2D or glycemic traits has been inconsistent, ranging from positive association to negative association and no association at all [23]. The differences in study design, power, tissue, and methylationprofiling technique may explain these discrepancies.
This distribution of the mean and variance of the methylation levels based on genomic region and distance to CpG islands in our blood samples was similar to the pattern reported for adipose tissue [3,24] and human pancreatic islets, alpha and beta cells [4], adding support to the use of blood samples in T2D studies as blood reflects the same methylation pattern of other T2D relevant tissues. Promoter regions are conserved and have low variation in methylation due to their important role in gene regulation [24]. Highly variable hypermethylated sites in intergenic and open sea regions were found to be enriched with significantly differentially methylated sites between T2D cases and controls [4], showing that highly variable sites are more likely to be associated with T2D and glycemic traits.
While our single probe analysis did not identify any significant association with case-control status after multiple testing, our 34 top identified probes included several within genes with interesting biological links to T2D and glycemic traits. Identified genes include the Betacellulin gene (BTC) that plays a role in pancreatic cell proliferation and insulin secretion and the integrin subunit alpha 1 (ITGA1), a known bone mineral density (BMD) gene that was recently found to be associated also with T2D and glycemic traits, providing a possible explanation of the link between T2D and BMD [25], as well as the regulatory associated protein of MTOR complex 1 gene (RPTOR) and the Tuberous Sclerosis 2 gene (TSC2) both of which are part of insulin signaling pathway [25].
The major strength of our study is its unique design, however, this unique design made it hard to find a large number of samples that satisfy the inclusion criteria. Among our 7,313 banked Amish samples, 1,442 of them have repeated measures, but the only samples identified to fit the study design criteria were these 48. All other repeated samples were either normoglycemic at alltime points or diabetic/prediabetic at all-time points, illustrating the challenges most studies will have to achieve well-powered sample sizes. The ideal study design to distinguish between methylation sites that cause disease or a consequence of disease is a longitudinal study that follows up a very large number of individuals over several decades, but this is very costly and lengthy endeavor. These results may shed light on the initiation and development of hyperglycemia and T2D and help to identify high-risk individuals for early intervention; however, further studies are required for validation.
Acknowledgements
We would like to thank all the Amish participants of the study. This work was funded by the University of Maryland, School of Medicine, Nutrition and Obesity Research Center (NORC) pilot and feasibility award (P30DK072488), and NIH (R01DK054261).
Conflicts of Interest
Alan R Shudiner is an employee of Regeneron Pharmaceutical Inc. Jeffrey R. O’Connell is a consultant for Regeneron Pharmaceuticals, Inc.
References
- Paul DS, Beck S (2014) Advances in epigenome-wide association studies for common diseases. Trends Mol Med 20:541-543.
- Gillberg L, Ling C (2015)The potential use of DNA methylation biomarkers to identify risk and progression of type 2 diabetes. Front Endocrinol (Lausanne) 6:43.
- Nilsson E, Jansson PA, Perfilyev A,Volkov P, Pedersen M, et al. (2014) Altered DNA methylation and differential expression of genes influencing metabolism and inflammation in adipose tissue from subjects with type 2 diabetes. Diabetes 63:2962-2976.
- Dayeh T, Volkov P, Salo S, Hall E, Nilsson E et al. (2014) Genome-wide DNA methylation analysis of human pancreatic islets from type 2 diabetic and non-diabetic donors identifies candidate genes that influence insulin secretion. PLoS Genet 10: e1004160.
- Florath I, Butterbach K, Heiss J,Bewerunge-Hudler M, Zhang Y et al. (2016)Type 2 diabetes and leucocyte DNA methylation: An epigenome-wide association study in over 1,500 older adults. Diabetologia59:130-138.
- Kulkarni H, Kos MZ, Neary J, Dyer TD, Kent JW,et al. (2015) Novel epigenetic determinants of type 2 diabetes in mexican-american families. Hum Mol Genet 24:5330-5344.
- Soriano-Tarraga C, Jimenez-Conde J, Giralt-Steinhauer E,Mola-Caminal M, Vivanco-Hidalgo RM., et al.(2016) Epigenome-wide association study identifies TXNIP gene associated with type 2 diabetes mellitus and sustained hyperglycemia. Hum Mol Genet 25:609-619.
- Yuan W, Xia Y, Bell CG, Yet I, Ferreira T, et al. (2014) An integrated epigenomic analysis for type 2 diabetes susceptibility loci in monozygotic twins. Nat Commun 5:5719.
- Hidalgo B, Irvin MR, Sha J (2014) Epigenome-wide association study of fasting measures of glucose, insulin, and HOMA-IR in the genetics of lipid lowering drugs and diet network study. Diabetes 63:801-807.
- Feinberg AP, Irizarry RA, Fradin D,Aryee MJ, Murakami P, et al. (2010) Personalized epigenomic signatures that are stable over time and covary with body mass index. SciTransl Med 2:49ra67.
- Toperoff G, Aran D, Kark JD, Rosenberg M, Dubnikov T, et al.(2012) Genome-wide survey reveals predisposing diabetes type 2-related DNA methylation variations in human peripheral blood. Hum Mol Genet 21:371-383.
- https://www.medschool.umaryland.edu/endocrinology/Amish-Research-Program/
- Hsueh WC, Mitchell BD, Aburomia R,Pollin T, Sakul H, et al. (2000) Diabetes in the old order amish: Characterization and heritability analysis of the amish family diabetes study. Diabetes Care 23:595-601.
- Mitchell BD, McArdle PF, Shen H, Rampersaud E, PollinTI ,et al. (2008)The genetic response to short-term interventions affecting cardiovascular function: Rationale and design of the heredity and phenotype intervention (HAPI) heart study. Am Heart J 155:823-828.
- Post W, Bielak LF, Ryan KA, Cheng YC, Shen H, et al. (2007) Determinants of coronary artery and aortic calcification in the old order amish. Circulation 115:717-724.
- Shuldiner AR, O'Connell JR, Bliden KP, Gandhi A, Ryan K, et al. (2009)Association of cytochrome P450 2C19 genotype with the antiplatelet effect and clinical efficacy of clopidogrel therapy302:849-857.
- Bibikova M, Barnes B, Tsan C, Ho V, Klotzle B et al.(2011) High density DNA methylation array with single CpG site resolution. Genomics 98:288-295.
- Dedeurwaerder S, Defrance M, Bizet M, Calonne E, Bontempi G, et al. (2014)A comprehensive overview of infinium HumanMethylation450 data processing. Brief Bioinform15:929-941.
- Chen YA, Lemire M, Choufani S,Butcher DT, Grafodatskaya D, et al. (2013)Discovery of cross-reactive probes and polymorphic CpGs in the illuminainfinium HumanMethylation450 microarray. Epigenetics 8:203-209.
- Moen EL, Zhang X, Mu W, Delaney SM, Wing C, et al.(2013) Genome-wide variation of cytosine modifications between european and african populations and the implications for complex traits. Genetics 194:987-996.
- Houseman EA, Accomando WP, Koestler DC, Christensen BC, Marsit CJ, et al. (2012)DNA methylation arrays as surrogate measures of cell mixture distribution. BMC Bioinformatics 13:86-2105-13-86.
- Jaffe AE, Irizarry RA (2014) Accounting for cellular heterogeneity is critical in epigenome-wide association studies. Genome Biol15:R31-2014-15-2-r31.
- Muka T, Nano J, Voortman T, Braun KV, Ligthart S, et al. (2016) The role of global and regional DNA methylation and histone modifications in glycemic traits and type 2 diabetes: A systematic review. NutrMetabCardiovasc Dis 26:553-566.
- Grundberg E, Meduri E, Sandling JK,Hedman AK, Keildson S, et al. (2013) Global analysis of DNA methylation variation in adipose tissue from twins reveals links to disease-associated variants in distal regulatory elements. Am J Hum Genet 93:876-890.
- Billings LK, Hsu YH, Ackerman RJ, Dupuis J, Voight BF, et al. (2012) Impact of common variation in bone-related genes on type 2 diabetes and related traits. Diabetes 61:2176-2186.