Keywords
Diagnosis; Endosonography; Pancreatitis
Abbreviations
CP: chronic pancreatitis
INTRODUCTION
Chronic pancreatitis (CP) has been defined as an inflammatory disease of the pancreas characterized by irreversible morphological (parenchymal and ductal) changes causing loss of both endocrine and exocrine functions [1, 2]. Alcohol consumption (80-150 g/day) is related to 60-80% of cases and patients usually have a long history of abuse (6-12 years) [1, 2, 3, 4, 5].
The diagnosis of CP is based on clinical features, morphologic changes and functional abnormalities. In the early stages of the disease, the diagnosis remains challenging and agreement between various methods is poor [1, 6, 7, 8].
Many diagnostic tests have been proposed to assess pancreatic functional status and anatomic changes. Functional tests probably miss the diagnosis in the early stages because of exocrine pancreas functional reserve. Imaging studies, such as computed tomography (CT) and abdominal ultrasonography (US), also have poor resolution, especially in the initial stages. Endoscopic retrograde cholangiopancreatography (ERCP) is still considered the most accurate method of assessing ductal anatomy [1, 2]. However, parenchymal abnormalities can be missed and post-procedure acute pancreatitis may occur in 5-10% of patients [9, 10]. Although these exams may be good indicators in the advanced stages, the same is not true in earlystage disease. Therefore, a method able to assess the early stages of both parenchymal and ductal irregularities with minimal risk would be of great value. Endoscopic ultrasonography (EUS) generates high resolution images of parenchymal and ductal structures without the use of contrast without risk of post-procedure pancreatitis and minimal risk of sedation. EUS can also be used to obtain pancreatic tissue and juice samples [1, 2, 8, 11, 12, 13].
We designed this study with the aim of evaluating the endosonographic evidence of early pancreatic disease in patients with a history of alcohol abuse.
PATIENTS AND METHODS
Between May 2001 and December 2003, in our institution, all consecutive patients (n=228) referred for EUS, for various nonpancreatic indications were prospectively studied to assess pancreatic parenchymal and ductal characteristics.
Initially, EUS patients responded to a questionnaire conducted by an endoscopy fellowship holder. They were privately asked about alcohol consumption and their medical history. Alcohol consumption was quantified in grams per day. The duration of alcohol abuse was also recorded. Although laboratory records were not available, every patient was asked about any suspicion of pancreatic disease or abnormal results of important blood tests.
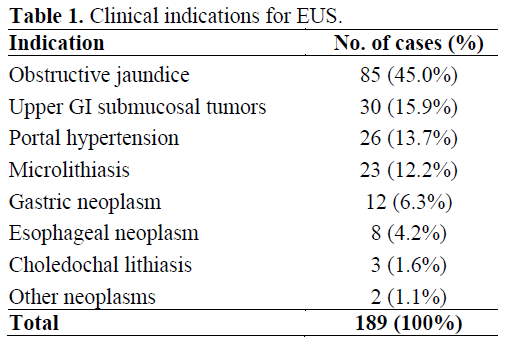
Thirty-nine patients, out of the 228 patients (17.1%), were excluded. In 23 cases, the pancreas could not be entirely assessed (e.g. previous gastrointestinal surgery, stenotic esophageal neoplasms). Among the remaining 205 patients, 16 presented with a suspicious or a previous diagnosis of CP and/or pancreatic neoplasm. Therefore, the data presented here refer to the 189 cases (82.9%) without previous known pancreatic disease who underwent a complete pancreatic examination and. The indications for EUS are summarized in Table 1.
The patients were classified into 2 groups: alcoholics and non-alcoholics. A cut-off of 80 g/day for more than 5 years was established as found in the previous literature [1, 3, 4, 5]. The endosonographer performing the examination was blinded to all these answers. EUS was performed by an experienced endosonographer (JCA) using a linear array Pentax echoendoscope with a frequency of 7.5 MHz. Pancreatic examination was considered complete if the head (from the duodenum), body and tail (from the stomach) could be evaluated. Specific parenchymal and ductal criteria were observed during EUS examinations. We used both the criteria described by Catalano et al. [6] and by Sahai et al. [7], which were first described by Lees [14] and refined by Wiersena et al. [13]. The ductal and parenchymal features described by Catalano et al. (score 1) include a duct diameter greater than 3 mm, tortuous pancreatic duct, intraductal echogenic foci, echogenic duct wall, side-branch ectasia, heterogeneous echo-pattern, reduced echogenic foci (1 to 3 mm), enhanced echogenic foci, prominent interlobular septae, lobular outer gland margin and large echopoor cavities (greater than 5 mm) [6]. The disease was classified as mild when 1 or 2 criteria were present; moderate in the presence of 3 to 5 features; and severe when more than 5 criteria were found. The criteria defined by Sahai et al. (score 2) were hyperechoic foci, hyperechoic strands, lobulation, irregular duct margin, hyperechoic duct, visible side-branches, duct dilation, calcification and cysts [7]. A gold standard test for chronic pancreatitis to evaluate our EUS results does not yet exist. Imaging tests other than EUS have no role in the early stages of the disease and ERCP or pancreatic biopsy would not be ethically justified.
STATISTICS
Data are reported as mean±SD or median, quartiles and ranges. Statistical analyses were performed by using ANOVA, Mantel- Haenszel liner by linear association, and Fisher’s exact test. We plotted a receiver operating characteristics (ROC) curve of the number of criteria in order to identify the best cut-off in order to differentiate between alcoholic and non-alcoholic patients. The best cut-off was chosen as the value which maximized the likelihood ratio (LR), computed by the following formula: LR = (probability of true positive + probability of true negative) / (probability of false positive + probability of false negative) [15]. A P value of less than 0.05 was considered statistically significant. All statistical analyses were carried-out by using the SPSS 12.0 package for Windows XP.
ETHICS
The study was approved by our Institution Ethics Committee. All patients were previously informed about the study and written informed consent was obtained. The study protocol conforms to the ethical guidelines of the "World Medical Association Declaration of Helsinki - Ethical Principles for Medical Research Involving Human Subjects" adopted by the 18th WMA General Assembly, Helsinki, Finland, June 1964, as revised in Tokyo 2004.
STATISTICS
Results were expressed as mean±SE. Statistical analyses were made using the Student t test, the Fisher’s exact test, and the McNemar test and were carried out by means of the SPPS for Windows (version 13.0). P values less than 0.05 were accepted as statistically significant.
RESULTS
Out of the 189 patients studied, 17 (9.0%) had consumed more than 80 g of alcohol per day for over 5 years, and the mean alcohol consumption was 166 g/day. Mean alcohol consumption in the non-alcoholic group was 3.5 g/day over 5 years. The male:female ratio was 7.5 (15 males and 2 females) and 0.9 (82 males and 90 females) in the alcoholic and non-alcoholic groups, respectively (P=0.002). Mean ages were 53.0±15.0 years and 47.8±9.1 years, respectively, without significant differences (P=0.165).
Patients were referred for EUS examination for various indications, such as evaluation of microlithiasis, submucosal tumors, portal hypertension, staging of esophageal tumors, and treatment of gastric varices, among others (Table 1).
Alcoholic patients had significantly more EUS abnormalities than non-alcoholics for both scores. In analyzing alcoholic versus non-alcoholic patients we encountered a higher mean number of criteria in the first group which reached statistical significance for both scores (Table 2; Figures 1 and 2). The two most common features shared by alcoholic and non-alcoholic patients according to the Catalano score were heterogeneous echo-pattern and echogenic duct wall. Considering the Sahai score system for the alcoholic group, the most common features were hyperechoic foci and hyperechoic duct while the non-alcoholic group showed more hyperechoic foci and hyperechoic strands.
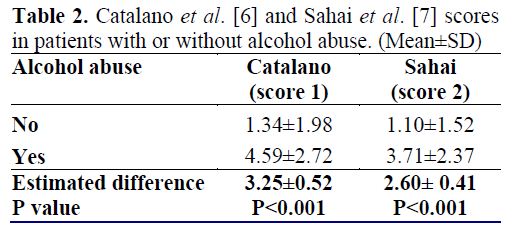
Figure 1. Box-and-whisker plot showing the
distribution of patients according to the number of
endosonographic criteria of the Catalano et al. [6]
classification system (score 1). Boxes represent the
interquartile range (IQR: i.e., the middle 50% between
the 2nd and 3rd quartiles); whiskers represent the
minimum and the maximum value in the absence of
outliers or extreme values. We have computed two
outliers (open bullets) and one extreme value (asterix)
in the non-alcoholic group. (Outliers were defined as
values between 1.5 IQRs and 3 IQRs from the end of a
box. Values more than 3 IQRs from the end of a box
were defined as extreme).
Figure 2. Box-and-whisker plot showing the
distribution of patients according to the number of
endosonographic criteria of the Sahai et al. [7]
classification system (score 2). Boxes represent the
interquartile range (IQR: i.e., the middle 50% between
the 2nd and 3rd quartiles); whiskers represent the
minimum and the maximum value in the absence of
outliers. We have computed one outlier (open bullet) in
the non-alcoholic group. (Outliers were defined as
values between 1.5 IQRs and 3 IQRs from the end of a
box.
According to Catalano’s endosonographic classification of the severity of pancreatic disease which has previously been described, 133 (77.3%) non-alcoholic patients had mild pancreatic abnormalities, 31 (18.0%) had moderate and 8 (4.7%) had severe. In the alcoholic group, 4 (23.5%) had mild pancreatic abnormalities, 6 (35.3%) had moderate and 7 (41.2%) had severe (P<0.001).
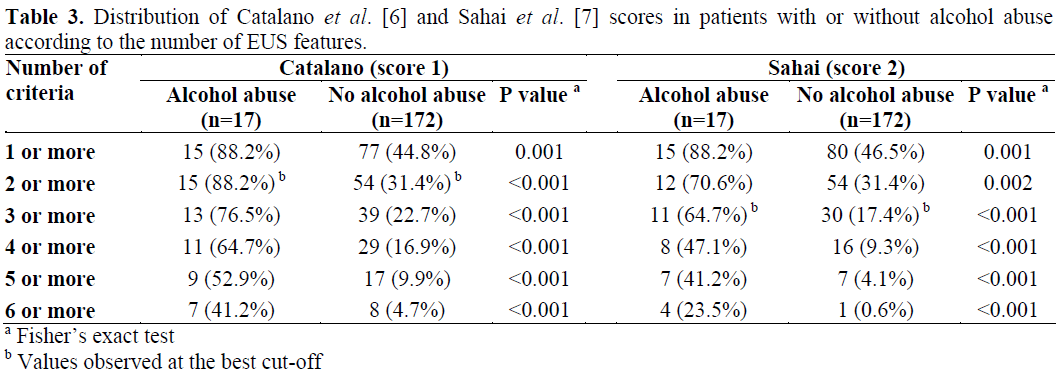
Sahai et al. [7] found that the diagnosis of chronic pancreatitis can be made with an 85% certainty when more than 2 criteria are present, and moderate to severe forms when more than 6 features are seen. Seventy (12/17) percent of alcoholic patients and 31.4% (54/172) of non-alcoholic patients had 2 or more criteria using the Sahai score system (P=0.002), and 23.5% (4/17) vs 0.6% (1/172) had 6 or more features, respectively (P<0.001). Table 3 shows the results of our study. The receiver operating characteristics (ROC) curve comparing alcoholic and nonalcoholic patients showed AUC values of 0.826±0.057 and 0.798±0.061 for scores 1 and 2, respectively. The best specificity and sensibility for score 1 (Catalano) were obtained for values equal to or greater than 2 (LR=3.63) and, for score 2 (Sahai) for values equal to or greater than 3 (LR=2.79). For score 1, sensitivity was 88.2% and specificity 68.6% while, for score 2, the values were 64.7% and 82.6%, respectively.
DISCUSSION
Alcohol is the most common cause of CP, accounting for 60-80% of cases. Alcoholinduced pancreatitis is most frequent in men, and has an incidence peak between 35 and 45 years of age [1, 2]. The onset of symptoms is usually preceded by at least 5 years of alcohol consumption of 80 g/day or more [1, 2, 3, 4]. Mortality rates approach 50% within 20-25 years [1], and pancreatic cancer develops in approximately 4% of patients 20 years after diagnosis [16].
Diagnosing advanced disease is the real problem; the intriguing challenge is to find an inexpensive and minimally invasive method capable of making an early-stage diagnosis.
Abdominal US and CT have several limitations due to poor resolution imaging, especially in the initial stages of CP. US is limited by the retroperitoneal location of the pancreas and gas interposition, with a reported sensitivity of 60 to 70% and a specificity of 80 to 90% [1, 5, 17, 18]. CT offers better visualization than US, although it has limited value in identifying initial parenchymal and, especially, ductal changes. It still has the radiation exposure problem and presents an overall sensitivity of 74 to 90% and a specificity of 85% [1, 5]. ERCP is the gold standard imaging procedure for CP, although parenchymal abnormalities and initial stage disease might be missed [1, 6, 13]. It has a reported sensitivity of 74 to 95% and specificity of 90 to 100% [13, 19]. The risk of post-procedure pancreatitis ranges from 5 to 10% [9, 10]. Functional tests are usually abnormal only when more than 60 to 70% of the gland is compromised, frequently missing initial stages of CP [1, 2, 8, 20]. EUS provides better resolution images than US, CT and ERCP. Hence, both parenchymal and ductal morphology can be assessed without fluoroscopy or contrast injection. It is therefore possible to assume that EUS might be able to detect abnormalities not previously seen by other methods. Its complication rate is similar to diagnostic upper gastrointestinal endoscopy [7, 21].
Overall inter-observer agreement for individual EUS features for CP was 92% in one study [13]. Sahai et al. found that the only independent predictive feature of CP was calcification [7]. The sum of the criteria has been demonstrated to be more important in predicting disease than any isolated feature, suggesting that the overall aspect of the gland is the most important [7, 22, 23].
EUS criteria for pancreatic disease are useful but have some limitations. Abnormalities may be similar in acute and chronic disease and slight changes of CP may be seen in the elderly population secondary to fibrotic changes related to age [8, 13]. Pancreatic abnormalities depicted by EUS can possibly be asymptomatic; on the other hand, patients highly suspected of having CP might present only mild EUS pancreatitis. Alcohol has been associated with asymptomatic pancreatic abnormalities [24, 25, 26]. Yusoff and Sahai prospectively studied the effect of ethanol and other variables on the endosonographic appearance of the pancreas and found that the number of criteria correlated most strongly with ethanol ingestion and smoking history [27]. Wiersema et al. [13] prospectively evaluated 69 patients and 20 controls to assess pancreatic EUS features, demonstrating that sensitivity and specificity were optimal when 3 or more criteria were found. For all forms of CP, sensitivity was 80% and specificity was 86%. When considering initial pancreatic disease, sensitivity was 86%.
In the study by Sahai et al. [7] 126 patients underwent EUS followed by ERCP. The prevalence of CP in the population studied was 76% with 47% having moderate to severe disease. The authors found that this diagnosis can be made with an 85% certainty when more than 2 criteria are present and moderate to severe forms when more than 6 features are seen. Moderate to severe CP is unlikely (negative predictive value greater than 85%) when less than 3 criteria are found. Independent features predictive of CP were the sum of the criteria and alcohol abuse. Catalano et al. [6] evaluated 80 patients with non-alcoholic, acute, recurrent pancreatitis by EUS, ERPC and pancreatic juice examination. The agreement between EUS and, both the secretin test and ERCP was excellent for normal and severe pancreatitis, but poor for mild to moderate disease. When at least 3 EUS features were used to diagnose CP, the sensitivity was 86% and specificity 98%. This prospective study compared EUS appearance in patients with and without alcohol abuse excluding those with suspicious or confirmed diagnosis of CP.
When comparing alcoholic and non-alcoholic groups, we found that the mean number of criteria was significantly higher in the alcoholic group (Table 2). This suggests that although asymptomatic, alcoholic patients might have pancreatic abnormalities which may be missed by other procedures, and EUS might be useful in screening patients with suspected initial stage CP. Still related to such findings, we can also argue that EUS is able to show early structural damage to the pancreas.
The threshold of features needed to diagnose CP can vary according to whether or not we wish to maximize sensitivity and specificity. The presence of severe EUS abnormalities favors the carrying out of more invasive corroborative tests and the determination of therapeutic options whenever appropriate. The significance of mild EUS pancreatic changes remains controversial. Once EUS detects structural changes not detected by other diagnostic methods, follow-up is necessary in order to rule out whether or not these patients who have been diagnosed with mild CP by EUS will develop signs of pancreatic disease
In summary, patients with alcohol consumption of over 80 g/day had significantly more EUS abnormalities as compared to non-alcoholic controls. EUS was able to determine minor damage to the pancreas, probably caused by alcohol abuse. Patients presenting more than 1 and 2 EUS features of the Catalano and Sahai score systems, respectively, are at great risk of having CP.
References
- Steer ML, Waxman I, Freedman S. Chronic pancreatitis. N Engl J Med 1995; 332:1482-90. [PMID 7739686]
- Etemad B, Whitcomb DC. Chronic pancreatitis: diagnosis, classification, and new genetic developments. Gastroenterology 2001; 120:682-707. [PMID 11179244]
- Talamini G, Bassi C, Falconi M, Sartori N, Salvia R, Rigo L, et al. Alcohol and smoking as risk factors in chronic pancreatitis and pancreatic cancer. Dig Dis Sci 1999; 44:1303-11. [PMID 10489910]
- Lin Y, Tamakoshi A, Hayakawa T, Ogawa M, Ohno Y. Associations of alcohol drinking and nutrient intake with chronic pancreatitis: findings from a casecontrol study in Japan. Am J Gastroenterol 2001; 96:2622-7. [PMID 11569685]
- Feldman M, Friedman LS, Sleisenger MH. Sleisenger and Fordtran's Gastrointestinal and Liver Disease; Pathophysiology, Diagnosis, Management. 7th ed. WB Saunders, 2002:465-78. [ISBN 721689736]
- Catalano MF, Lahoti S, Geenen JE, Hogan WJ. Prospective evaluation of endoscopic ultrasonography, endoscopic retrograde pancreatography, and secretin test in the diagnosis of chronic pancreatitis. GastrointestEndosc 1998; 48:11-7. [PMID 9684658]
- Sahai AV, Zimmerman M, Aabakken L, Tarnasky PR, Cunningham JT, van Velse A, et al. Prospective assessment of the ability of endoscopic ultrasound to diagnose, exclude, or establish the severity of chronic pancreatitis found by endoscopic retrograde cholangiopancreatography. GastrointestEndosc 1998; 48:18-25. [PMID 9684659]
- Sahai AV. EUS and chronic pancreatitis. GastrointestEndosc 2002; 56(4 Suppl):S76-81. [PMID 12297754]
- Vandervoort J, Soetikno RM, Tham TC, Wong RC, Ferrari AP Jr, Montes H, et al. Risk factors for complications after performance of ERCP. GastrointestEndosc 2002; 56:652-6. [PMID 12397271]
- Freeman ML, DiSario JA, Nelson DB, Fennerty MB, Lee JG, Bjorkman DJ, et al. Risk factors for post- ERCP pancreatitis: a prospective, multicenter study. GastrointestEndosc 2001; 54:425-34. [PMID 11577302]
- Wiersema MJ, Wiersema LM. Endosonography of the pancreas: normal variation versus changes of early chronic pancreatitis. GastrointestEndoscClin N Am 1995; 5:487-96. [PMID 7582575]
- Byrne MF, Jowell PS. Gastrointestinal imaging: endoscopic ultrasound. Gastroenterology 2002; 122:1631-48. [PMID 12016428]
- Wiersema MJ, Hawes RH, Lehman GA, Kochman ML, Sherman S, Kopecky KK. Prospective evaluation of endoscopic ultrasonography and endoscopic retrograde cholangiopancreatography in patients with chronic abdominal pain of suspected pancreatic origin. Endoscopy 1993; 25:555-64. [PMID 8119204]
- Lees WR. Endoscopic ultrasonography of chronic pancreatitis and pancreatic pseudocysts. Scand J GastroenterolSuppl 1986; 123:123-9. [PMID 3535028]
- Pezzilli R, Morselli-Labate AM, Miniero R, Barakat B, Fiocchi M, Cappelletti O. Simultaneous serum assays of lipase and interleukin-6 for early diagnosis of acute pancreatitis. ClinChem 1999; 45:1762-7. [PMID 10508122]
- Lowenfels AB, Maisonneuve P, Cavallini G, Ammann RW, Lankisch PG, Andersen JR, et al. Pancreatitis and the risk of pancreatic cancer.International Pancreatitis Study Group. N Engl J Med1993; 328:1433-7. [PMID 8479461]
- Niederau C, Grendell JH. Diagnosis of chronic pancreatitis. Gastroenterology 1985; 88:1973-95. [PMID 3888772]
- Bastid C, Sahel J, Filho M, Sarles H. Diameter of the main pancreatic duct in chronic calcifying pancreatitis. Measurement by ultrasonography versus pancreatography. Pancreas 1990; 5:524-7. [PMID 2235964]
- Buscail L, Escourrou J, Moreau J, Delvaux M, Louvel D, Lapeyre F, et al. Endoscopic ultrasonography in chronic pancreatitis: a comparative prospective study with conventional ultrasonography, computed tomography, and ERCP. Pancreas 1995; 10:251-7. [PMID 7624302]
- Hawes RH. Comparison of diagnostic modalities: EUS, ERCP, and fluid analysis. GastrointestEndosc 1999; 49:S74-6. [PMID 10049454]
- Lightdale CJ. Indications, contraindications, and complications of endoscopic ultrasonography. GastrointestEndosc 1996; 43:S15-9. [PMID 8929801]
- Nattermann C, Goldschmidt AJ, Dancygier H. Endosonography in chronic pancreatitis: a comparison between endoscopic retrograde pancreatography and endoscopic ultrasonography. Endoscopy 1993; 25:565- 70. [PMID 8119205]
- Wallace MB, Hawes RH, Durkalski V, Chak A, Mallery S, Catalano MF, et al. The reliability of EUS for the diagnosis of chronic pancreatitis: interobserver agreement among experienced endosonographers. GastrointestEndosc 2001; 53:294-9. [PMID 11231386]
- Sahai AV, Mishra G, Penman ID, Williams D, Wallace MB, Hadzijahic N, et al. EUS to detect evidence of pancreatic disease in patients with persistent or nonspecific dyspepsia. GastrointestEndosc 2000; 52:153-9. [PMID 10922084]
- Bhutani MS. Endoscopic ultrasonography: changes of chronic pancreatitis in asymptomatic and symptomatic alcoholic patients. J Ultrasound Med 1999; 18:455-62. [PMID 10400047]
- Kahl S, Glasbrenner B, Leodolter A, Pross M, Schulz HU, Malfertheiner P. EUS in the diagnosis of early chronic pancreatitis: a prospective follow-up study. GastrointestEndosc 2002; 55:507-11. [PMID 11923762]
- Yusoff IF, Sahai AV. A prospective, quantitative assessment of the effect of ethanol and other variables on the endosonographic appearance of the pancreas. ClinGastroenterolHepatol 2004; 2:405-9. [PMID 15118979]