Keywords
Molten fluorides; Stable iron valence; Cyclic voltammetry; Chronopotentiometry; Square wave voltammetry
Introduction
Molten fluorides are suitable for use as coolants of molten salt reactors because these materials present excellent heat transfer properties [1-3]. However, the residual oxidation of impurities in fluorides, such as absorbed water and HF(g) [4,5], are corrosive to the structural materials at high temperature [6-9], resulting in the dissolution of Fe in those materials [10], such as Hastelloy.
According to the investigations described by Oak Ridge National Laboratory (ORNL) [11], the corrosion valence state of Fe in molten fluorides is determined by the acid-base properties of the molten fluoride employed; here, a Lewis acid is defined as a fluoride ion acceptor, and a Lewis base is a fluoride ion donor. Pure FLINAK consisting of LiF, NaF, and KF [LiF:NaF:KF, 46.5:11.5:42 (mol%)] is known to be a strongly basic solvent that tends to stabilize the Fe(III) valence state [11]. According to the theory of non-electric transfer described by Ozeryanaya [12], Fe may firstly dissolve in FLINAK melts as a form of Fe(II), which would further convert to Fe(III). Unfortunately, no relevant studies have yet been published to prove this conversion.
By using cyclic voltammetry (CV), Bing [13] found that Fe(III) could be converted to Fe(II) in KCl–CaCl2–NaCl–MgCl2 melts. With the same method, Manning [14] indicated that O2- and O22- ions stayed stable in LiF–BeF2–ZrF4 and LiF–BeF2–ThF4 melts whereas O2- was unstable in these eutectics. Recently, Nourry [15] found that U(III) could be oxidized to U(IV) in LiF–CaF2–UF3 melts through CV and SWV. Cassayre and Pakhui [16,17] claimed that Th(IV) is the only stable species in LiCl–KCl melts at 420–550 °C by involving CV, CP, SWV and chronoamperometry (CA). Reports thus far [13-19] suggest that the electrochemical method can be used to investigate the stable valence of electro-active species because the technique offers quick responses and in-situ monitoring. The aim of the present work is to determine the stable valence state of Fe in FLINAK melts through CV, CP and SWV.
Experimental Methods
Highly-purified LiF–NaF–KF [46.5:11.5:42 (mol%)] [FLINAK] eutectic salt was used as the experimental fluorides. A known amount of Fe(III) and Fe(II) were introduced to FLINAK salt as the form of FeF3 (Strem Chemicals, 99.9%) and FeF2 (Alfa Aesar, 99%), respectively. Then the fluorides system was melted at 600°C in a vitreous carbon crucible placed in a stainless steel cell inside an electric furnace. The temperature of the melts was measured by a nickle-chromium thermocouple positioned just outside the crucible.
A platinum wire (ä=1.0 mm) served as the working electrode, whose surface area was determined by measuring the immersion depth in the melts. A graphite rod (ä=6.0 mm) was used as the auxiliary electrode with a large surface area (2.50 cm2). All potentials were referred to a platinum wire (ä=1.0 mm) that had been proven to function as a quasi-reference electrode Pt/PtOx/ O2-, with a stable potential when the O2- concentration is constant [20,21]. The entire apparatus was placed inside a glove box with dry argon atmosphere (99.99 wt%), as shown in Figure 1, and the typical concentrations of moisture and oxygen in glove box were generally below 2 ppm. All electrochemical measurements were performed with a computer-controlled AUTOLAB digital electrochemical analyzer (Metrohm AutoLab Co. Ltd.).
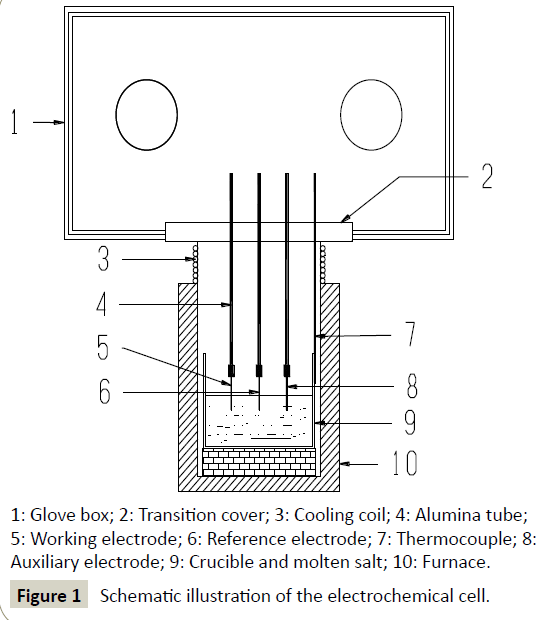
1: Glove box; 2: Transition cover; 3: Cooling coil; 4: Alumina tube; 5: Working electrode; 6: Reference electrode; 7: Thermocouple; 8: Auxiliary electrode; 9: Crucible and molten salt; 10: Furnace.
Figure 1: Schematic illustration of the electrochemical cell.
Results and Discussion
Electrochemical behavior of Fe(III) in FLINAK melts
Cyclic voltammetry: The typical cyclic voltammograms of FLINAKFe( III) (484 ppm) melts on a Pt electrode at 600°C and different scan rates are shown in Figure 2. Two reduction peaks, A and B, at 1.97 V (vs. alkalis) and 1.42 V (vs. alkalis), respectively, in the cathodic run and two anodic counter-peaks, A’ and B’, at 2.15 V (vs. alkalis) and 1.52 V (vs. alkalis), respectively, can be observed. As the Fe(III) concentration increases, the current densities of peak A and B (ipA and ipB) increase accordingly, as shown in Figure 3. Thus, the reduction of Fe(III) proceeds in two steps.
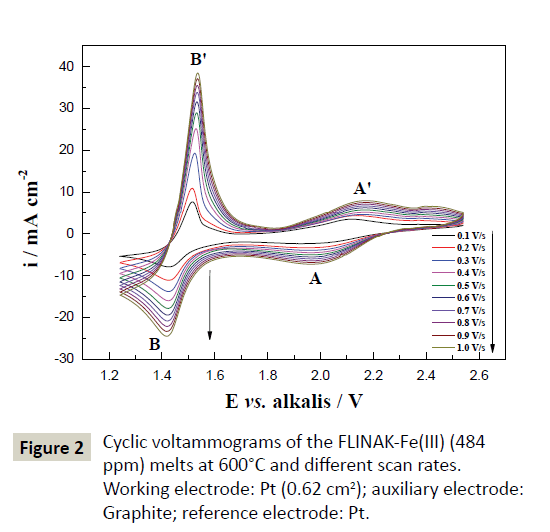
Figure 2:Cyclic voltammograms of the FLINAK-Fe(III) (484 ppm) melts at 600°C and different scan rates. Working electrode: Pt (0.62 cm2); auxiliary electrode: Graphite; reference electrode: Pt.
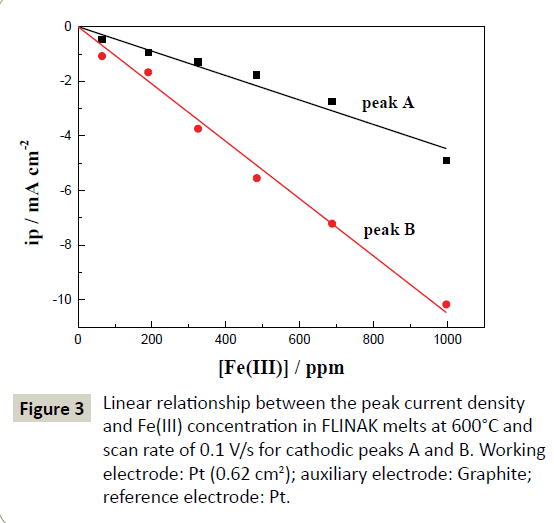
Figure 3: Linear relationship between the peak current density and Fe(III) concentration in FLINAK melts at 600°C and scan rate of 0.1 V/s for cathodic peaks A and B. Working electrode: Pt (0.62 cm2); auxiliary electrode: Graphite; reference electrode: Pt.
A/A’ redox system: The cathodic current density of peak A (ipA) obtained after subtracting the background current [22,23] linearly increases with the square root of the scan rate (v1/2) as shown in Figure 4a, indicating that the first reduction step of Fe(III) is controlled by ion diffusion. In addition to the almost invariable peak potential (EpA) in the range of 0.1 to 1.0 V/s, the ratio of |ipA’/ipA| is approximately equal to 1, as shown in Table 1. These results suggest that the first step of Fe(III) reduction is considered reversible over the studied scan rates.
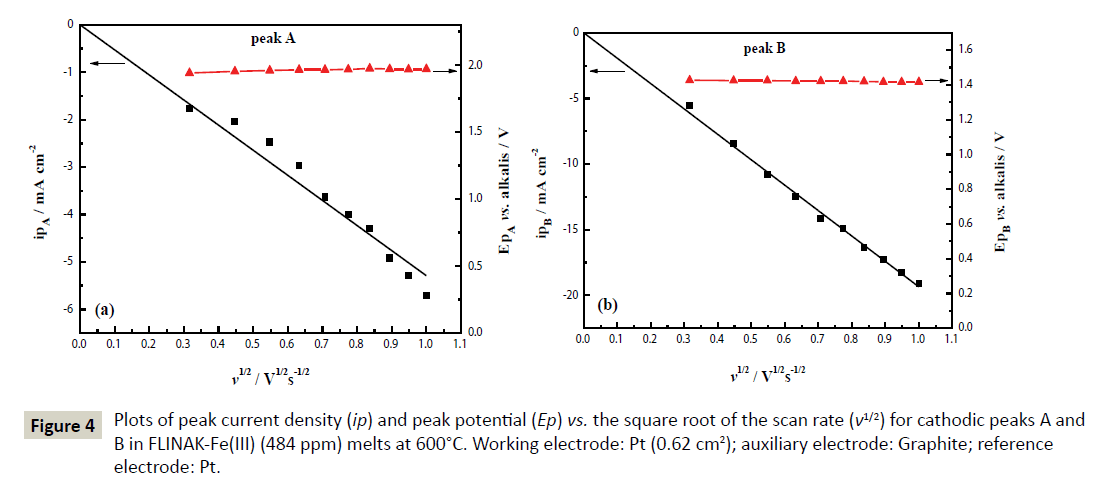
Figure 4: Plots of peak current density (ip) and peak potential (Ep) vs. the square root of the scan rate (v1/2) for cathodic peaks A and B in FLINAK-Fe(III) (484 ppm) melts at 600°C. Working electrode: Pt (0.62 cm2); auxiliary electrode: Graphite; reference electrode: Pt.
| v/V s-1 |
0.1 |
0.2 |
0.3 |
0.4 |
0.5 |
0.6 |
0.7 |
0.8 |
0.9 |
1.0 |
| |ipA’/ipA| |
1.28 |
1.06 |
1.17 |
1.10 |
0.93 |
0.99 |
1.06 |
1.02 |
1.04 |
0.99 |
Table 1: Ratios of the anodic to the cathodic peak current density |ipA’/ipA|.
For a reversible system, the diffusion coefficient of Fe(III) in the melts can be calculated according to the Randles-Sevcik equation [24]:
 (1)
(1)
Where ip is the peak current (A), n the number of exchanged electrons, F the Faraday constant (96,485 C mol-1), S the electrode surface area (cm2), C the Fe(III) concentration (mol cm-3), R the universal gas constant (8.314 J mol-1 K-1), T the absolute temperature of the melts (K), D the diffusion coefficient (cm2 s-1) and v the potential scan rate (V s-1).
The slope of ip versus v1/2 attributed to peak A obtained in Figure 4a is:
 (2)
(2)
at T=600°C and C=1.73 × 10⁻⁵ mol cm-3.
B/B’ redox system: The sharp oxidation peak B’ and the ratios of |ipB’/ipB|>1 imply the couple B/B’ may be attributed to the deposition and dissolution of Fe [25,26]. Since the peak potential EpB remains at about 1.42 V (vs. alkalis) and the cathodic peak current density ipB linearly increases with v1/2 as shown in Figure 4b, the reduction peak B is a quasi-reversible reaction controlled by ion diffusion.
Chronopotentiometry
A typical chronopotentiogram of FLINAK-Fe(III) (997 ppm) melts obtained for an applied current of -3.5 mA on a Pt electrode at 600°C is shown in Figure 5. Two plateaus, A and B, at about 1.9 V (vs. alkalis) and 1.5 V (vs. alkalis), respectively, can be observed, which confirms the two-step reduction mechanism of Fe(III) previously evidenced by CV.
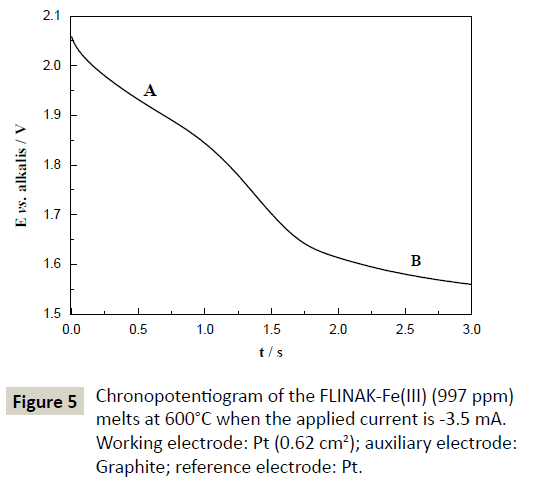
Figure 5: Chronopotentiogram of the FLINAK-Fe(III) (997 ppm) melts at 600°C when the applied current is -3.5 mA. Working electrode: Pt (0.62 cm2); auxiliary electrode: Graphite; reference electrode: Pt.
The validity of the Sand’s law [Eq. (3)] is verified in Figure 6, since the iτ1/2 plotted versus the applied current (i) is constant [Eq. (4), (5)]. The two reduction processes of Fe(III) are thus controlled by ion diffusion in molten FLINAK. The diffusion coefficient of Fe(III) can be determined using the Sand’s law [24]:
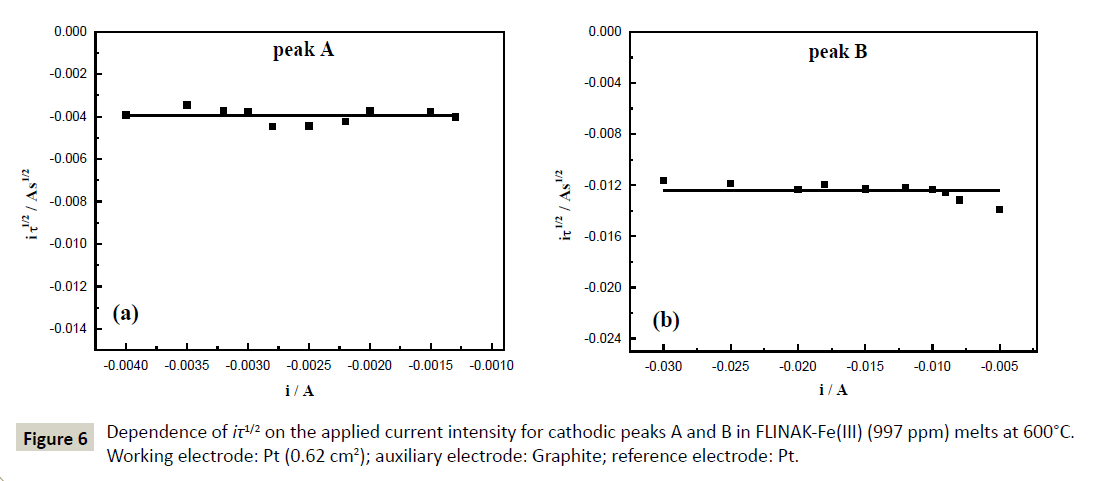
Figure 6: Dependence of iτ1/2 on the applied current intensity for cathodic peaks A and B in FLINAK-Fe(III) (997 ppm) melts at 600°C. Working electrode: Pt (0.62 cm2); auxiliary electrode: Graphite; reference electrode: Pt.
 (3)
(3)
Where i is the applied current (A), τ the transition time (s), C the Fe(III) concentration (here, C=3.56 × 10⁻⁵ mol cm-3), n the number of exchanged electrons, F the Faraday constant (96,485 C mol-1), S the electrode surface area (cm2) and D the diffusion coefficient (cm2 s-1).
 (4)
(4)
 (5)
(5)
Number of exchanged electrons
The Fe(III) reduction mechanism was finally evidenced by calculating the number of exchanged electrons. Combining CV and CP measurements, the exchanged electron number of peak A was obtained to be 0.87 by coupling Eq. (1)-(4). Thus, Fe(III) reduction proceeded in two steps: initial Fe(III) reduction to Fe(II) followed by subsequent reduction of Fe(II) to Fe. For the reversible Fe(III)/ Fe(II) couple, Fe(III) diffusion coefficient is determined to be 3.80 × 10⁻⁶ cm2 s-1 from CV measurement [Eq. (1)] and to be 4.38 × 10⁻⁶ cm2 s-1 from CP measurement [Eq. (3)].
Square wave voltammetry
The typical square wave voltammograms of FLINAK-Fe(III) (190 ppm) melts at 30-70 Hz on a Pt electrode are shown in Figure 7. Two reduction peaks, A and B, at about 2.03 V (vs. alkalis) and 1.43 V (vs. alkalis), respectively, can be observed. The mathematical analysis of the peak yields a simple equation associating the width of the half peak (W1/2) and the electron transfer number [27,28].
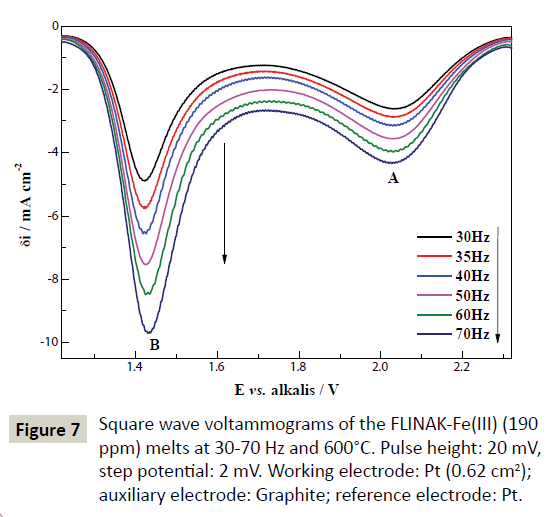
Figure 7: Square wave voltammograms of the FLINAK-Fe(III) (190 ppm) melts at 30-70 Hz and 600°C. Pulse height: 20 mV, step potential: 2 mV. Working electrode: Pt (0.62 cm2); auxiliary electrode: Graphite; reference electrode: Pt.
 (6)
(6)
Eq. (6) is theoretical valid for a reversible system, which can be extended to other systems as far as the criterion of linearity between the peak intensity and the square root of the frequency signal is respected [29-33]. As shown in Figure 8, the reduction peak current densities (δipA and δipB) show a linear relationship with the square root of the frequency. Calculated according to Eq. (6), the electron transfer number for peaks A and B are 1.04 and 1.77, respectively, as shown in Table 2. Thus, peaks A and B are corresponding to the reductions of Fe(III)/Fe(II) and Fe(II)/Fe, respectively. These results are in accordance with those obtained through CV and CP.
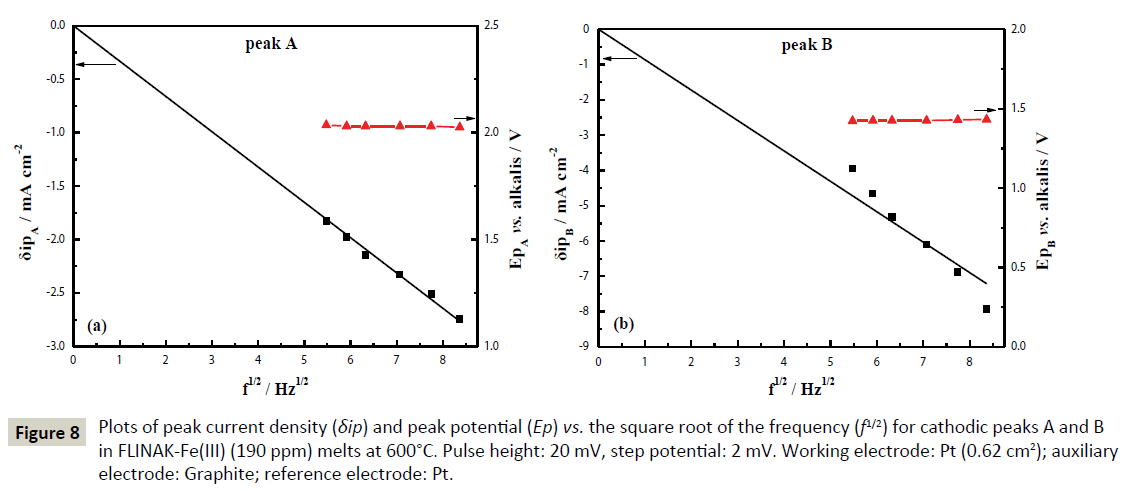
Figure 8: Plots of peak current density (δip) and peak potential (Ep) vs. the square root of the frequency (f1/2) for cathodic peaks A and B in FLINAK-Fe(III) (190 ppm) melts at 600°C. Pulse height: 20 mV, step potential: 2 mV. Working electrode: Pt (0.62 cm2); auxiliary electrode: Graphite; reference electrode: Pt.
| Reduction peak |
A |
B |
| Reduction potentialvs.alkalis |
2.03V |
1.43V |
| Value of W1/2 |
253mV |
150mV |
| Exchanged electron numbers |
1.04 |
1.77 |
| Corresponding reaction |
Fe(III)+e=Fe(II) |
Fe(II)+2e=Fe |
Table 2: Reduction reactions and electron transfer numbers of peak A and B.
Electrochemical behavior of Fe(II) in FLINAK melts
After 740 ppm of Fe(II) was introduced into FLINAK melts in the form of FeF2, the square wave voltammograms obtained on a Pt electrode at 600°C and different holding times are shown in Figure 9. Two reduction peaks, A and B, at about 2.1 V and 1.5 V (vs. alkalis), attributed to the reductions of Fe(III)/Fe(II) and Fe(II)/Fe, respectively, can be observed. Peak A assigned to the reduction of Fe(III)/Fe(II) also appeared even though only FeF2 was added to FLINAK, indicating the conversion of Fe(II) to Fe(III).
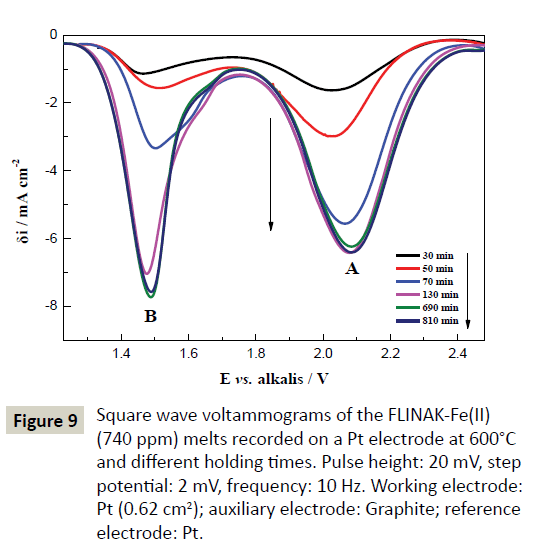
Figure 9: Square wave voltammograms of the FLINAK-Fe(II) (740 ppm) melts recorded on a Pt electrode at 600°C and different holding times. Pulse height: 20 mV, step potential: 2 mV, frequency: 10 Hz. Working electrode: Pt (0.62 cm2); auxiliary electrode: Graphite; reference electrode: Pt.
Plot of current density of peak A (δipA) vs. different holding times at 600°C in FLINAK-Fe(II) (740 ppm) melts is shown in Figure 10. δipA increases from –1.22 mA cm-2 to –5.64 mA cm-2 and then reaches a plateau after 130 min. The increase of δipA before 130 min is attributed to the conversion of Fe(II) to Fe(III). After the conversion equilibrium is achieved at 130 min, the Fe(III) concentration in molten FLINAK remains constant, resulting in an unchangeable δipA value.
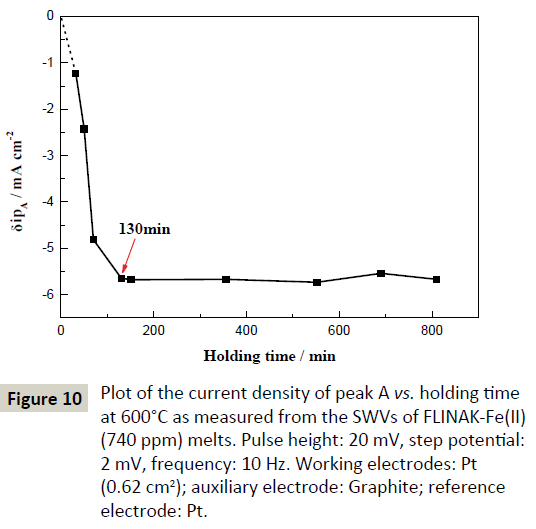
Figure 10: Plot of the current density of peak A vs. holding time at 600°C as measured from the SWVs of FLINAK-Fe(II) (740 ppm) melts. Pulse height: 20 mV, step potential: 2 mV, frequency: 10 Hz. Working electrodes: Pt (0.62 cm2); auxiliary electrode: Graphite; reference electrode: Pt.
Conclusion
In this work, the electrochemical behavior of Fe(III) in molten FLINAK was studied by CV, CP and SWV. The results showed that Fe(III) was initially reduced to Fe(II), which was subsequently reduced to Fe. Both Fe(III)/Fe(II) and Fe(II)/Fe reductions were controlled by ion diffusion. The diffusion coefficient of Fe(III) was 3.80 × 10⁻⁶ cm2 s-1 obtained by Randles-Sevcik equation and was 4.38 × 10⁻⁶ cm2 s-1 obtained by Sand’s law. The electrochemical behavior of Fe(II) was then investigated by SWV. Two cathodic peaks attributed to the reductions of Fe(III)/Fe(II) and Fe(II)/Fe, can be observed. This result indicated that Fe(II) was converted to Fe(III), which is more stable in FLINAK melts.
Acknowledgements
This work was financially supported by the Strategic Priority Research Program of the Chinese Academy of Sciences (Grant No. XDA02020400) and the Young Scientists Fund of the National Natural Science Foundation of China (Grant No. 51404237).
References
- Salanne M, SimonC, Turq P, Madden PA (2009) Heat-transport properties of molten fluorides: Determination from first-principles. J Fluorine Chem 130: 38-44.
- Van der Meer JPM, Konings RJM (2007) Thermal and physical properties of molten fluorides for nuclear applications. J Nucl Mater 360: 16-24.
- Krepel J, HombourgerB, Fiorina C, MikityukK, RohdeU, et al.(2014)Fuel cycle advantages and dynamics features of liquid fueled MSR. Ann Nucl Energy 64: 380-397.
- Field PE, Shaffer JH (1967)Thesolubilities of hydrogen fluoride and deuterium fluoride in molten fluorides. J PhysChem 71: 3218-3222.
- Shaffer JH, Grimes WR, Watson GM (1959)Solubility of hydrogen fluoride in molten fluorides. J PhysChem 63: 1999-2002.
- Delpech S, Cabet C, Slim C, Picard GS(2010) Molten fluorides for nuclear applications. Materials Today 13: 34-41.
- Nagasaka T, Kondo M, Muroga T, Noda N, Sagara A, et al. (2009)Fluoridation and oxidation characteristics of JLF-1 and NIFS-HEAT-2 low-activation structural materials. J Nucl Mater386: 716-719.
- Kondo M, Nagasaka T, Sagara A,Noda N, Muroga T, et al.(2009)Metallurgical study on corrosion of austenitic steels in molten salt LiF–BeF2 (Flibe). J Nucl Mater 386: 685-688.
- Kondo M, Nagasaka T, Xu Q, Muroga T, Sagara A, et al. (2009) Corrosion characteristics of reduced activationferritic steel, JLF-1 (8.92Cr–2W) in molten salts Flibe and Flinak. Fusion Eng Des 84: 1081-1085.
- Olson LC, Ambrosek JW, Sridharan K, Anderson MH, Allen TR(2009) Materials corrosion in molten LiF–NaF–KF salt. J Fluorine Chem130: 67-73.
- Williams D, TothL, Clarno K (2006) Assessment of Candidate Molten Salt Coolants for the Advanced High-Temperature Reactor (AHTR). ORNL/TM–2006/12, Oak Ridge National Laboratory.
- Ozeryanaya IN (1985) Corrosion of metals by molten salts in heat-treatment processes. Met Sci Heat Treat 27: 184-188.
- Li B, Lou J, Wang H, Yu J (2011) Electrochemical investigation on stable iron ion valence in molten KCl–CaCl2–NaCl–MgCl2 melts. J Rare Earth 29: 96-98.
- Manning DL, Mamatov G(1977) Electrochemical studies of oxide ions and related species in molten fluorides. J ElectrochemSoc 124: 480-483.
- Nourry C, Soucek P, Massot L, Malmbeck R, Chamelot P, et al. (2012) Electrochemistry of uranium in molten LiF–CaF2. J Nucl Mater 430: 58-63.
- Cassayre L, SerpJ, Soucek P, Malmbeck R, Rebizant J, et al. (2007)Electrochemistry of thorium in LiCl–KCl eutectic melts. ElectrochimActa52: 7432-7437.
- Pakhui G, Chandra M, Ghosh S, Reddy BP, Nagarajan K (2015) Electrochemical studies on the reduction behavior of Th4+ in molten LiCl–KCl eutectic. ElectrochimActa 155: 372-382.
- Smirnov MV, Kudyakov VYA (1983) Thorium valency in molten alkali halides in equilibrium with metallic thorium. ElectrochimActa 28: 1339-1348.
- Dock CH (1965) Oxidation states of thorium in fused LiCl–KCl eutectic. Retrospective Theses and Dissertations. Paper 3910.
- BerghouteY, Salmi A, Lantelme F (1994)Internal reference systems for fused electrolytes. J ElectroanalChem 365: 171-177.
- Graves AD, Inman D (1965) Adsorption and the differential capacitance of the electrical double-layer at platinum/halide metal interfaces. Nature 20: 481-482.
- Wang J (2000) Analytical electrochemistry. Wiley-VCH, New York, USA.
- Yoko T, Bailey RA (1984)Electrochemical studies of chromium in molten LiF–NaF–KF (FLINAK). JElectrochemSoc131: 2590-2595.
- Bard AJ, Faulkner RL (1980) Electrochemistry: Principles, Methods and Applications. Wiley, New York, USA.
- Straka M, Korenko M, Lisy F (2010)Electrochemistry of uranium in LiF–BeF2 melt. J RadioanalNuclChem284: 245-252.
- Gibilaro M, Massot L, Chamelot P, Cassayre L, TaxilP(2013)Investigation of Zr(IV) in LiF–CaF2: Stability with oxide ions and electroreduction pathway on inert and reactive electrodes.ElectrochimActa95: 185-191.
- Ramaley L, Krause MS(1969) Theory of square wave voltammetry. Anal Chem 41: 1362-1365.
- Ramaley L, Krause MS (1969)Analytical application of square wave voltammetry. Anal Chem41: 1365-1369.
- Chamelot P, Massot L, Cassayre L, Taxil P(2010)Electrochemical behaviour of thorium(IV) in molten LiF–CaF2 medium on inert and reactive electrodes. ElectrochimActa 55: 4758-4764.
- Hamel C, Chamelot P, Taxil P (2004)Neodymium(III) cathodic processes in molten fluorides. ElectrochimActa 49: 4467-4476.
- Chamelot P, Palau P, Massot L, Savall A, Taxil P (2002) Electrodeposition processes of tantalum(V) species in molten fluorides containing oxide ions. ElectrochimActa 47: 3423.
- Chamelot P, Lafage B, Taxil P (1997) Using square-wave voltammetry to monitor molten alkaline fluoride baths for electrodeposition of niobium. ElectrochimActa 43: 607-616.
- Massot L, Cassayre L, Chamelot P, Taxil P (2007) On the use of electrochemical techniques to monitor free oxide content in molten fluoride media. J ElectroanalChem 606: 17-23.