Samantha Gibson1, Zahilis Mazzochette1, J Chege2, Helen K Kahi2, Geoffrey N Kamau2 and Amos Mugweru1*
1Department of Biochemistry and Chemistry, Rowan University, 201 Mullica Hill Rd, Glassboro New Jersey, 08028 USA
2Department of Chemistry, School of Physical Sciences, College of Biological and Physical Sciences, University of Nairobi, PO Box 30197-00100, Nairobi, Kenya
*Corresponding Author:
Amos Mugweru
Department of Biochemistry and Chemistry, Rowan University, 201 Mullica Hill Rd., Glassboro New Jersey, 08028 USA
E-mail: mugweru@rowan.edu
Received date: December 02, 2015; Accepted date: December 15, 2015; Published date: December 23, 2015
Citation: Gibson S, Mazzochette S, Chege J , et al. Electrochemical and Chromatographic Attributes of Albendazole Drug: Charge Transfer and Retention Profiles. Insights Anal Electrochem. 2015, 2:1 doi:10.21767/2470-9867.100010
Keywords
Albendazole; Electron transfer; Electrochemical oxidation; LC-MS
Introduction
Albendazole (ABZ) is a widely used anthelmintic drug for the treatment of parasitic worms and diseases caused by such infestations. Albendazole is poorly absorbed in in-vivo and hence high concentrations of this drug are administered. The poor absorption is due to its low solubility in aqueous media [1-3]. Therefore, most of the drug that is administered eventually finds its way into the environment. After oral administration, albendazole (ABZ) is transformed by liver microsomal enzymes into albendazole sulphoxide (ASOX), a pharmacologically major active metabolite [4-7]. Subsequently, this metabolite is further transformed by cytochrome P450 enzyme (CYP2C) to an inactive metabolite, albendazole sulphone (ASON). The rate of albendazole metabolism depends on the species of animal, with more than 50% of the drug transformed to metabolite after 4 days [8]. Albendazole has also been used for the control of flukes in a variety of animal species, ncluding domestic (e.g., cattle, sheep and goats) and wild animals (such as elephants). Albendazole destroys the parasitic worm by keeping the worm from absorbing sugar (glucose), such that the parasite loses energy and finally dies [9-11].
ABZ is of current major interest among scientists, trying to understand the nature and its properties using different analytical techniques. In fact, there has been an extensive and continuing interest in developing attractive and fast methods of studying ABZ drug as well as its metabolites and related compounds at low levels. Two of the main metabolites are given in I above. Several techniques for analysis of ABZ have been reported including solid phase extraction coupled with HPLC [12], ultrahigh performance LC coupled with a mass spectroscopy detector [13-15], high-performance liquid chromatographic (HPLC) [16] and radioimmunoassay methods. A number of electrochemical studies of ABZ have been reported in the literature [17-19]. Recent literature indicates that this drug could be used for ovarian cancer treatment due to its effective inhibition efficacy of vascular endothelia growth factor (VEGF) [20]. The aim of the current research work was to 1), use electroanalytical techniques to elucidate important electrochemical kinetic parameters in further characterization of albendazole and 2) use chromatographic techniques to characterize the electrochemical oxidation products.
Experimental Section
Chemicals
Albendazole was purchased from Sigma Aldrich. Tetrabutyl ammonium bromide (Bu4NBr- TBAB) was purchased from WWR (West Chester, PA). The albendazole drug was dissolved in in acetonitrile containing Tetrabutyl ammonium bromide (TBAB) as the phase transfer catalyst or supporting electrolyte. All analytical reagents were used as received. Ordinary distilled and pure water was used for all other applications. All other chemicals were analytical grade or HPLC grade.
Electrochemical apparatus
Cyclic voltammetry (CV) and amperometric techniques were carried out with a computer controlled electrochemical workstation (CHI 660c, USA) with ohmic drop (IR) 98% compensated. A three-electrode electrochemical cell with a platinum wire as a counter electrode was used for all electrochemical experiments. The Ag/AgCl, equipped with a glass tip, separated from the sample solution compartment by a saltbridge containing KCl and terminating in a medium porosity glass frit, was the reference electrode. Cell resistance, IR, as measured by the CH Instruments, was 98% compensated in all voltammetric experiments. All work was done at the ambient room temperature of the laboratory (23°C).
Electrode surface preparation Procedure
Glassy carbon (area 0.07 cm2) was used as the working electrode. The working and the counter electrodes were obtained from Bioanalytical Systems Inc. (West Lafayette, IN). Use of glassy electrode required brief polishing in alumna (0.1 μm particle sizes) and rinsing thoroughly in pure water and finally ultra-sonicated in the same media prior to use. Glassy carbon electrodes were initially polished on 1 μm diamond polishing paste then ultrasonicated in ethanol and distilled water successively for 1 minute, followed by rinsing in pure water and then dried in air. This step was then followed by alumna polishing and thorough rinsing, as indicated above.
Chromatographic procedure
Separations were carried out at room temperature on a ZORBAX XDB-CN column (4.6 mm × 150 mm long and 5 μm particle size, Agilent Technologies). A Zorbax CN guard column (4.6 mm cartridge, Agilent Technologies) was used to preserve the analytical column. The mobile phase consisted of a combination of acetonitrile methanol and de ionized water (59:27:14). The HPLC-UV was carried out using Agilent 1100 series HPLC unit the UV detector set at 254 nm wavelength. The chromatographic run was performed under isocratic conditions at the flow rate of 1 mL/min. Every end of the run was followed by a post run step that included flushing the column again with more mobile phase.
Mass spectrometry procedure
The HPLC attached to the mass spectrometer was an Alliance HPLC System run using parameters established using HPLC-UV. The mass spectrometer used was a Micromass Quattro micro unit. Mass Spectrometer was set to ESI in positive ion mode. The settings of the mass spectrometer were as follows: the desolvation gas (N2) and flow was operated at 500°C and 5 L/min, respectively. The corona was operated at 2 μA while the cone voltage was set at 25 V. The extractor lens was at 5 V while the RF lens was at 0.2 V. The mass spectrometry collision gas was a N2 of high purity (>99.9995).
Results and Discussion
Electrochemical oxidation of ABZ
A cyclic voltermmogram of albendazole on a glassy carbon electrode surface was obtained at a potential window of 0 V to 2.0 V versus Ag/AgCl electrode. Two irreversible peak waves were observed (Figure 1). The first peak was at around 1.2 V versus Ag/AgCl reference electrode and the second peak was occurred at around 1.6 V. The first peak wave was later confirmed using LC-MS to be due to the formation of albenzadole sulfoxide while the second peak wave the conversion of albenzadole sulolfoxide to albenzadole sulfone. The first peak wave was similar to that observed for artemesini [21], organohalides and related pesticide formulations [22]. The measured peak current of the first peak wave was found to increase with the scan rate while the second peak also increased accordingly but disappeared at scan rated higher than 100 mV/S (Figure 1). The disappearance of the second peak wave suggests that the formation of albenzadole sulfone was not being generated at higher scan rates and hence disappearance of the peak. Oxidation of ABZ on glassy carbon electrode commences at around 0.7 V versus Ag/AgCl reference electrode. A broad peak for the oxidation is observed. A plot of this peak current versus the square root of scan rate gave a linear relationship, suggesting diffusion controlled mass transport of ABZ towards the surface of the glassy carbon electrode (Figure 2a).
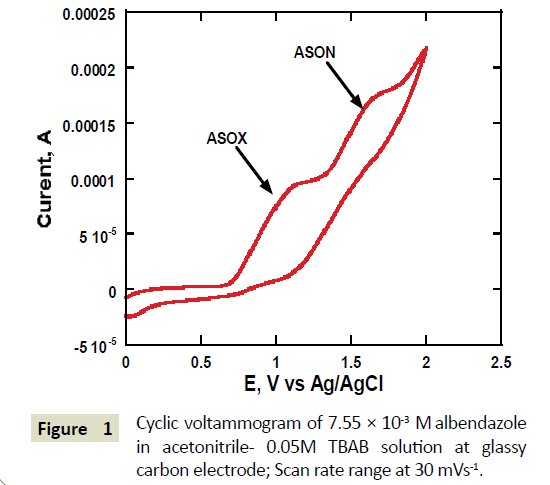
Figure 1 Cyclic voltammogram of 7.55 × 10⁻³ M albendazole in acetonitrile- 0.05M TBAB solution at glassy carbon electrode; Scan rate range at 30 mVs-1.
Formation of ASOX from ABZ is an irreversible reaction. In addition, the peak potential was found to shift to more positive potentials with increase in scan rate. Equation 1 can be used to estimate αn, by plotting Ep versus log v [23].
k0 is the standard heterogeneous rate constant of the oxidation of ABZ, n the number of electron transferred, v the scan rate, and E0 is the formal potential. Thus value of αn can be easily calculated from the slope of E vs. log v (Figure 2b). In this system, the slope is 0.08998 Volts/log, taking T=298, R=8.314, and F=96480, the αn was calculated to be 0.652. Oxidation of ABZ to ASOX is a totally irreversible process.
According to the CV theory for irreversible systems, Ep as a function of scan rate, shifting by an amount of 1.15RT/αF (or 30/α mV at 25°C) for each ten-fold increase in v. Thus, assuming α to be 0.5, the number of electrons (n) transferred in the electrooxidation of ABZ to ASOX was calculated as 1.3. However, α, n can also be estimated from using equations 3 and 5. Assuming the diffusion coefficients of the ABZ and ASOX species are equal, it is possible to estimate the coefficient of electron transfer using experimental data contained in Figures 2 and 3.
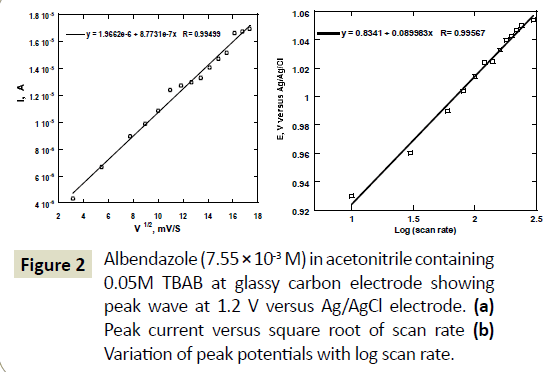
Figure 2 Albendazole (7.55 × 10⁻³ M) in acetonitrile containing 0.05M TBAB at glassy carbon electrode showing peak wave at 1.2 V versus Ag/AgCl electrode. (a) Peak current versus square root of scan rate (b) Variation of peak potentials with log scan rate.
 (3)
(3)
In equation 3, i is the current at any measured potential and il is the limiting or peak current (ip), α is the coefficient of electron transfer. A plot of left hand side of equation 3 versus  gives a straight line, which provides the slope and the intercept, pertaining to charge transfer characteristics (Figure 3a). According to Figure 3a, a value of E1/2=0.91 volts versus Ag/AgCl was obtained. A plot of Ln (ip) against (E-E(1/2)) gave a straight line whose Y- intercept and the slope provided the heterogeneous rate constant and electron transfer coefficient, respectively (Figure 3b). The value of Kh calculated was about 1.39 × 10⁴ S-1 cm2. A closely related molecule, oxfendazole OFZ, undergoing a similar irreversible oxidation process, exhibited linear relationship for the plot of Ep vs. log of scan rate [24]. Rotating disc electrode in acidified solution gave heterogeneous rate constant of ten magnitude lower than our system [25].
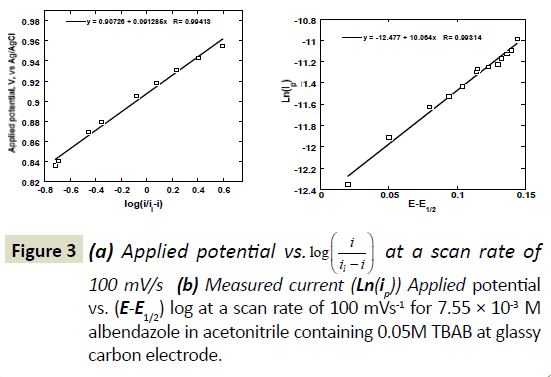
Figure 3 a) Applied potential vs. at a scan rate of 100 mV/s (b) Measured current (Ln(ip)) Applied potential vs. (E-E1/2) log at a scan rate of 100 mVs-1 for 7.55 × 10⁻³ M albendazole in acetonitrile containing 0.05M TBAB at glassy carbon electrode.
The average current density at 100 mV/sec was about 214 μA/ cm2, again supporting diffusion controlled conditions of ABZ.
 (3)
(3)
 (4)
(4)
Formation of ASON was only observed at scan rate lower than 100 mV/s and at potentials higher than 1.5 V versus Ag/AgCl electrode. Again, the relationship between the peak current and the voltage scan rate was examined using a solution of concentration 0.00755 molL-1 and recording cyclic voltammograms at different scan rates. Figure 4a shows a plot of the peak currents of the second peak wave versus the scan rate. The relationship of the square root scan rate with peak current was linear with a slope of 0.998. As observed earlier, the formation of ASOX from ABZ was diffusion controlled mass transport towards the surface of the glassy carbon electrode. This phenomenon is observed again with formation of ASON from ASOX (Figure 4b). Figure 5a shows plot of E vs. Scan rate of the peak occurring at 1.6 V versus Ag/AgCl. The peak current shifted to more positive potentials with increase in scan rate. A plot of E versus log ν was linear with a correlation coefficient of 0.990. The shift of peak potential with sweep rate, confirmed the irreversible diffusion controlled system.
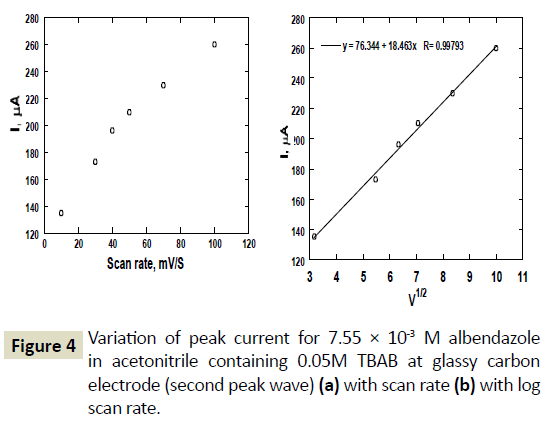
Figure 4 Variation of peak current for 7.55 × 10⁻³ M albendazole in acetonitrile containing 0.05M TBAB at glassy carbon electrode (second peak wave) (a) with scan rate (b) with log scan rate.
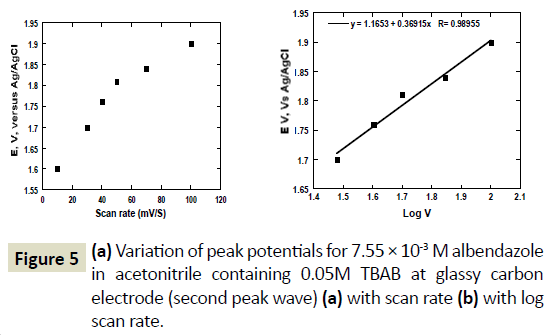
Figure 5 (a) Variation of peak potentials for 7.55 × 10⁻³ M albendazole in acetonitrile containing 0.05M TBAB at glassy carbon electrode (second peak wave) (a) with scan rate (b) with log scan rate.
Chromatographic analysis of electro-oxidation products
The products of electro-oxidation were obtained in a stirred solution and filtered and analysed using chromatographic techniques. Electrolysis of albendazole solution 0.0075M/L using glassy carbon electrode was followed using chromatography. Electrolysis conditions involved keeping the electrode at 1.5 V versus Ag/AgCl for six hours. The solution was stirred during the time of electrolysis to bring fresh solution to the electrode surface. 1 ml samples of electrolyte were drawn using a syringe each hour during the electrolysis and filtered using a 0.45 nm filter and injected onto a chromatographic instrument. The chromatograms obtained are shown in Figure 6. The initial chromatogram before start of the electrolysis shows the highest peak at 1.9 minutes. This is the chromatogram of unaltered ABZ.
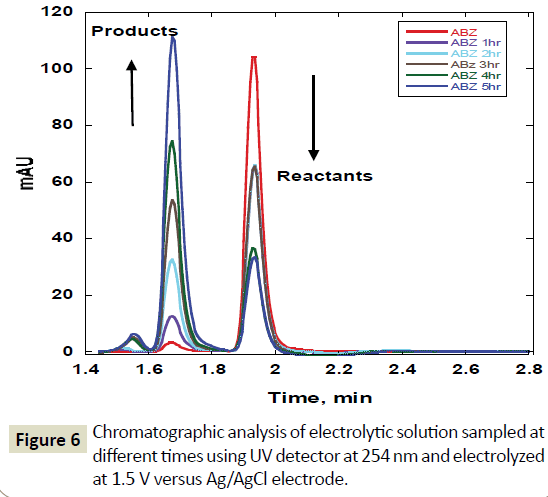
Figure 6 Chromatographic analysis of electrolytic solution sampled at different times using UV detector at 254 nm and electrolyzed at 1.5 V versus Ag/AgCl electrode
However, after one hour of electrolysis, another major new chromatographic peak appeared at 1.7 minutes and another minor peak at about 1.5 minutes. The major peak new peak grew with time of the electrolysis (Figures 6-8). The minor peak also grew but was saturated after 3 hours of electrolysis. Meanwhile, the peak for initial ABZ reduced in size with the time of electrolysis indicating consumption to form the product. The rate of ABZ peak decrease (1.9 min) was correlated to the rate of peak increase of the product peak (1.7 min). Increasing the voltage of electrolysis from 1.5 V to 1.7 V resulted in yet another new smaller chromatographic peak at 2.5 minutes (Figure 7) but disappearance of the minor peak at 1.5 minutes. In a bid to establish the identity of the new electro-oxidation products, the electrolyte samples were injected into another LC-Ms Instrument using same column and mobile phase flow rates. Figure 9 shows a mass spectrum of the initial ABZ peak obtained at 1.9 minutes. The initial drug, (A) has well known fragments with M/Z of the molecular ion at 266, other fragments with M/Z 234, 191, corresponding to structures B and C below. These fragments have been observed before for this molecule [26]. Figure 10 shows the mass spectra for the chromatographic peak at 1.7 minutes. This is one of the new major products of ABZ electro-oxidation. The growth of this peak was steady with time of electrolysis. The fragment with M/Z 282 (D) is most likely the molecular ion of ASOX. The fragments of this molecule were found to be 239 and 207. The presence of 282 is a confirmation of ASOX. The fragments obtained are given as D, E and F below. Figure 11 shows the mass spectra of the new chromatographic peak at 2.5 minutes. The small peak at 2.5 minutes points to the formation of albenzadole sulphone (G) on the electrode surface. The presence of a 297 (molecular) ion peak leaves no doubt that the albenzadole sulphone is the product. Other fragments obtained include, masses of 159, and 206.
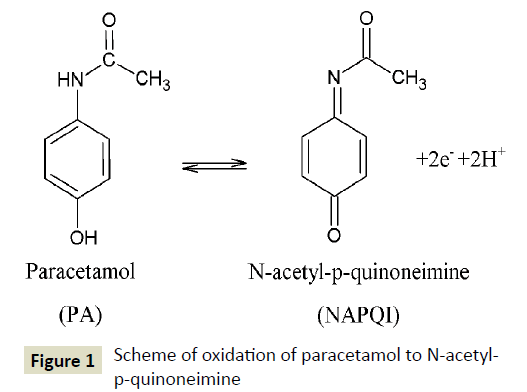
Figure 7: Chromatographic analysis of electrolytic solution sampled at different times using UV detector at 254 nm and electrolyzed at 1.7 V versus Ag/AgCl electrode.
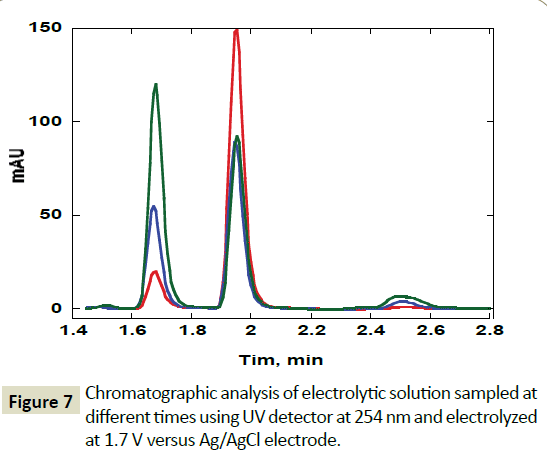
Figure 8: Reactants and products profile measured as a function of time using chromatography.
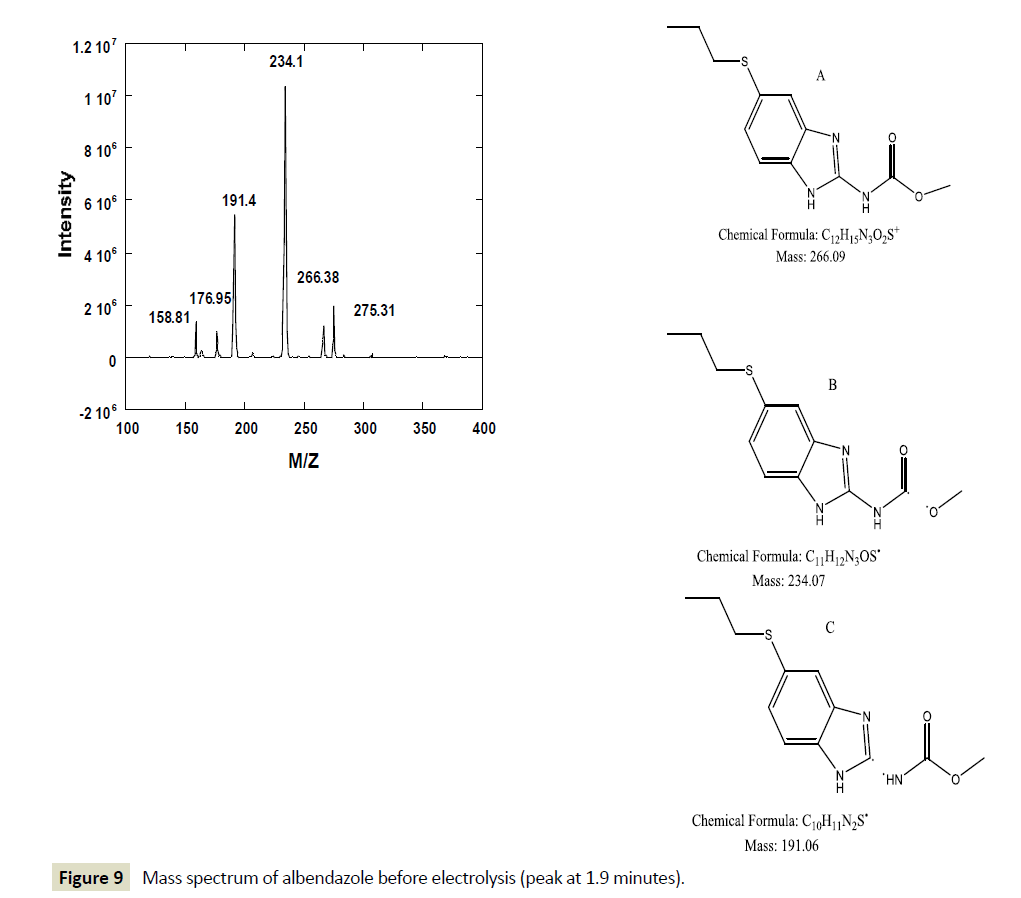
Figure 9: Mass spectrum of albendazole before electrolysis (peak at 1.9 minutes).
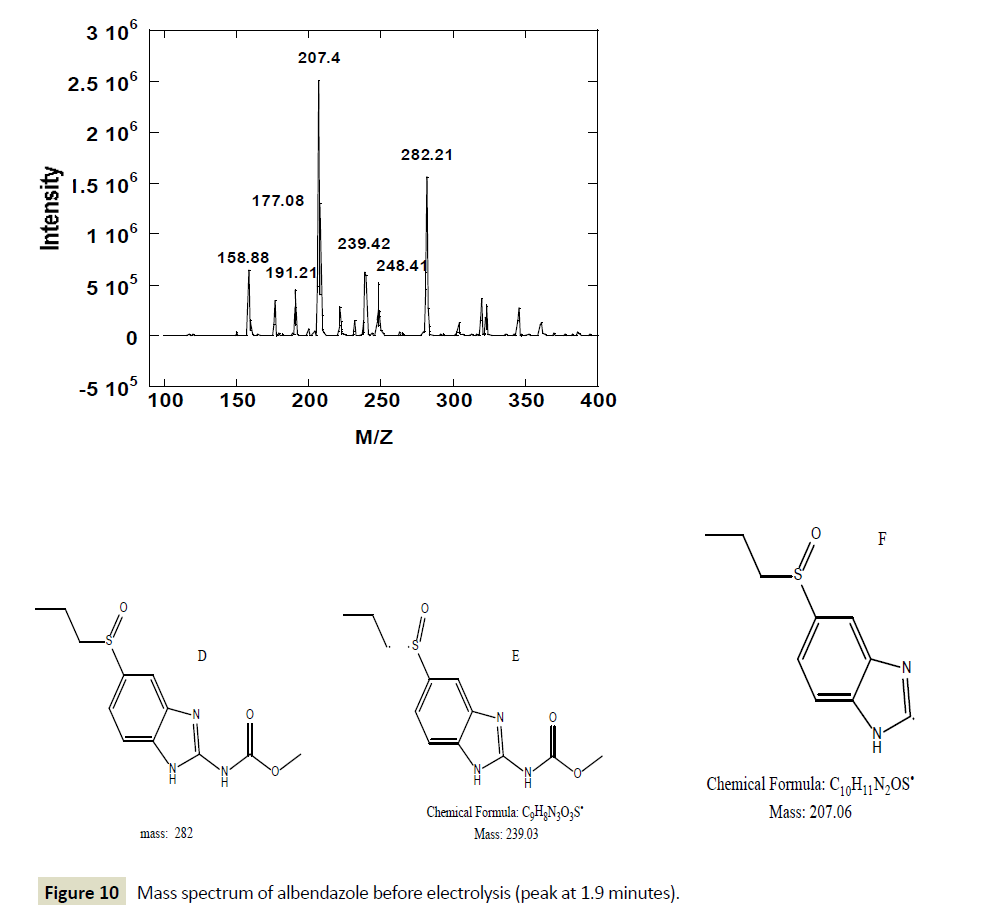
Figure 10: Mass spectrum of albendazole before electrolysis (peak at 1.9 minutes).
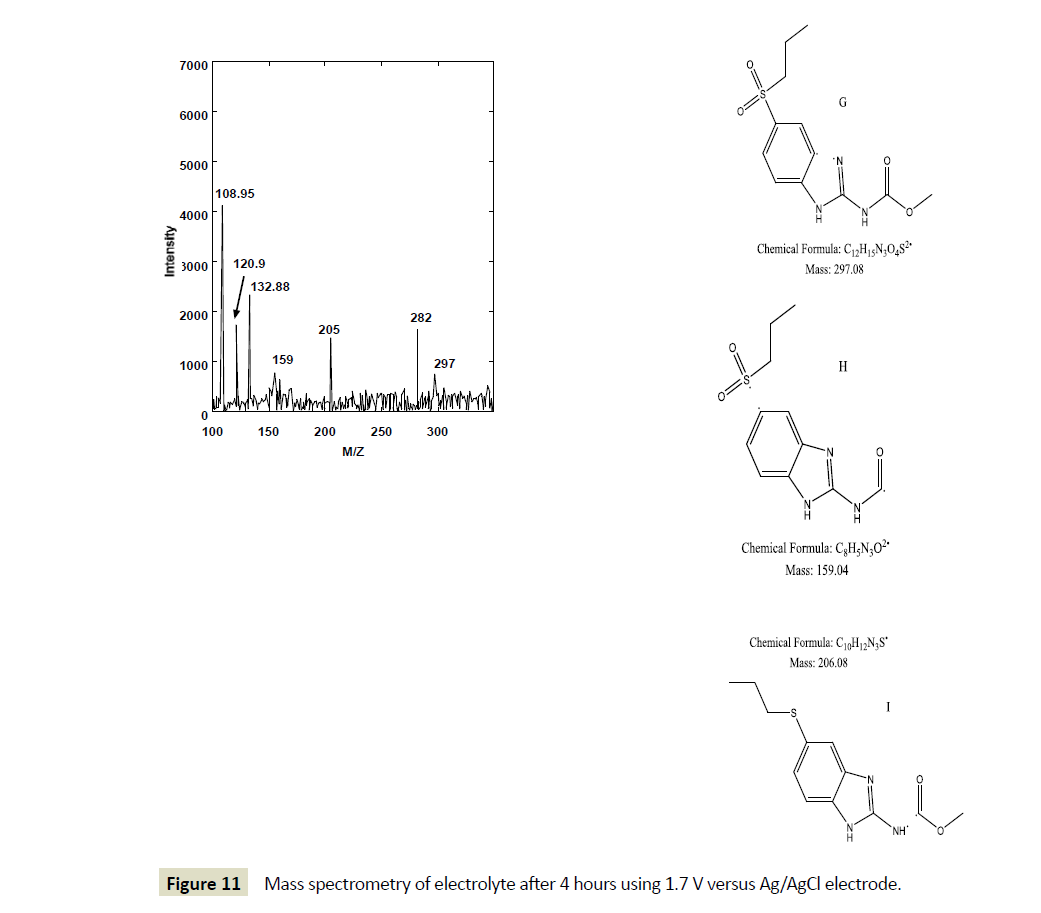
Figure 11: Mass spectrometry of electrolyte after 4 hours using 1.7 V versus Ag/AgCl electrode.
The minor peak initially obtained at 1.5 minutes was however not identified but we speculate that this could be an ASOXASON intermediate product. Our results suggest that the electrochemical oxidation of albendazole on electrode surface of glassy carbon electrode occurs in two steps. Formation of ASOX is the first step where an electron is transferred. This corresponds to the first peak wave. The second step (b) in Scheme 1, results in formation of ASON (Scheme 1). This is the first time the peak waves are being associated with specific oxidation product.
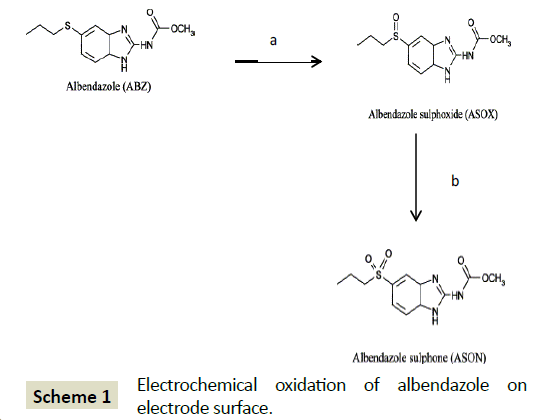
Scheme 1: Electrochemical oxidation of albendazole on electrode surface.
The effectiveness of ABZ drug is related to the presence of the active metabolite albendazole sulfoxide (ASOX). In vivo, ABZ is usually converted by enzymes to the more active chiral metabolite ASOX [27]. ASOX is also known to undergo yet another round of metabolism to form the inactive albendazole sulfone (ASON) [28]. These oxidations we were followed on glassy carbon electrode.
It is interesting to note, the electro-oxidation products at the electrode surface match the enzyme metabolites. Although we have observed slow kinetics at the electrode surface (0.0143 S-1 cm2), the amount of product obtained is a stirred solution was significant. LC-MS showed other fragments such as m/z 120.09, 108.95 that we could not be accounted for. This points to possible other intermediates during electro-oxidation.
Conclusions
Electrochemical and chromatographic methods were used for the first time 1) to determine the electrochemical kinetic parameters for activation of ABZ to ASOX and 2) to determine the products of the electrochemical oxidation. ABZ oxidation on glassy carbon electrode yielded albendazole sulfoxide as well as albendazole sulphone at 1.2 V and 1.6 vs Ag/AgCl respectively. Both ASOX and ASON are known enzyme metabolic products of ABZ in vivo. Electrochemical oxidation of ABZ on glassy carbon electrode was a totally irreversible process. Further work is underway to correlate the rate of ABZ metabolism with the rate of oxidation on electrode surface.
Acknowledgements
The authors would like to thank Minxue Shi of Rowan University for helping with instrumental methods of analysis. We also acknowledge Rowan University, Department of Chemistry for the research support.
References
- Virkel G, Imperiale F, Lifschitz A, Pis A, Alvarez A, et al. (2003)Effect of amphiphilic surfactant agents on the gastrointestinal absorption of albendazole in cattle. Biopharm Drug Dispos 24: 95-103.
- Jung H, Medina L, García L, Fuentes I, Moreno-Esparza R, et al. (1998)Biopharmaceutics: Absorption Studies of Albendazole and Some Physicochemical Properties of the Drug and Its Metabolite AlbendazoleSulphoxide. J Pharm Pharmacol50: 43-48.
- Anjana (2015)Solubility and bioavailability enhancement of albendazole by complexing with hydroxy propyl acyclodextrin. Journal of chemical and pharmaceutical research 7: 1131-1141.
- Mirfazaelian A, Rouini MR, Dadashzadeh S (2003)Time dependent pharmacokinetics of albendazole in human. Biopharm Drug Dispos 24: 199-204.
- Abdel-tawab AM, Bradley M, Ghazaly EA, Horton J, El-Setouhy M, et al. (2009)Albendazole and its metabolites in the breast milk of lactating women following a single oral dose of albendazole. Br J Clin Pharmacol 68: 737-742.
- Wu Z, Lee D, Joo J, Shin JH, Kang W, et al. (2013)CYP2J2 and CYP2C19 Are the Major Enzymes Responsible for Metabolism of Albendazole and Fenbendazole in Human Liver Microsomes and Recombinant P450 Assay Systems. Antimicrob Agents Chemother 57: 5448-5456.
- Virkel G, Lifschitz A, Sallovitz J, Pis A, Lanusse C, et al. (2004)Comparative Hepatic And ExtrahepaticEnantioselectiveSulfoxidation Of Albendazole And Fenbendazole In Sheep And Cattle. Drug MetabDispos 32: 536-544.
- Danaher M, De Ruyck H, Crooks SRH, Dowling G, O’Keeffe M (2007)Review of methodology for the determination of benzimidazole residues in biological matrices. J Chromatogr B 845: 1-37.
- Fraga CM, Costa TL, Bezerra JCB, de Souza Lino Junior R, Vinaud MC, et al. (2012)Fatty acids oxidation and alternative energy sources detected in Taeniacrassicepscysticerci after host treatment with antihelminthic drugs. Exp Parasitol 131: 111-115.
- Li QZ, Hao YH, Gao XJ, Gao WX, Zhao B, etal. (2007)The Target of BenzimidazoleCarbamate against Cysticercicellulosae. Agricultural Sciences in China 6: 1009-1017.
- Vinaud MC, Ferreira CS, de Souza Lino JR, Bezerra JCB (2008)Taeniacrassiceps: Energetic and respiratory metabolism from cysticerci exposed to praziquantel and albendazole in vitro. Exp Parasitol 120: 221-226.
- Wu M, Hu J (2013)Residue Analysis of Albendazole in Watermelon and Soil by Solid Phase Extraction and HPLC. Anal Lett 47: 356-366.
- Zhang X, Xu H, Zhang H, Guo Y, Dai Z, et al. (2011)Simultaneous determination of albendazole and its metabolites in fish muscle tissue by stable isotope dilution ultra-performance liquid chromatography tandem mass spectrometry. Analytical & Bioanalytical Chemistry 401: 727-734.
- Periša M, Babic S (2014)Simultaneous determination of pharmaceuticals and some of their metabolites in wastewaters by high performance liquid chromatography with tandem mass spectrometry. J Sep Sci 37: 1289-1296.
- Wojnicz A, Cabaleiro-Ocampo T, Román-Martínez M, Ochoa-Mazarro D, Abad-Santos F, et al. (2013)A simple assay for the simultaneous determination of human plasma albendazole and albendazolesulfoxide levels by high performance liquid chromatography in tandem mass spectrometry with solid-phase extraction. Clin Chim Acta 426: 58-63.
- Chen X, Zhao L, Xu H, Zhong D (2004)Simultaneous determination of albendazole and its major active metabolite in human plasma using a sensitive and specific liquid chromatographic-tandem mass spectrometric method. J Pharm Biomed Anal 35: 829-836.
- de Prada AGV, Mena ML, Reviejo AJ, Pingarrón JM (2004)Voltammetric Behavior and Determination by Flow Injection with Amperometric Detection of Benzimidazoles. Anal Lett 37: 65-79.
- de Oliveira MF,Stradiotto NR (2001)Voltammetric Assay of Albendazole in Pharmaceutical Dosage Forms. Analytical Letters 34: 377-387.
- Bonato PS, Lanchote VL, Takayanagui OM (2003)Simultaneous liquid chromatography-tandem mass spectrometric determination of albendazolesulfoxide and albendazole sulfone in plasma. J Chromatogr B AnalytTechnol Biomed Life Sci 783: 237-245.
- P Xu L, Noorani L, Stenzel (2015)Albumin nanoparticles increase the anticancer efficacy of albendazole in ovarian cancer xenograft model. Journal of nanobiotechnology 6: 190.
- Andrew S, Helen K, Kamau GN, Mugweru Al (2015)Electrochemical and Spectroscopic Characteristics of ArtemisininAntimalaria Drug: Charge Transfer Redox Process. International journal of Chemical Kinetics.
- Kamau G, Bernard M (2004)Selective control and rate enhancement of reactions involving catalytic reduction of organohalides and reduced form of myoglobin in microemulsions. Pure Appl Chem 76: 815-828.
- Laviron E, Roullier L (1998)Electrochemical reactions with adsorption of the reactants and electrosorption. Simple analytical solutions for a Henry isotherm. J Electroanal Chem 443: 195-207.
- Radi AE, El-Naggar AE, Nassef HM (2014)Molecularly imprinted polymer based electrochemical sensor for the determination of the anthelmintic drug oxfendazole. J Electroanal Chem 729: 135-141.
- Santos AL, Takeuchi RM, Mariotti MP, De Oliveira MF, Zanoni MVB, et al. (2005)Study of electrochemical oxidation and determination of albendazole using a glassy carbon-rotating disk electrode. IlFarmaco 60: 671-674.
- Wu M, Hu J (2014)Residue Analysis of Albendazole in Watermelon and Soil by Solid Phase Extraction and HPLC. Anal Lett 47: 356-366.
- Khalil (2015)Comparative plasma disposition kinetics of albendazole and its new benzimidazolprodrug in dog. Ann PharmFr.
- Belaz KRA, Pereira-Filho ER, Oliveira RV (2013)Development of achiral and chiral 2D HPLC methods for analysis of albendazole metabolites in microsomal fractions using multivariate analysis for the in vitro metabolism. JChromatogr B 932: 26-33.