Keywords
Diabetes Mellitus; Hyperglycemia; Insulin; Oxidative Stress; Receptor, Angiotensin, Type 1
Abbreviations
Ang II: angiotensin II; DAPI: 4',6'-diamidino-2-phenylindole; KRBB: Krebs-Ringer bicarbonate buffer; NBT: nitroblue tetrazolium
INTRODUCTION
Diabetes mellitus is a serious health problem among diverse populations worldwide, including Asians [1], Caucasians [2] and ethnic minorities in the West [3]. Type 2 diabetes mellitus (T2DM), which is characterized by impaired peripheral insulin sensitivity and beta-cell dysfunction, constitutes over 90% of all diabetes mellitus cases and its prevalence is on the rise, especially among adolescents [4]. The hyperglycemia often exhibited by T2DM patients exerts a glucotoxicity which damages beta-cell functionality. Though reninangiotensin system (RAS) blocker pharmaceuticals can ameliorate the diabetic condition [5], the underlying mechanism producing this amelioration has not been determined. Attention has thus been focused on elucidating the role of the recently identified local pancreatic RAS, which includes an acinar RAS and an islet RAS [6]. The acinar RAS appears to be involved in maintaining normal exocrine functions while the local islet RAS may regulate normal endocrine functions [6].
Previous studies have demonstrated the existence of a local pancreatic RAS in isolated pancreatic islets, consisting of angiotensinogen, angiotensin-converting enzymes (ACEs), and angiotensin II (Ang II) type 1 (AT1R) and type 2 (AT2R) receptors [7]. The binding of AT1R to its specific peptide ligand, Ang II, produces tissue-specific effects, including cell proliferation [8], apoptosis [9], vasoconstriction [10] and superoxide production [11]. RAS components, especially AT1R, were found to be upregulated in a mouse model of obesity-induced T2DM [12]. Locally-generated Ang II can inhibit islet glucose-stimulated insulin secretion and (pro)insulin biosynthesis while a blockade of AT1R improves islet structure and functions [12]. In addition, RAS activation was recently shown to induce superoxide-producing NADPH oxidase in a rat model of acute pancreatitis [13]. This convergence of evidence suggests that upregulation of islet RAS could enhance oxidative stress and thus damage beta-cell function.
Chronic hyperglycemia is a pivotal factor in the pathogenesis of beta-cell dysfunction due to its capacity to enhance islet oxidative stress. However, the fundamental mechanisms of glucotoxicity-induced beta-cell dysfunction have yet to be determined. In this study, we tested the hypothesis that chronic hyperglycemia upregulates AT1R expression and thus impairs beta-cell secretory function via AT1R activation-induced oxidative stress in an INS-1E beta-cell line.
MATERIALS AND METHODS
INS-1E Beta-Cell Culture
Stock cultures of rat insulin-producing INS- 1E beta-cells were routinely grown in 5% CO2/95% humidified air at 37°C, maintained in RPMI 1640 medium (Sigma Aldrich, St. Louis, MO, USA), supplemented with 10% (vol/vol) fetal bovine serum (Sigma Aldrich, St. Louis, MO, USA), 10 mM HEPES buffer, 1 mM sodium pyruvate, 100 IU/mL penicillin/streptomycin (Gibco Life Technologies, Carlsbad, CA, USA) and 50 μM beta-mercaptoethanol (Sigma Aldrich, St. Louis, MO, USA), passaged once weekly following detachment using trypsin-EDTA (Gibco Life Technologies, Carlsbad, CA, USA), and fed every 72 h by changing to A new medium containing 11.1 mM glucose. INS-1E cells between passages 45-65 were used. In all experiments, the cells were first incubated for 24 h in medium containing 5.6 mM glucose, the physiological blood glucose concentration. To mimic a chronic hyperglycemic condition, the cells wERE further incubated under different glucose concentrations, including 0.8 mM, 5.6 mM, 11.1 mM, 28 mM and 56 mM, for 24 h, 48 h or 72 h. Preliminary experiments revealed that a 48 h incubation period is optimal for mimicking chronic hyperglycemia (data not shown).
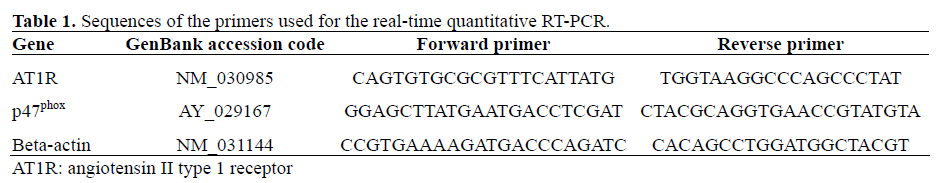
Real-Time Reverse Transcriptase Polymerase Chain Reaction (RT-PCR) Analysis
Total RNA of INS-1E beta-cells cultured under different conditions was extracted using the Trizol® reagent (Invitrogen, Carlsbad, CA, USA), according to the manufacturer’s protocols. RNA integrity was confirmed by gel electrophoresis and the amount of total RNA was determined by spectrophotometry. First strand cDNA was reverse transcribed using SuperScript II (Invitrogen, Carlsbad, CA, USA) from 2-5 μg RNA in a 20 μL reaction volume. Real-time quantitative RTPCR analyses of AT1R, p47phox and beta-actin were performed using an ABI PRISM 7700 Sequence Detection System (PE Applied Biosystems, Foster City, CA, USA) as described previously [7], with the following parameters: 40 cycles of 95°C for 15 s, 60°C for 30 s, and 72°C for 30 s. All reactions were performed in triplicate, in 20 μL, with 1 μL of cDNA, SYBR Green PCR Master mix (Qiagen, Hilden, Germany) and 0.25 μM of each primer (Invitrogen, Carlsbad, CA, USA). Amplification data were collected by the 7700 Sequence Detector and analyzed with Sequence Detection System software (Applied Biosystems, Foster City, CA, USA). Transcript levels were calculated relative to beta-actin transcript levels using the 2-ΔΔCT method, as described in the statistical data analysis section. The primer sequences employed in this study are listed in Table 1.
Western Blot Analysis
Total proteins were extracted from INS-1E beta-cell lysates using CytoBuster Protein Extraction Reagent (Novagen, Darmstadt, Germany). The protein content of lysates was quantified using a protein assay kit (Bio-Rad, Munich, Germany). Western blotting procedures were carried out as described previously [7]. Briefly, total proteins (10 μg/lane) were subjected to electrophoresis on a 9% (wt/vol) polyacrylamide for each sample in triplicate and were then transferred to A polyvinylidene fluoride transfer membrane (GE Osmonics’ Labstore, Minnetonka, MN, USA). The blotted protein was saturated with 5% (wt/vol) skimmed milk in phosphatebuffered saline (PBS; pH 7.4) (Gibco Life Technologies, Carlsbad, CA, USA) and 0.1% (vol/vol) of polysorbate 20 for 1 h at room temperature. The membrane was then sequentially incubated in rabbit anti-AT1 serum (1:1,600 dilution) (Santa Cruz Biotech, Santa Cruz, CA, USA) overnight at 4°C and a peroxidase-labeled anti-rabbit IgG antibody (1:2,600 dilution) (Santa Cruz Biotech, Santa Cruz, CA, USA) for 1 h at room temperature. A Positive signal in the membrane was revealed by enhanced chemiluminescence reaction (Amersham Pharmacia Biotech., Buckinghamshire, England). The chemiluminescence intensity of the protein bands on autoradiography film was quantified using an image analyzer (Molecular Dynamics Image Quant, Sunnyvale, CA, USA).
Immunocytochemical Localization of AT1R
INS-1E beta-cells were grown on glass coverslips in low (5.6 mM) and high (28 mM) concentrations of glucose for 48 h. The harvested cells were washed with PBS (pH 7.4) and then fixed with 4% (vol/vol) paraformaldehyde in PBS for 10 min at room temperature. The cells were then permeabilized in PBS (pH 7.4) containing 0.3% (vol/vol) octoxynol, blocked with 1% (wt/vol) bovine serum albumin (BSA) in PBS (pH 7.4) or 4% (wt/vol) normal donkey serum (Jackson ImmunoResearch, West Grove, PA, USA) for 1 h at room temperature. The excess blocking solution was removed and the cells were incubated overnight at 4°C with rabbit anti-AT1 serum (1:100) (Santa Cruz Biotech, Santa Cruz, CA, USA). After three washings with PBS (pH 7.4), the primary antibody was detected using an anti-rabbit antibody (1:100) labeled with rhodamine at room temperature for 1 h. 4',6'-diamidino-2-phenylindole (DAPI) (1:100) (Invitrogen, Carlsbad, CA, USA) was also applied at the same time. Negative controls were produced by omission of the primary antibodies. Positive immunostaining for AT1R (green) was examined with a fluorescent microscope equipped with a DC 200 digital camera (Leica Microsystems, Wetzlar, Germany). Rhodamine (red) and DAPI (blue) images were scanned separately at different laser wavelengths and captured as overlapping images.
Nitroblue Tetrazolium (NBT) Assay
An NBT assay was used to assess the level of superoxide production by the INS-1E betacells. The cells were plated at 1x10⁴ cells/well, in 96-well culture plates, under low (5.6 mM) and high (28 mM) concentrations of glucose for 48 h. They were then incubated in 0.2% (wt/vol) NBT (Boehringer Mannheim, Indianapolis, IN, USA) in Krebs-Ringer bicarbonate buffer (KRBB) supplemented with 10 mM HEPES and 2 mg/mL of BSA for 2 h in 5% CO2/95% humidified air at 37°C. The cells were then lysed by 50% (vol/vol) acetic acid and the absorbance of the wells was measured at 560 nm using a MicroKinetics plate reader (PerkinElmer, Waltham, MA, USA).
Measurement of Glucose-Stimulated Insulin Secretion
INS-1E beta-cells were plated at 3x10⁴ cells/well in 24-well culture plates under low (5.6 mM) and high (28 mM) concentrations of glucose for 48 h. Each concentration was produced in duplicate in the glucosestimulated insulin secretion determination as previously described [7]. The cells were incubated in 500 μL KRBB supplemented with 10 mM HEPES and 2 mg/mL of BSA, 5% CO2/95% humidified air at 37°C for 1 h in medium containing 2.5 mM glucose and then incubated for an additional hour in 500 μL of KRBB containing 25.5 mM glucose. The effect of Ang II (Sigma Aldrich, St. Louis, MO, USA) on glucose-stimulated insulin secretion from INS-1E beta-cells was determined at 100 nM of Ang II, the concentration of which was chosen based on our previous study [7]. Ang II was added into the KRBB medium containing 25.5 mM glucose during the second hour of incubation. The specific AT1R antagonist losartan (Merck & Co., Whitehouse Station, NJ, USA; 1 μM), was administered 10 min before the Ang II treatment. The medium was collected after incubation in order to measure glucosestimulated insulin secretion using a rat insulin ELISA kit (Mercodia, Uppsala, Sweden).
STATISTICS
Data are expressed as mean±SE for all groups. The data were evaluated by using analysis of variance (ANOVA) followed by Tukey’s post hoc test when multiple comparisons were present. In all cases, twotailed P values less than 0.05 were considered statistically significant. Graphics as well as statistical analysis were performed using a GraphPad Prism (GraphPad Software, San Diego, CA, USA). For the NBT assay, an arbitrary unit, i.e., the ratio of experimental value to initial control value was used. For real-time quantitative RT-PCR, the relative expression was normalized as a percentage of beta-actin and calculated using the comparative CT method of 2-ΔΔCT, as previously described [7].
RESULTS
Expression of AT1R mRNA in INS-1E Beta-Cells
Real-time quantitative RT-PCR coupled with the 2-ΔΔCT comparative method (Table 2) demonstrated a dose-dependent upregulation of AT1R mRNA expression in INS-1E betacells after 48 h hyperglycemic exposure. As shown in Figure 1, AT1R mRNA expression (relative to beta-actin) was increased approximately 2.4-fold in cells treated with 28 mM glucose (P=0.034 vs. 5.6 mM) and 3.5- fold in cells treated with 56 mM glucose (P<0.001 vs. 5.6 mM) (Figure 1).
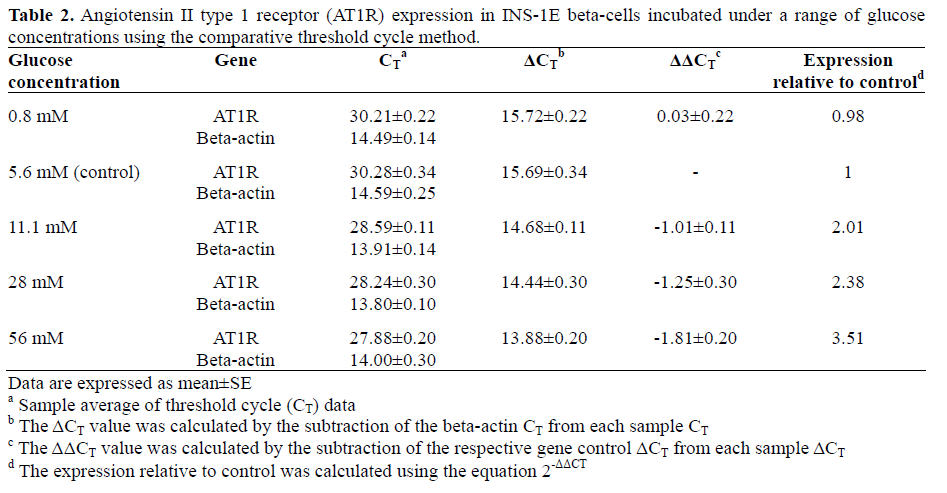
Figure 1. Real-time RT-PCR analysis of angiotensin II
type 1 receptor (AT1R) mRNA expression in INS-1E
beta-cells incubated with a range of glucose
concentrations. The relative expression was normalized
as a percentage of beta-actin mRNA using the
comparative threshold cycle 2-ΔΔCT method. All data are
expressed as mean±SE; n=4 per group; P values vs. 5.6
mM glucose: ANOVA followed by Tukey’s post hoc
test.
Expression of AT1R Protein in INS-1E Beta-Cells
Western blot analysis produced a major protein band of about 50 kDa in lysates from INS-1E beta-cells. The intensity of this band increased with increasing glucose concentration (Figure 2a), indicating a dosedependent upregulation of AT1R protein expression in the INS-1E beta-cells subjected to hyperglycemic conditions. AT1R protein expression (relative to beta-actin) was increased nearly two-fold in cells treated with 28 mM glucose (P=0.044 vs. 5.6 mM) and was increased nearly three-fold in cells treated with 56 mM glucose (P=0.001 vs. 5.6 mM; Figure 2b).
Figure 2. Western blot analysis of the angiotensin II
type 1 receptor (AT1R) protein from INS-1E beta-cell
lysates after incubation with a range of glucose
concentrations. a. Representative gel image. A major
band of about 50 kDa was detected. Control beta-actin
expression is shown. b. Expression of AT1R protein
relative to beta-actin. All data are expressed as
mean±SE; n=5 per group; P values vs. 5.6 mM glucose:
ANOVA followed by Tukey’s post hoc test.
Localization of AT1R in INS-1E Beta-Cells
Immunocytochemistry revealed localized AT1R expression on the cell and nuclear membranes of the INS-1E beta-cells. AT1Rlabeling was more intense in cells treated with 28 mM glucose (Figure 3b) than in cells treated with 5.6 mM glucose (Figure 3a). The viability of the beta-cells was confirmed by DAPI labeling, and overlapping images of DAPI- and rhodamine-stained cells confirmed the presence of AT1R expression in all INS- 1E beta-cells (Figure 3ab). The validity and specificity of the immunoreactivity of the results were confirmed by the absence of labeling in negative control experiments in which the primary antibody was omitted (Figure 3c).
Figure 3. Immunocytochemical localization of
angiotensin II type 1 receptor (AT1R) in INS-1E betacells.
Superimposed 4',6'-diamidino-2-phenylindole
(DAPI) (nuclei; blue) and rhodamine (AT1R; red)
images revealed that AT1R-labeling was detected in
cells treated with 5.6 mM glucose (a.) and with 28 mM
glucose (b.). c. Negative control image with the
omission of primary antibodies. (Magnification: 63x;
scale bar: 40 μm).
Hyperglycemia and Oxidative Stress in INS-1E Beta-Cells
Expression of the oxidative stress mediator NADPH oxidase was upregulated in INS-1E beta-cells subjected to a hyperglycemic condition (28 mM glucose), which was reflected by a 2-fold increase in the NADPH oxidase subunit p47phox (P=0.009 vs. 5.6 mM; Table 3 and Figure 4). A subsequent NBT assay demonstrated that the level of superoxide production was significantly enhanced in the hyperglycemic condition (P=0.009 vs. 5.6 mM; Figure 5).
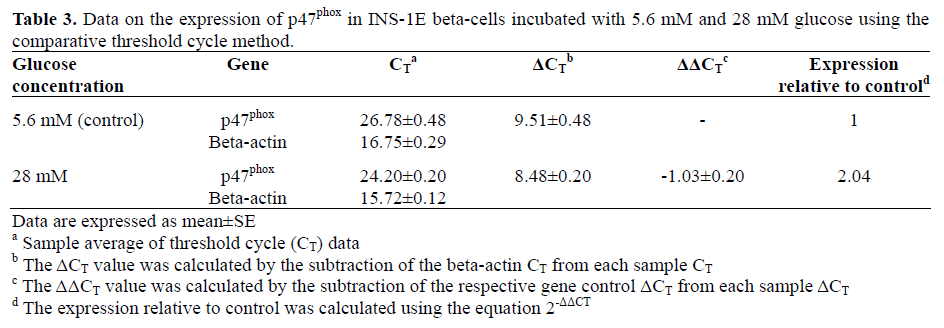
Figure 4. Real-time RT-PCR analysis of p47phox mRNA
expression in INS-1E beta-cells incubated in 5.6 mM
and 28 mM glucose. The relative expression was
normalized as a percentage of beta-actin mRNA using
the comparative threshold cycle 2-ΔΔCT method. All data
are expressed as mean±SE; n=4 per group; P value vs.
5.6 mM glucose: ANOVA.
Figure 5. Superoxide-induced nitroblue tetrazolium
(NBT) formation in INS-1E beta-cells incubated in 5.6
mM and 28 mM glucose. All data are expressed as
mean±SE; n=4 per group; P value vs. 5.6 mM glucose:
ANOVA.
Ang II and Glucose-Stimulated Insulin Secretion from INS-1E Beta-Cells
Glucose-stimulated insulin secretion was markedly enhanced when the glucose concentration in the incubation medium was changed from 2.5 mM to 25 mM glucose in cells which had been grown ubder both physiological (P=0.008; 5.6 mM glucose; Figure 6 left) and hyperglycemic (P=0.010; 28 mM glucose; Figure 6 right) conditions. Moreover, glucose-stimulated insulin secretion was reduced by Ang II (100 nM) in cells which had been grown under both physiological (P=0.009; 5.6 mM glucose; Figure 6 left) and hyperglycemic (P=0.017; 28 mM glucose; Figure 6 right) conditions. Pre-treatment of the beta-cells with losartan (1 mM), a specific AT1R antagonist, before the addition of Ang II preserved insulin release to the glucose-stimulated level (P=0.998). Losartan (1 mM) alone had no significant effect (P=1.000) on the insulin release of cells grown at the 5.6 mM glucose concentration (Figure 6 left). However, in beta-cells treated with 28 mM glucose, losartan (1 mM) administration before the addition of Ang II (100 nM) restored glucosestimulated insulin secretion to normal or higher levels (P=0.131). In fact, applying losartan (1 mM) alone to hyperglycemiatreated beta-cells induced a significant increase in insulin secretion relative to that observed in the glucose-stimulated level (P=0.045; Figure 6 right). In all cases, glucose-stimulated insulin secretion of the beta-cells after chronic hyperglycemic exposure (28 mM) was significantly suppressed (P<0.001) to about one-fifth of that of cells exposed to a physiological level of glucose (5.6 mM) (Figure 6).
Figure 6. Insulin release from INS-1E beta-cells
incubated in 5.6 mM and 28 mM glucose. Effects of
Ang II and losartan (Los) on insulin release from INS-
1E beta-cells incubated in 5.6 mM (left) and 28 mM
(right) glucose following establishment in 2.5 mM (L)
or 25.5 mM (H) glucose conditions. All data are
expressed as mean±SE; n=4 per group; P values:
ANOVA followed by Tukey’s post hoc test.
Comparisons between each of the 5 groups incubated
at 28 mM glucose vs. the corresponding one incubated
at 5.6 mM glucose: P<0.001 (ANOVA).
DISCUSSION
There has been growing interest in the role of the recently identified local pancreatic RAS in the pathophysiology of T2DM. Upregulation of the RAS components in T2DM, especially AT1R, may disrupt the structural and secretory function of the pancreatic islets. Emerging data support the notion that an AT1R blockade may improve beta-cell functions in T2DM [12]. Yet the effect of hyperglycemia alone, a characteristic condition (together with hyperlipidemia) of T2DM, on AT1R expression and secretory function in beta-cells has not yet been fully elucidated.
For a normal individual, clinical values of a normal blood glucose level should fall between 4-6 mM and the 2 h postprandial blood glucose level should not exceed 7.8 mM. It is therefore reasonable for us to apply 5.6 mM glucose as the physiological glucose level and 28 mM glucose to mimic a hyperglycemic condition in our experiments. The present findings demonstrated that hyperglycemia can produce glucotoxicity which impairs beta-cell insulin secretion. Our pharmacological findings further indicate that this impairment is mediated through AT1R activation and an associated enhancement of oxidative stress. AT1R antagonism abolished the effects of Ang II on hyperglycemia-treated beta-cells, enhancing insulin secretion to a level which surpassed the glucose-stimulated level. This increase reflects an upregulation of the RAS components in a glucotoxic environment. Meanwhile, endogenous Ang II does not seem to play a critical role in regulating insulin secretion in normal betacells.
ACE inhibitors have previously been reported to relieve oxidative stress in hyperglycemiatreated isolated human islets [14], a finding which is consistent with the view that a RAS blockade may preserve beta-cell function under hyperglycemic conditions. However, ACE inhibitors may be counter-indicated in diabetic patients due to the coincident inhibition of degradation of the potent vasodilator bradykinin which could alter pancreatic microcirculatory blood flow and ultimately produce angioedema [15]. Hence, an AT1R blockade may be a preferable intervention given that major clinical trials have suggested that it does not produce significant adverse effects [5, 16]. Moreover, one trial showed that an AT1R blockade can prevent diabetic nephropathy in T2DM patients through an amelioration of albuminuria [17].
Ang II has previously been shown to markedly impair glucose-stimulated insulin secretion of islets in a whole pancreas perfusion study [18]. Without additional evidence, however, that observation could be attributed to the potent vasoconstrictive actions of Ang II which can cause a decrease in islet blood flow. While Ramracheya et al. [19] recently found that acute Ang II stimulation of human and mouse beta-cells can produce brief elevations in intracellular calcium and insulin secretion, the present findings provide direct evidence of an inhibitory effect of Ang II on the insulin secretory functions of beta-cells. The apparent contradiction between the Ramracheya et al. findings and ours can likely be attributed to the fact that they examined only the immediate and rapid effects (within minutes) of AT1R activation while we examined the consequences of AT1R upregulation after chronic hyperglycemia.
Oxidative stress has been implicated in the pathophysiology of islet dysfunction in T2DM [20, 21]. Our study singled out chronic hyperglycemia as a contributing factor to the glucotoxicity-induced enhancement of NADPH oxidase which leads to beta-cell dysfunction. However, prior studies have also revealed an association between chronic hyperlipidemia and beta-cell dysfunction; chronic hyperlipidemia increases uncoupling protein 2 (UCP2) expression in islets, leading to a decrease in ATP synthesis and a reduced ATP/ADP ratio, which then reduces glucosestimulated insulin secretion [22, 23, 24]. Increases in free fatty acid levels may also contribute to the activated production of reactive oxygen species [25]. An AT1R blockade may have beneficial effects on hyperlipidemia as well. AT1R antagonism can ameliorate increases in plasma total cholesterol and triglycerides, as evidenced by a study reporting the increased survival of obese Zucker rats following a long-term AT1R blockade [26].
In conclusion, the present study demonstrated that chronic hyperglycemia exerts glucotoxicity in INS-1E beta-cells, thus inducing AT1R upregulation on beta-cells, and thereby impairs the insulin secretory function. The mechanism mediating this effect may involve AT1R activation-mediated NADPH oxidase-dependent enhancement of oxidative stress.
Conflict of interest
The authors have no potential conflicts of interest
Acknowledgements
The work was fully supported by a competitive earmarked research grant from the Research Grants Council of Hong Kong, Project CUHK 4537/05M, awarded to PSL.
References
- Wong KC, Wang Z. Prevalence of type 2 diabetes mellitus of Chinese populations in Mainland China, Hong Kong, and Taiwan. Diabetes Res Clin Pract 2006; 73:126-34. [PMID 16563548]
- Harris MI, Flegal KM, Cowie CC, Eberhardt MS, Goldstein DE, Little RR, et al. Prevalence of diabetes, impaired fasting glucose, and impaired glucose tolerance in U.S. adults. The Third National Health and Nutrition Examination Survey. Diabetes Care 1998; 21:518-24. [PMID 9571335]
- Burrows NR, Geiss LS, Engelgau MM, Acton KJ. Prevalence of diabetes among Native Americans and Alaska Natives, 1990-1997: an increasing burden. Diabetes Care 2000; 23:1786-90. [PMID 11128353]
- Pinhas-Hamiel O, Dolan LM, Daniels SR, Standiford D, Khoury PR, Zeitler P. Increased incidence of non-insulin dependent diabetes mellitus among adolescents. J Pediatr 1996; 128:608-15. [PMID 8627431]
- Scheen AJ. Renin-angiotensin system inhibition prevents type 2 diabetes mellitus. Part 1. Meta-analysis of randomised clinical trials. Diabetes Metab 2004; 30:487-96. [PMID 15671918]
- Leung PS. The physiology of a local reninangiotensin system in the pancreas. J Physiol 2007; 580:31-7. [PMID 17218353]
- Lau T, Carlsson PO, Leung PS. Evidence for a local angiotensin-generating system and dosedependent inhibition of glucose-stimulated insulin release by angiotensin II in isolated pancreatic islets. Diabetologia 2004; 47:240-8. [PMID 14722647]
- Wang Z, Rao PJ, Shillcutt SD, Newman WH. Angiotensin II induces proliferation of human cerebral artery smooth muscle cells through a basic fibroblast growth factor (bFGF) dependent mechanism. Neurosci Lett 2005; 373:38-41. [PMID 15555773]
- Papp M, Li X, Zhuang J, Wang R, Uhal BD. Angiotensin receptor subtype AT(1) mediates alveolar epithelial cell apoptosis in response to ANG II. Am J Physiol Lung Cell Mol Physiol 2002; 282:L713-8. [PMID 11880296]
- Zhou Y, Chen Y, Dirksen WP, Morris M, Periasamy M. AT1b receptor predominantly mediates contractions in major mouse blood vessels. Circ Res 2003; 93:1089-94. [PMID 14563714]
- Rajagopalan S, Kurz S, Münzel T, Tarpey M, Freeman BA, Griendling KK, Harrison DG. Angiotensin II-mediated hypertension in the rat increases vascular superoxide production via membrane NADH/NADPH oxidase activation. Contribution to alterations of vasomotor tone. J Clin Invest 1996; 97:1916-23. [PMID 8621776]
- Chu KY, Lau T, Carlsson PO, Leung PS. Angiotensin II type 1 receptor blockade improves betacell function and glucose tolerance in a mouse model of type 2 diabetes. Diabetes 2006; 55:367-74. [PMID 16443769]
- Chan YC, Leung PS. Angiotensin II type 1 receptor-dependent nuclear factor-kappaB activationmediated proinflammatory actions in a rat model of obstructive acute pancreatitis. J Pharmacol Exp Ther 2007; 323:10-8. [PMID 17616560]
- Lupi R, Del Guerra S, Bugliani M, Boggi U, Mosca F, Torri S, et al. The direct effects of the angiotensin-converting enzyme inhibitors, zofenoprilat and enalaprilat, on isolated human pancreatic islets. Eur J Endocrinol 2006; 154:355-61. [PMID 16452552]
- Bas M, Hoffmann TK, Kojda G, Bier H. ACEinhibitor induced angioedema. Laryngorhinootologie 2007; 86:804-8. [PMID 17966084]
- Sica DA, Gehr TW, Ghosh S. Clinical pharmacokinetics of losartan. Clin Pharmacokinet 2005; 44:797-814. [PMID 16029066]
- Lim SC, Koh AF, Goh SK, Chua CL, Heng BL, Subramaniam T, Sum CF. Angiotensin receptor antagonist vs. angiotensin-converting enzyme inhibitor in Asian subjects with type 2 diabetes and albuminuria - a randomized crossover study. Diabetes Obes Metab 2007; 9:477-82. [PMID 17587389]
- Carlsson PO, Berne C, Jansson L. Angiotensin II and the endocrine pancreas: effects on islet blood flow and insulin secretion in rats. Diabetologia 1998; 41:127-33. [PMID 9498644]
- Ramracheya RD, Muller DS, Wu Y, Whitehouse BJ, Huang GC, Amiel SA, et al. Direct regulation of insulin secretion by angiotensin II in human islets of Langerhans. Diabetologia 2006; 49:321-31. [PMID 16416272]
- Chu KY, Leung PS. Angiotensin II Type 1 receptor antagonism mediates uncoupling protein 2- driven oxidative stress and ameliorates pancreatic islet beta-cell function in young Type 2 diabetic mice. Antioxid Redox Signal 2007; 9:869-78. [PMID 17508912]
- Nakayama M, Inoguchi T, Sonta T, Maeda Y, Sasaki S, Sawada F, et al. Increased expression of NAD(P)H oxidase in islets of animal models of Type 2 diabetes and its improvement by an AT1 receptor antagonist. Biochem Biophys Res Commun 2005; 332:927-33. [PMID 15922295]
- Zhang CY, Baffy G, Perret P, Krauss S, Peroni O, Grujic D, et al. Uncoupling protein-2 negatively regulates insulin secretion and is a major link between obesity, beta cell dysfunction, and type 2 diabetes. Cell 2001; 105:745-55. [PMID 11440717]
- Chan CB, MacDonald PE, Saleh MC, Johns DC, Marbàn E, Wheeler MB. Overexpression of uncoupling protein 2 inhibits glucose-stimulated insulin secretion from rat islets. Diabetes 1999; 48:1482-6. [PMID 10389858]
- Briaud I, Kelpe CL, Johnson LM, Tran PO, Poitout V. Differential effects of hyperlipidemia on insulin secretion in islets of langerhans from hyperglycemic versus normoglycemic rats. Diabetes 2002; 51:662-8. [PMID 11872664]
- Evans JL, Goldfine ID, Maddux BA, Grodsky GM. Oxidative stress and stress-activated signaling pathways: a unifying hypothesis of type 2 diabetes. Endocr Rev 2002; 23:599-622. [PMID 12372842]
- Janiak P, Bidouard JP, Cadrouvele C, Poirier B, Gouraud L, Grataloup Y, et al. Long-term blockade of angiotensin AT1 receptors increases survival of obese Zucker rats. Eur J Pharmacol 2006; 534:271-9. [PMID 16516882]