Keywords
Potassium Channels; Protein Kinase C; Staurosporine
Abbreviations
KATP: ATP-sensitive K+; PKC: protein kinase C: PMA: phorbol 12-myristate 13-acetate
INTRODUCTION
The physiological secretagogue, glucose, causes insulin to be released by pancreatic beta cells through a complex mechanism. This process involves the closure of ATP-sensitive K+ (KATP) channels [1], which are directly blocked by intracellular ATP [2], membrane depolarization [3], the opening of voltagegated L-type Ca2+ channels, and a subsequent increase in the cytosolic Ca2+ concentration ([Ca2+]i) [4]. Thus, the closure of KATP channels is regarded as a prerequisite for the glucose-induced insulin release. Sulfonylureas, used in the treatment of diabetes mellitus, have been shown to specifically block the KATP channel [5], thus inducing cell membrane depolarization and insulin secretion. The opposite has been found for the hyperglycemic drug diazoxide, a compound which opens KATP channels, hyperpolarizes the beta cells and inhibits the glucose-induced release of insulin in rat islets [6].
Several reports have shown that glucose can cause the beta-cells to release insulin without altering the cell’s membrane potential or [Ca2+]i level [7-9]. In addition to the block of the KATP channels, insulin release is regulated by a variety of intracellular processes, including changes in intracellular levels of cyclic nucleotides and phosphoinositide turnover. The latter process is mediated by the activation of phospholipase C, resulting in the generation of inositol 1, 4, 5 trisphoshate and diacylglycerol [10]. Whereas inositol 1, 4, 5 trisphoshate releases intracellularly bound Ca2+ [11], diacylglycerol exerts its effects through the activation of protein kinase C (PKC) [12]. The activity of this enzyme has been established in both rat [13] and mouse [14] pancreatic islets as well as in insulinproducing tumor cells [15, 16]. In HIT-T15 cells, Deeney et al. [17] reported that glucose caused translocation of PKC from the cytoplasm to the plasma membrane. Several types of ion channels have also been shown to be modulated by the activation of PKC [18]. For example, phorbol esters and synthetic diacylglycerol, which activate PKC, reportedly block K+ currents [19]. In addition to KATP channels, several other K+ channels were characterized in cultured pancreatic islet cells [20]. However, it is unclear how the individual K+ channel currents are affected by PKC in pancreatic beta cells. Therefore, we attempted to examine the effects of PKC on glucoseinduced insulin secretion via KCa channels by using a PKC inhibitor, staurosporine, in insulinoma HIT-T15 cells.
MATERIALS AND METHODS
Cell Culture
The insulin secreting cell line, HIT-T15 (Dainippon Pharmaceutical Co., Ltd, Osaka, Japan), was cultured at 37 °C in Ham’s F12-K medium (Dainippon Pharmaceutical Co., Ltd, Osaka, Japan) supplemented with 10% fetal bovine serum, 100 IU/ml penicillin and 100 mg/ml streptomycin (all obtained from GIBCO, Grand Island, USA) in an atmosphere of 5% CO2. The medium was changed twice a week and the cell line was passaged once a week.
Measurements of Insulin Secretion
HIT cells were plated into 24-well tissue culture dishes (1 to 10 x 105 cells/well). Prior to any analysis, the plates were rinsed with Tyrode’s solution. This solution contained 128 mmol/L NaCl, 2.68 mmol/L KCl, 1.8 mmol/L CaCl2, 1.64 mmol/L MgCl2 and 10 mmol/L MOPS (3-[N-morpholinol] propanesulfonic acid), pH 7.2. Subsequently, the plates were incubated with test reagents diluted in the same buffer for 60 min. The samples were then collected and frozen at -20 °C. Insulin was measured by radioimmunoassay with commercially available kits according to the manufacturer’s specifications (Waco, Tokyo, Japan).
Measurement of Intracellular Ca2+
The [Ca2+]i levels were studied by using the fluorescent dye fura-2AM (Waco, Tokyo, Japan). Cells were cultured on glass coverslips three days before the experiments. At the time of analysis, these cells were immersed in Tyrode’s solution containing 4 mmol/L fura- 2AM for 30 min at 37 °C. The cells were then transferred to a small incubation bath (0.5 mL) that had been mounted on a microscope stage. The bath temperature was maintained at 37 °C while being perfused with buffer at a rate of 0.8 mL/min during the experimental period. Any fluorescence emitted was measured in the HIT cells on the coverslips by using a fluorescence spectromicroscope (excitation, 340/380 nm, emission, 510 nm). The results were expressed as a ratio of the fluorescence recorded at 340 nm and 380 nm.
Electrophysiologic Measurements
Membrane currents were recorded in the "cellattached" and "inside-out" configurations by employing a patch-clamp amplifier as described by Hamill et al. [21]. The bath solution for the cell-attached mode contained 140 mmol/L KCl, 10 mmol/L MOPS-K, and 1 mmol/L CaCl2. The pipette solution was the same as the cell-attached solution except for the Ca2+ concentration (CaCl2 10-7 mol/L). Soft glass pipettes, prepared in an electrode puller (PP-83, Narishige, Tokyo, Japan), were used after being coated with Sylgard. The electrical resistance of the patch pipette was 5 to 7 MW for single channel recording. Experiments were conducted at a solution temperature between 35 and 37 °C. Data were stored in a PCM recorder (model PCM- 501ES, Sony Co., Tokyo, Japan) with a low pass filter (3 KHz). The pClamp Ver 6.0 software (Axon Instruments Inc., Foster City, USA) was used to analyze the data on single channel currents. The open probability (NPo) was determined from current amplitude histograms and was calculated by using the following equation:
NPo =SS N (n • Pn)
where N is the number of channels in the patch and Pn is the integrated channel opening.
STATISTICAL ANALYSIS
Data are expressed as mean±SD. Differences among data sets were evaluated by the Student’s t-test. A level of P<0.05 was accepted as statistically significant.
RESULTS
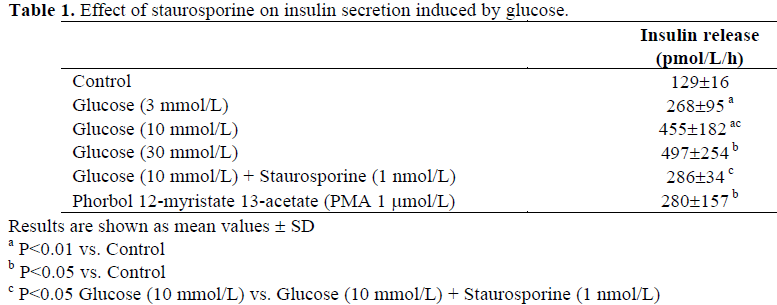
Table 1 shows the effect of glucose on insulin secretion in cultured HIT cells. Glucose (3, 10, 30 mmol/L) caused insulin secretion in a concentration-dependent manner. To determine whether the effects of glucose on insulin secretion involved a PKC, we studied the effect of a PKC inhibitor, staurosporine, on insulin release. The glucose-induced secretion of insulin (at the concentration of 10 mmol/L: 455±182 pmol/L/h, n=8) was significantly attenuated in the presence of 1 nmol/L staurosporine (286±34 pmol/L/h, n=6, P<0.05 vs. 10 mmol/L glucose). In addition, phorbol 12-myristate 13-acetate (PMA: 1 mmol/L), an activator of PKC, alone significantly increased insulin secretion.
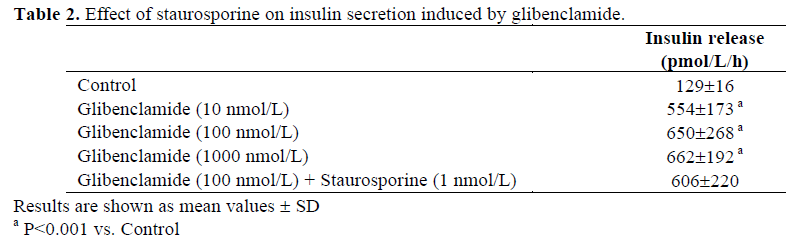
As shown in Table 2, glibenclamide stimulated insulin secretion in a concentration-dependent manner between 10-1,000 nmol/L. Unlike glucose, staurosporine did not attenuate the glibenclamide-induced insulin secretion when stimulated with 100 nmol/L glibenclamide.
Glucose and glibenclamide increased the [Ca2+]i level indicated by 340/380 ratio in a concentration-dependent manner (Figure 1). The 340/380 ratio was 0.928±0.199 in the resting conditions and the peak elevation by 10 mmol/L glucose was 1.307±0.222 (P<0.001, n=8). To clarify whether the decrease in insulin secretion caused by staurosporine was related to changes in the [Ca2+]i, we tested the effect of staurosporine on glucose-induced [Ca2+]i increases. Staurosporine (1 nmol/L) significantly reduced the level of intracellular calcium in the presence of glucose, (340/380 ratio; 1.307±0.222 to 1.123±0.180, P<0.05, n=8, Figure 2A) and the time point was 16 min. PMA alone also increased the [Ca2+]i (1.036±0.122 to 1.186±0.185, P<0.001, n=11) and the time point was 3 min (Figure 2B).
Figure 1. The effects of glucose and glibenclamide on cytosolic Ca2+ in HIT cells. A. Glucose (3, 10, 30 mmol/L) and B. Glibenclamide (10, 100, 1,000 nmol/L) were perfused. The results are presented as the 340/380 nm wavelength
ratio of fluorescence.
Figure 2. A. Effect of staurosporine on glucose-induced [Ca2+]i increase in HIT-T15 cells. Note that staurosporine
partially suppressed increase in [Ca2+]i by glucose. B. Effect of phorbol 12-myristate 13-acetate (PMA) on [Ca2+]i in
fura-2 loaded HIT cells. There was a slight increase in [Ca2+]i by PMA. C. Effect of staurosporine on glibenclamide
induced on [Ca2+]i in fura-2 loaded HIT cells. The increase in glibenclamide-induced [Ca2+]i , and staurosporine and
glibenclamide-induced [Ca2+]i increase was almost at the same level.
Glibenclamide at a concentration of 100 nmol/L increased [Ca2+]i from a control level of 0.968±0.229 to a peak level of 1.407± 0.137 (P<0.05, n=5), but staurosporine had no effect on the glibenclamide-induced [Ca2+]i increase (1.305±0.187, n=5, Figure 2C). These values were obtained after 9 min application of drugs.
To investigate whether the decrease in insulin secretion and [Ca2+]i levels caused by staurosporine were related to the activity of the K+ channels, we studied single channel K+ currents using patch clamp technique. Figure 3A shows the effect of glibenclamide on KATP (channels that had a conductance of 51±13 pS), (n=9, Figure 3A) and KCa channels (223±35 pS), (n=7, Figure 3B). Glibenclamide (100 nmol/L) blocked KATP channel (Figure 3A), but had no effect of KCa channel (Figure 3B). The open probability of the KATP channel was decreased from 0.154±0.088 to 0.014±0.025 (P<0.05, n=6). Figure 3C shows the effect of 10 mmol/L glucose on K+ channel currents in the cell-attached configurations, using symmetrical 150 mmol/L K+, without glucose and at a membrane potential of +40 mV. Glucose blocked the KATP channel and KCa channel almost completely (Figure 3C).
Figure 3. A. Effect of glibenclamide on KATP and KCa channels. Control. KATP channels were recorded at a membrane
potential of -50 mV. After application of glibenclamide (100 nmol/L). Glibenclamide completely blocked KATP channels. B. Control. The KCa channels were recorded at a membrane potential of 50 mV. After application of
glibenclamide (100 nmol/L). The activities of KCa channels were not altered by application of glibenclamide (100
nmol/L). C. Effects of 10 mmol/L glucose on ATP-sensitive K+ (KATP) and Ca2+-dependent K+ (KCa) channel. Both
KATP (small conductance and long opening: arrow) and KCa (large conductance and spiky opening) channels were seen
before application of glucose. The membrane potential was 50 mV. 10 mmol/L glucose blocked both KATP and KCa channels almost completely.
To clarify whether the glucose-induced decrease in KCa channel activity was mediated by PKC, we treated the cells with staurosporine (Figures 4 and 5). To increase KCa channel activity, 1 mmol/L of A23187, a calcium ionophore, was used before the application of glucose. Glucose significantly suppressed the KCa channel activity (Po: 0.221±0.224 to 0.014±0.023, P<0.05, n=7, Figure 4C). This effect was significantly reversed by 1 nmol/L staurosporine (0.014±0.023 to 0.195±0.178, P<0.05, n=7, Figure 4D).
Figure 4. Inhibitory effects of glucose on KCa channels. In this experiment, the membrane potential
was maintained at 40 mV. In control, infrequent KCa channel activity was seen. The application of 1
mmol/L A23187 activated the KCa channels by
increasing [Ca2+]i. The activated KCa channels were
blocked by 10 mmol/L glucose and reactivated by 1
nmol/L staurosporine.
To test whether a PKC activator could mimic the effects of glucose on KCa channels, we tested the effect of PMA on KCa channels (Figure 5). PMA significantly reduced KCa channel activity (0.261±0.243 to 0.027±0.024, P<0.05, n=7). This inhibition was also reversed by the application of 1 nmol/L staurosporine (0.027±0.024 to 0.147±0.122, P<0.05, n=7, Figure 5D).
Figure 5. Inhibitory effects of PKC blockade on KCa channels. The membrane potential was maintained at
40 mV. KCa channels were activated by 1 mmol/L
A23187 and 1 mmol/L. PMA significantly blocked
these channel activities. The KCa channels were
reactivated by adding 1 nmol/L staurosporine to the
same cell.
DISCUSSION
The purpose of the present study was to clarify the significance of PKC in the secretion of insulin induced by glucose. Staurosporine, a PKC inhibitor, attenuated such secretion in insulinoma HIT cells. In patch clamp studies, glucose blocked both the KCa and the KATP channels. This blockade appeared to be mediated by PKC, since staurosporine reversed the effect and PMA mimicked it. Staurosporine also attenuated the increase in [Ca2+]i levels caused by glucose. Thus, PKC contributed to the glucose-induced secretion of insulin at least partly by blocking the KCa channels.
PKC is a calcium- and phospholipiddependent enzyme that is activated by the endogenous second messenger, diacylglycerol [22]. A variety of approaches have been used to investigate the role of the activation of PKC in stimulated secretion. The activation of PKC by such phorbol esters as 12-Otetradecanoylphorbol- 13-acetate (TPA) stimulates the secretion of insulin in the absence or presence of basal levels of glucose (2.8 mmol/L) in rat islet cells [23, 24] and insulinoma cells [16]. In our present study, staurosporine partially suppressed the secretion of insulin by glucose, thus suggesting the involvement of PKC.
Although PKC has been implicated in secretory responses to glucose, its involvement in the regulation of nutrientinduced insulin secretion is controversial. In isolated rat islet of Langerhans, which had been pretreated with PMA for 20-24 h to deplete cells of PKC activity, Hii et al. [25] concluded that PKC activation was not essential to the glucose-induced secretion of insulin. However, in HIT cells, Hughes et al. [26] found that PKC depletion blocked the acetylcholine-induced insulin release as well as decreased the levels of insulin released in response to glucose. In our studies, the glucose-induced insulin secretion was assayed not under the PKC depleted condition but under the acute inhibition of PKC. In this condition, staurosporine caused a slight decrease in glucose-induced insulin secretion compared with that seen in cells stimulated by glucose alone. An increased [Ca2+]i concentration is considered to be the essential event that initiates glucose-induced insulin secretion, and the activation of PKC reportedly increases [Ca2+]i levels. Our study also showed that the inhibition of PKC by staurosporine slightly decreased the [Ca2+]i levels. Therefore, the decrease in glucoseinduced insulin secretion was due to the diminution of [Ca2+]i levels caused by the inhibition of PKC. In contrast with these data, staurosporine had no effect on either glibenclamide-induced insulin secretion or [Ca2+]i increase.
Resting HIT-T15 cells show two types of K+ channels, ATP-sensitive K+ channels (KATP) and Ca2+- and voltage-activated K+ channels (KCa) as in normal pancreatic beta-cells. KATP channels have an important role in insulin secretion and KCa channels also play an important role in beta-cell membrane repolarization after Ca2+ influx via the voltagegated Ca2+ channels. In our experiment, glibenclamide blocked KATP channels selectively, leading to the increase of [Ca2+]i and insulin secretion. It indicates that glibenclamide-induced insulin secretion and [Ca2+]i increase come exclusively from the blocking of KATP channels.
Phorbol ester, an activator of PKC, has previously been shown to block K+ currents in several cell types [19]. The ensuing activation of PKC due to an increase in the level of diacylglycerol leads to the closure of KATP channels. In RINm5F cells, it was also reported that PMA reduces KATP channel activity, leading to membrane depolarization and an increase in [Ca2+]i levels [27]. HIT-T15 cells have the secretory properties of normal islets and respond to nutrient secretagogues such as glucose. Eddkestone et al. demonstrated that glucose depolarizes HIT cells by closing KATP channels [28]. Although HIT-T15 cells have been reported to decrease glucose-induced insulin secretion as passage increases, it has both KATP and KCa channels and they have properties very similar to normal beta cells. Thus, the HIT cells appeared to be a valid model for the investigation. The present study focused on KCa channels, so we did not study KATP channels extensively. Our data showed that in the cell-attached patch configurations, glucose and PMA inhibited the KCa channels that were activated by increasing the [Ca2+]i levels by treatment with A23187 (Figures 4 and 5). The PKC inhibitor staurosporine significantly activated the KCa channels blocked either by glucose (Figure 4) or PMA (Figure 5). These results indicate that the activation of PKC inhibits KCa channels, probably via phosphorylation of the channel protein.
References
- Ashcroft FM, Harrison DE, Ashcroft SJH. Glucose induces closure of single potassium channels in isolated rat pancreatic beta-cells. Nature 1984; 312:446-8.
- Cook DL, Hales CN. Intracellular ATP directly blocks K+ channels in pancreatic Bcells. Nature 1984; 311:271-3.
- Rorsman P, Trube G. Glucose dependent K+-channels in pancreatic beta-cells are regulated by intracellular ATP. Pflugers Arch 1985; 405:305-9.
- Arkhammar P, Nilsson T, Rorsman P, Berggren PO. Inhibition of ATP-regulated K+ channels precedes depolarization-induced increase in cytoplasmic free Ca2+ concentration in pancreatic beta-cells. J BiolChem 1987; 262:5448-54.
- Antomarchi HS, Weille JD, Fosset M, Lazdunski M. The receptor for antidiabetic sulfonylureas controls the activity of the ATPmodulated K+ channel in insulin-secreting cells. J BiolChem 1987; 262:15840-4.
- Henquin JC, Charles S, Nenquin M, Mathot F, Tamagawa T. Diazoxide and D 600 inhibition of insulin release. Diabetes 1982; 31:776-83.
- Gembal M, Gilon P, Henquin JC. Evidence that glucose can control insulin release independently from its action on ATPsensitive K+ channels in mouse B cells. J Clin Invest 1992; 89:1288-95.
- Gembal M, Detimary P, Gilon P, Gao ZY, Henquin JC. Mechanisms by which glucose can control insulin release independently from its action on adenosine triphosphate-sensitive K+ channels in mouse B cells. J Clin Invest 1993; 91:871-80.
- Aizawa T, Sato Y, Ishihara F, Taguchi N, Komatsu M, Suzuki N, et al. ATP-sensitive K+ channel-independent glucose action in rat pancreatic b-cell. Am J Physiol 1994; 266:C622-7.
- Berridge MJ, Irvine RF. Inositol trisphosphate, a novel second messenger in cellular signal transduction. Nature 1984; 312:315-21.
- Streb H, Irvine RF, Berridge MJ, Schulz I. Release of Ca2+ from a nonmitochondrial intracellular store in pancreatic acinar cells by inositol-1,4,5-trisphosphate. Nature 1983; 306:67-9.
- Nishizuka Y. The role of protein kinase C in cell surface signal transduction and tumor promotion. Nature 1984; 308:693-8.
- Tanigawa K, Kuzuya H, Imura H, Taniguchi H, Baba S, Takai Y, et al. Calciumactivated, phospholipid-dependent protein kinase in rat pancreas islets of langerhans. FEBS Lett 1982; 138:183-6.
- Thams P, Capito K, Hedeskov CJ. Endogenous substrate proteins for Ca2+- calmodulin-dependent, Ca2+-phospholipiddependent and cyclic AMP-dependent protein kinases in mouse pancreatic islets. Biochem J 1984; 221:247-53.
- Lord JM, Ashcroft SJH. Identification and characterization of Ca2+- phospholipiddependent protein kinase in rat islets and hamster beta-cells. Biochem J 1984; 219:547- 51.
- Hutton JC, Peshavaria M, Brocklehurst KW. Phorbol ester stimulation of insulin release and secretory-granule protein phosphorylation in a transplantable rat insulinoma. Biochem J 1984; 224:483-90. [85096790]
- Deeney JT, Cunningham BA, Chheda S, Bokvist K, Juntti-Berggren L, Lam K, et al. Reversible Ca2+-dependent translocation of protein kinase C and glucose-induced insulin release. J Biol Chem. 1996; 271:18154-60. [96279367]
- Nishizuka Y. Studies and perspectives of protein kinase C. Science 1986; 233:305-12. [86261771]
- Higashida H, Brown DA. Two polyphoshatidylinositide metabolites control two K+ currents in a neuronal cell. Nature 1986; 323:333-5. [87014781]
- Findlay I, Dunne MJ, Petersen OH. ATPsensitive inward rectifier and voltage- and calcium-activated K+ channels in cultured pancreatic islet cells. J MembrBiol 1985; 88:165-72.
- Hamill OP, Marty A, Neher E, Sakmann B, Sigworth FJ. Improved patch-clamp techniques for high-resolution current recording from cells and cell-free membrane patches. Pflugers Arch 1981; 391:85-100.
- Nishizuka Y. The family of protein kinase C for signal transduction. J Am Med Assoc 1989; 262:1826-33.
- Malaisse WJ, Sener A, Herchuelz A, Carpinelli AR, Poloczek P, Winand J, et al. Insulinotropic effect of the tumor promoter 12-O-tetradecanoylphorbol-13-acetate in rat pancreatic islets. Cancer Res 1980; 40:3827-31.
- Malaisse WJ, Lebrun P, Herchuelz A, Sener A, Malaisselagae F. Synergistic effect of a tumor-promoting phorbol ester and a hypoglycemic sulfonylurea upon insulin release. Endocrinology 1983; 113:1870-7.
- Hii CST, Jones PM, Persaud SJ, Howell SL. A re-assessment of the role of protein kinase C in glucose-stimulated insulin secretion. Biochem J 1987; 246:489-93.
- Hughes SJ, Chalk JG, Ashcroft SJH. The role of cytosolic free Ca2+ and protein kinase C in acetylcholine-induced insulin release in the clonal beta-cell line, HIT-T15. Biochem J 1990; 267:227-32. [90226320]
- Wollheim CB, Dunne MJ, Peter-Riesch B, Bruzzone R, Pozzan T, Petersen OH. Activators of protein kinase C depolarize insulin-secreting cells by closing K+ channels. EMBO J 1988; 7:2443-9. [89052657] Eddlestone GT, Ribalet B, Ciani S. Comparative study of K channel behavior in beta cell lines with different secretory responses to glucose. J MembrBiol 1989; 109:123-34