Lydia Valassi1, Dimitrios Tsimpliaras1, Vassiliki Katseli1, Anastasios Economou1*, Ivan Švancara2, Mat?j Sto?es2, Tomáš Mikysek2, Mamas Prodromidis3
1Laboratory of Analytical Chemistry, Department of Chemistry, University of Athens, Athens, Greece
2Department of Analytical Chemistry, Faculty of Chemical Technology, University of Pardubice, Studentská 573, Pardubice, Czech Republic
3Laboratory of Analytical Chemistry, Department of Chemistry, University of Ioannina, Loannina, Greece
*Corresponding Author:
Anastasios Economou
Laboratory of Analytical Chemistry, Department of Chemistry, University of Athens, Athens 157 71, Greece
Tel: +30 2107274298
E-mail: aeconomo@chem.uoa.gr
Received date: September 09, 2015; Accepted date: September 25, 2015; Published date: October 08, 2015
Citation: Valassi L, Tsimpliaras D, Katseli V, et al. Disposable Nafion-modified Screen-printed Graphite Electrodes for the Rapid Voltammetric Assay of Caffeine. Insights Anal Electrochem. 2015, 1:1. doi:10.21767/2470-9867.100004
Keywords
Screen-printed graphite electrodes; Nafion; Voltammetry; Caffeine; Drink samples; Coffee
Introduction
Caffeine (3,7-dihydro-1,3,7-trimethyL-1H-purine-2,6-dione) is a natural alkaloid belonging to the N-methyl derivatives of xanthine. Caffeine exhibits some important beneficial effects (such as stimulation of the central nervous system and analgesic properties) [1,2] but high dose of this compound may also induce various adverse health effects [3-5]. Globally, caffeine is the most widely used stimulant; apart from its intake through consumption of coffee and tea, it is now a common additive in soft and energy drinks, as well as an ingredient of over-the-counter medications. Due to the popularity and economic importance of caffeine, together with the growing potential for voluntary or involuntary abuse of this compound, reliable analytical methods are required for its determination in food samples. For this purpose, liquid and gas chromatography or selected types of spectroscopy (FT-IR, UV, and NMR) have usually been the techniques of choice [6,7]. Compared to these techniques, electroanalysis offers some advantages, such as operational simplicity, excellent sensitivity, satisfactory linear range, low cost of instrumentation and consumables, scope for miniaturization and rapidity. Regarding the voltammetric determination of caffeine, the main difficulty lies in the very positive oxidation potential of this compound (usually more positive than +1.3 V vs. the Ag/AgCl electrode) at which simultaneous oxidation of the supporting medium usually occurs [7]. This requirement for an extended anodic polarization range poses certain limitations in the range of potentially applicable electrode materials. A comprehensive review of voltammetric approaches for caffeine determnination was recently published [7]. Τhe palette of reported materials for the voltammetric determination of caffeine includes unmodified carbonaceous electrodes: glassy carbon [8], carbon paste [9], carbon fibre [10], pencil lead [11], edge plane pyrolytic graphite [12] and boron-doped diamond [13,14] or solid electrodes modified with Nafion [15,16], conducting polymers [17-20], graphene [21,22] or carbon nanotubes [23,24]. However, unmodified carbon electrodes usually require laborious and time-consuming activation and cleaning procedures. On the other hand, modified solid electrodes, although providing higher sensitivity, normally require a more complex modification procedure and are more difficult to reactivate.
Screen-printing is an alternative attractive approach for the preparation of electrochemical sensors. The advantages of screen-printing for electrode fabrication are the low-cost, disposability, minimal activation requirements, scope for mass production, between-sensor reproducibility, flexibility with respect to the choice of the support(ing) materials and electrode geometry and potential for effective bulk or surface modification [25-27]. However, to our knowledge there is no report on the use of screen-printed graphite electrodes for the electrochemical determination of caffeine. Therefore, the aim of this work was to assess the utility of home-made screen-printed electrodes for the rapid voltammetric assay of caffeine in drink samples.
Materials and Methods
Materials
All the chemicals were of analytical reagent grade and purchased from Merck or Sigma-Aldrich unless stated otherwise. A 4.0 g L-1 stock solution of caffeine was prepared from the solid compound and more dilute standards were prepared in doubly distilled water. 0.25, 0.50, 1.0 and 2.0% (w/v) Nafion solutions were prepared by diluting a 5% (w/v) stock solution of the perfluorinated polymer with absolute ethanol. Samples of energy and cola drinks, purchased from local stores, were purged with N2 to remove CO2 and diluted 1:100 (v/v) (energy drinks) or 1:20 (v/v) (cola drink) with the supporting electrolyte before analysis. 1.8 g of instant coffee sample was dissolved in 100 mL of hot water and further diluted 1:100 (v/v) with the supporting electrolyte before analysis.
Instrumentation
For voltammetric experiments, a portable USB-powered EMSTAT potentiostat (Palmsens, Utrecht, Netherlands) was used in combination with the PSTrace 4.2 software. The working electrode was used in a three-electrode configuration combined with a Ag/AgCl (sat. KCl) reference electrode and a Pt wire as the counter electrode. A glassy carbon electrode magnetic bar rotated at approx. 1000 rpm provided stirring. For electrochemical impedance spectroscopy (EIS) experiments, an Autolab PGSTAT12/FRA2 electrochemical analyzer (Metrohm Autolab, Utrecht, The Netherlands) was used. The impedance spectra were recorded over the frequency range 10-1 to 105 Hz using a sinusoidal excitation signal with amplitude of 10 mV (rms) superimposed on a DC potential of +0.200 V (which is the equilibrium potential of the Fe(CN)6-4/Fe(CN)6-3 couple. EIS measurements were performed in a solution of 0.1 0.1 mol L−1 KCl in the presence of 5 mmol L−1 hexacyanoferrate (II) and 5 mmol L−1 hexacyanoferrate (III) which was used as a redox probe. For scanning electron microscopy (SEM), a JSM-7401F instrument (JEOL, Tokyo, Japan) was used. For HPLC experiments, a LC-20 series chromatograph (Shimadzu Corporation) equipped with a SPD-20A UV-Vis detector was used.
Experimental procedure
Preparation of the screen-printed electrodes: The fabrication of the electrode is schematically illustrated in Figure 1A. Screenprinted electrodes were fabricated over a flexible polyester substrate (Mac Dermid, UK) using a DEK Model 247 screen printer (UK) and polyester screens with 230 mesh for graphite ink (Electrodag PF−407A, Acheson Colloiden, NL) and 280 mesh for dielectric ink D2000222D2, Gwent Ltd., UK). Inks were forced through an emulsion (13-20 μm thick) with the desired pattern using a polyurethane 75 durometer squeegee. Screen-printed electrodes were printed in arrays of five (working) electrodes and consisted of two layers printed in the following order: (i) a layer made of graphite that acted as the working layer, the conductive track and the grip area; and, (ii) the dielectric layer with openings allowing electric contact to the grip area and sample contact to the working area; the circular working area has a diameter of 2 mm. Each layer was cured in an oven using the following conditions: graphite layer, 90°C for 30 min; working layer, 90°C for 120 min, and dielectric layer, 60°C for 30 min. The screenprinted electrode was drop-coated with Nafion by applying a 1 μL-drop of the Nafion solution at the circular working area and letting the solvent evaporate to dryness at room temperature (Figure 1B). Immersion coating was achieved by immersing the circular working area of the screen-printed electrode in 0.25% (w/v) Nafion solution for 5 s and letting the solvent evaporate (Figure 1C); the whole procedure was repeated if required.
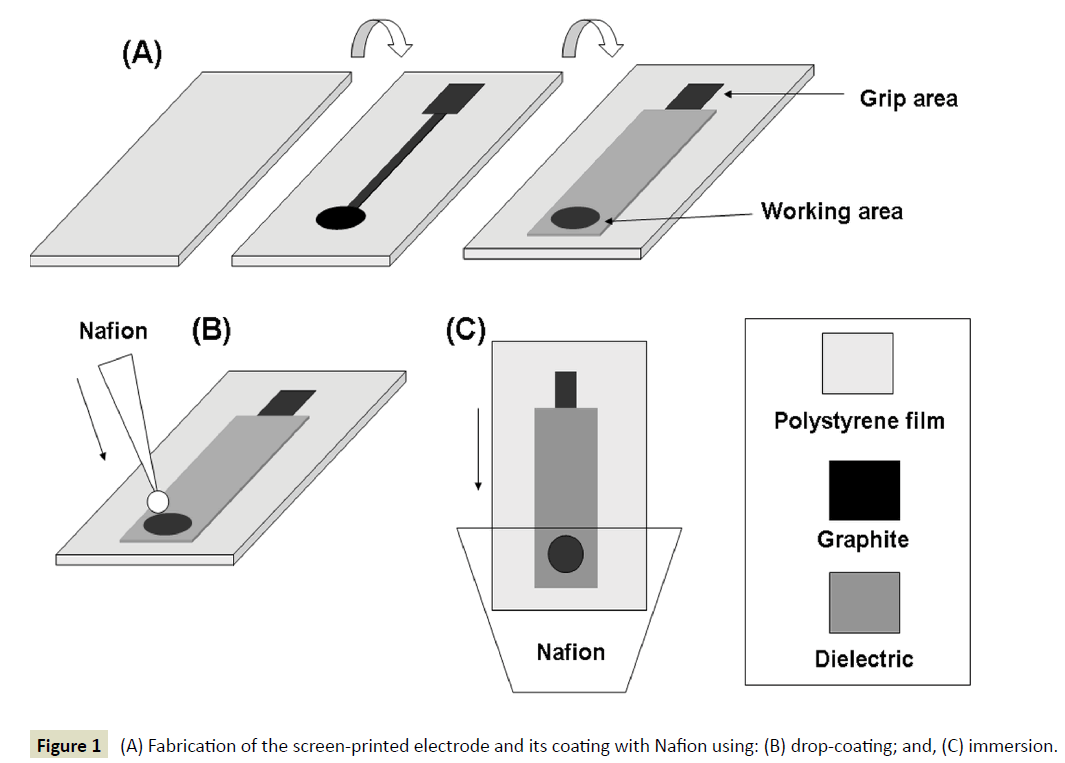
Figure 1 (A) Fabrication of the screen-printed electrode and its coating with Nafion using: (B) drop-coating; and, (C) immersion.
Procedures: For voltammetric analysis, 25.0 mL of supporting electrolyte (or properly diluted sample) was placed in the cell and the background (or sample) voltammogram was recorded. If required, successive additions of a caffeine standard were made in the cell and the analysis procedure was repeated after stirring the solution for 10 s. The selected parameters for the DP voltammetric ramp were as follows: scan rate, 25 mVs-1; pulse amplitude, 25 mV; pulse width, 70 ms; increment, 10 mV; initial potential, +0.90 V; final potential, +1.70 V vs. Ag/AgCl (sat. KCl) electrode. The HPLC method was similar to that reported earlier [28].
Results and Discussion
Comparison of bare and Nafion-coated electrodes
The oxidation of caffeine has been studied in detail earlier [7,29]. The overall irreversible process involves four electrons (4e-) and four protons (4H+), consisting of two consecutive 2e-, 2H+ oxidation steps. The DP voltammograms for caffeine at a glassy carbon electrode, at a bare screen-printed graphite electrode and at a Nafion-coated screen-printed graphite electrode are illustrated in Figure 2. The caffeine oxidation signal at the bare screen-printed graphite electrode (Figure 2b) was higher than at the glassy carbon electrode (Figure 2a). The presence of Nafion induced a further increase in the oxidation current (Figure 2c). The effect of Nafion was in accordance with previous observations that the polymer acted as an accumulation agent for caffeine [15,16]. At the low pH used for the analysis, the protonated form of caffeine predominates and interacts strongly with Nafion which serves as an effective cation exchanger. The timescale of the accumulation process was rather short and occurred at the very initial stages of the contact between the solution and the electrode. This assumption was corroborated by the fact that the DP peak current did not increase with increasing the contact time between the electrode and the sample.
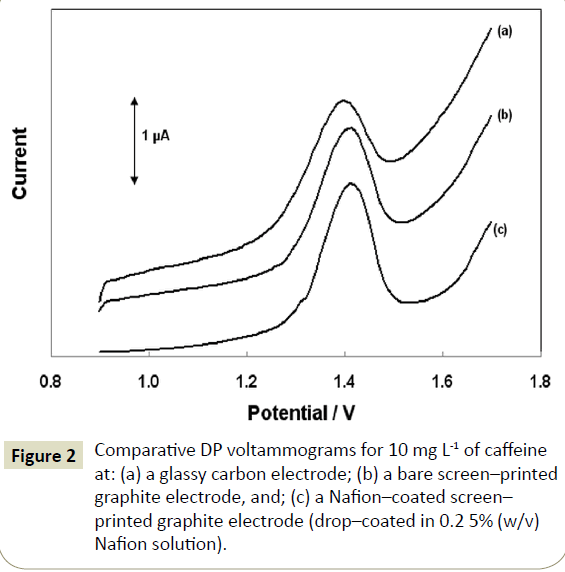
Figure 2: Comparative DP voltammograms for 10 mg L-1 of caffeine at: (a) a glassy carbon electrode; (b) a bare screen–printed graphite electrode, and; (c) a Nafion–coated screen– printed graphite electrode (drop–coated in 0.2 5% (w/v) Nafion solution).
Two methods of coating the electrode with Nafion were studied. The drop-coating method involved application of a 1 μL-drop of Nafion solution at the electrode surface. The effect of the concentration of the Nafion coating solution on the oxidation signal of caffeine is depicted in (Figure 3A). Greater enhancement of the caffeine oxidation current was obtained at the lowest Nafion concentration (0.25% (w/v)) while signal suppression was observed at 1.0 and 2.0% (w/v) Nafion. Nafion concentrations lower than 0.25% (w/v) produced irreproducible results due to nonreproducible coverage of the electrode surface with the polymer film. The second coating method involved immersion of the electrode in Nafion solution; a 0.25% (w/v) Nafion concentration was selected based on the results of the previous study. The effect of the number of immersions (and therefore, the Nafion film thickness) on the oxidation signal of caffeine is illustrated in (Figure 3B); signal enhancement and suppression occurred with a single immersion and three immersions, respectively. These results suggest that thin Nafion films (prepared by using a lower Nafion concentration or a single immersion) induced an increase in the oxidation current. On the contrary, thick Nafion films (prepared by using a higher Nafion concentration or by means of multiple immersions) caused suppression in the oxidation current; this effect was attributed to the inhibition of caffeine mass-transport through the thicker Nafion films. Although dropcoating and single immersion, both implemented with a 0.25% (w/v) Nafion solution, yielded comparable signal enhancement, the latter approach was adopted for the sake of experimental simplicity.
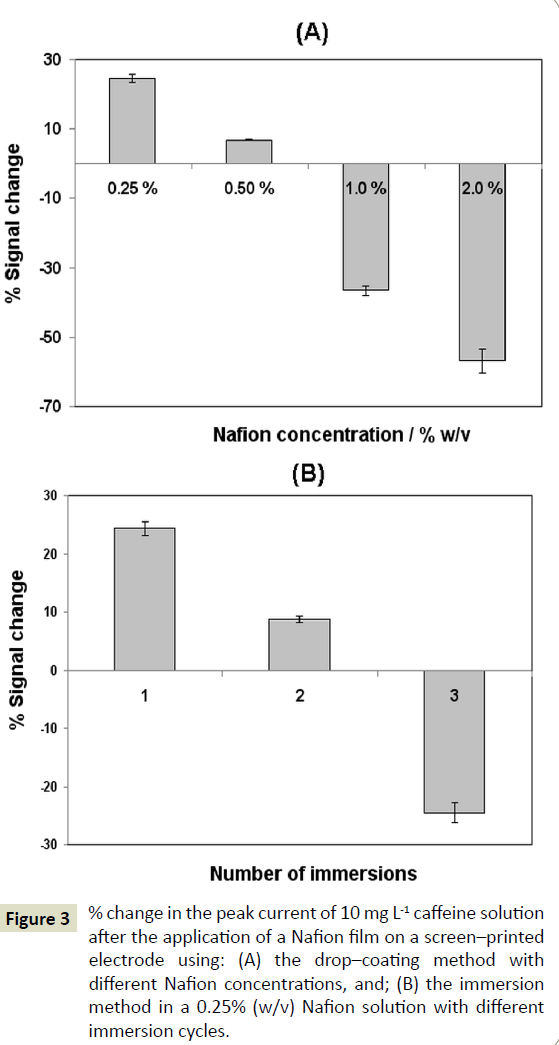
Figure 3: % change in the peak current of 10 mg L-1 caffeine solution after the application of a Nafion film on a screen–printed electrode using: (A) the drop–coating method with different Nafion concentrations, and; (B) the immersion method in a 0.25% (w/v) Nafion solution with different immersion cycles.
The electrode modification with Nafion was inspected by SEM imaging and verified by EIS. At the bare screen-printed electrode, the individual graphite particles are clearly visible in SEM (Figure 4A). On the contrary, in the presence of the Nafion film, the graphite particles are hardy visible as the electrode surface is almost entirely covered by the polymer (Figure 4B). In EIS experiments at the bare and Nafion-coated screen-printed electrodes, the presence of the polymer film was revealed by the substantial increase in the charge-transfer resistance of the modified electrode (Figure 5). The tolerance of the sensors towards interfering sample components was investigated by monitoring the DP peak current response in sample solutions for a number of consecutive measurements (Figure 6). At the bare screen-printed electrode, a continuous gradual decrease of the DP peak current was observed as a result of the gradual electrode fouling by matrix components. In contrast, the response of the Nafion-coated screen-printed electrode was statistically constant for at last 10 consecutive measurements before the response started to decrease. These data demonstrate the ability of the Nafion polymer coating to offer protection of the electrode surface against matrix components. Considering that each analysis practically consisted of 8 measurements (sample plus three standard additions performed in duplicate), the short-term stability of the electrode was satisfactory for its intended use.

Figure 4: SEM images of: (A) a bare screen–printed electrode, and (B) a Nafion–coated screen–printed electrode.
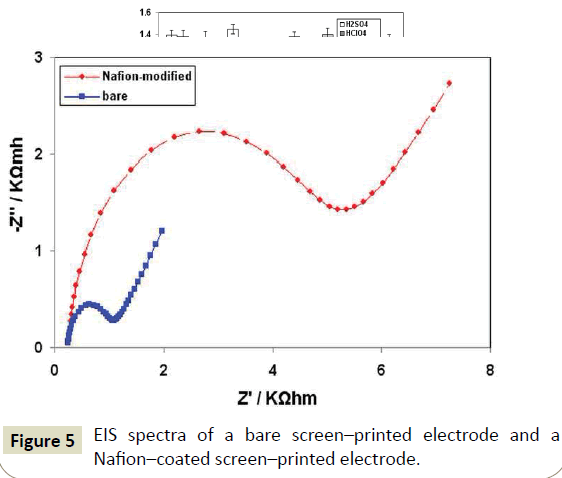
Figure 5: EIS spectra of a bare screen–printed electrode and a Nafion–coated screen–printed electrode.
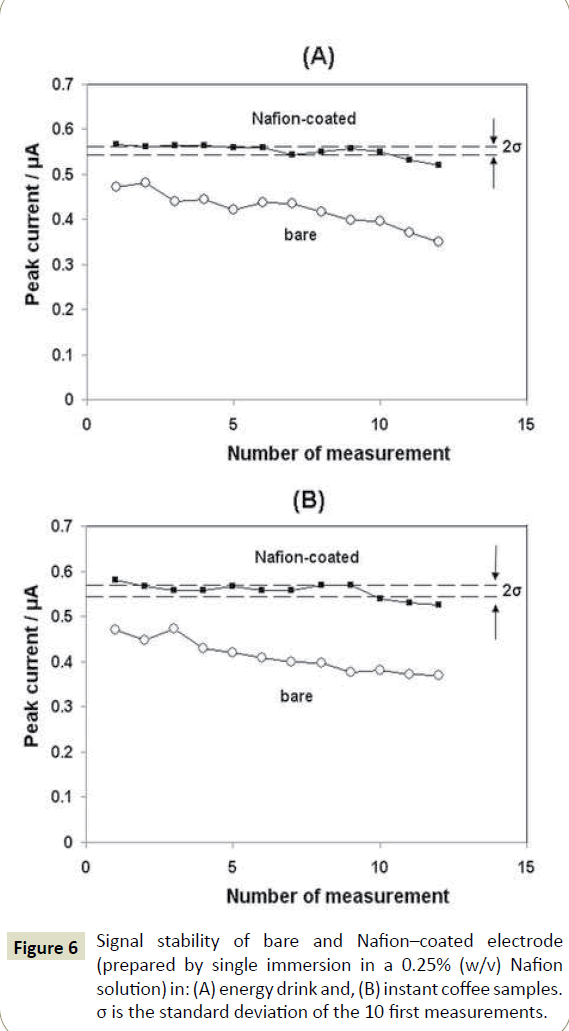
Figure 6: Signal stability of bare and Nafion–coated electrode (prepared by single immersion in a 0.25% (w/v) Nafion solution) in: (A) energy drink and, (B) instant coffee samples. σ is the standard deviation of the 10 first measurements.
Selection of the supporting electrolyte
Since caffeine is oxidized at a rather high positive potential (around +1.4 V vs the Ag/AgCl (at. KCl) electrode), strongly acidic media are required to minimize the simultaneous oxidation of water [9,15,16]. Different acids (H2SO4, HNO3, HClO4, Η3PO4, CH3COOH, and HCl) at four selected concentrations (0.10, 0.20, 0.50 and 1.0 mol L-1) were tested as the supporting electrolytes for the voltammetric determination of caffeine. HNO3 and HCl gave irreproducible results and yielded higher background currents. H2SO4, HClO4, Η3PO4 and CH3COOH were all suitable for caffeine determination but the highest signal-to-noise ratio, as well as the best repeatability were obtained in 0.2 mol L-1 H2SO4 (Figure 7) which was selected as a supporting electrolyte for further measurements.
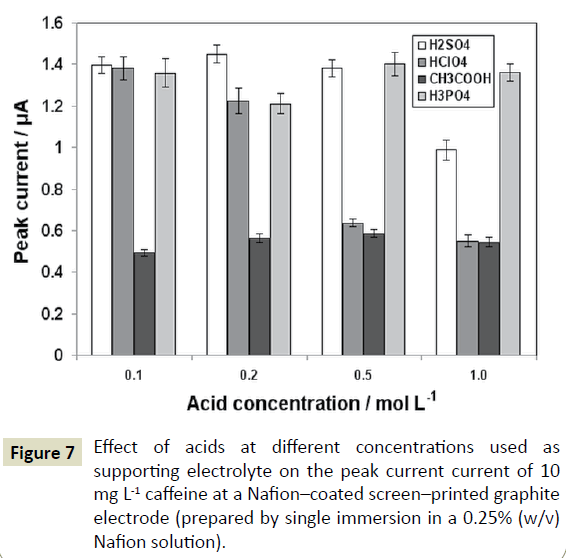
Figure 7: Effect of acids at different concentrations used as supporting electrolyte on the peak current current of 10 mg L-1 caffeine at a Nafion–coated screen–printed graphite electrode (prepared by single immersion in a 0.25% (w/v) Nafion solution).
Selection of the voltammetric waveform
Linear sweep (DC), DP and square wave (SW) voltammograms of caffeine are illustrated in( Figure 8). Although the SW modulation yielded the highest signal, the peak was wider, the background contribution less favourable and the repeatability worse compared to the DP mode. Thus, the DPV mode was chosen and the respective parameters (scan rate, pulse amplitude, pulse width, and increment) were further optimized using a univariate approach.
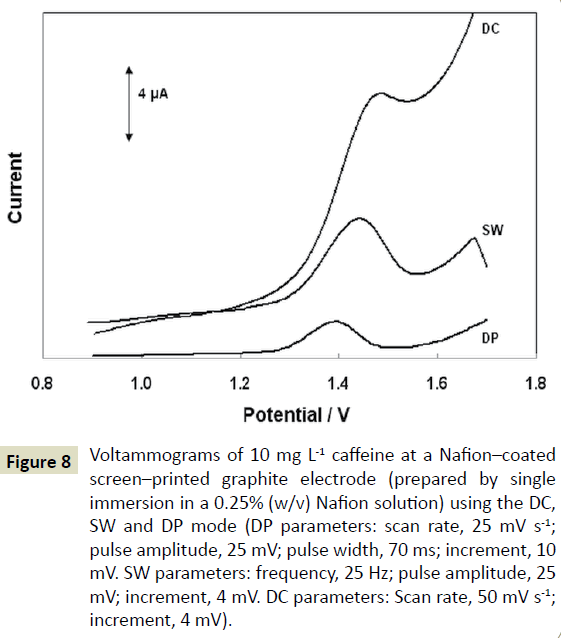
Figure 8: Voltammograms of 10 mg L-1 caffeine at a Nafion–coated screen–printed graphite electrode (prepared by single immersion in a 0.25% (w/v) Nafion solution) using the DC, SW and DP mode (DP parameters: scan rate, 25 mV s-1; pulse amplitude, 25 mV; pulse width, 70 ms; increment, 10 mV. SW parameters: frequency, 25 Hz; pulse amplitude, 25 mV; increment, 4 mV. DC parameters: Scan rate, 50 mV s-1; increment, 4 mV).
Calibration curves and analytical figures of merit
Calibration graphs for caffeine were obtained at the bare and the Nafion-coated screen-printed electrodes and were plotted as the DP peak current vs the caffeine concentration; the analytical figures of merit are summarized in Table 1 and representative DP voltammograms are shown in Figure 9. The limit of detection (LOD) was estimated by calculating the concentration corresponding to a signal equal to the intercept plus 3.3 times the standard deviation of the intercept. The limit of quantification (LOQ) was calculated as the concentration corresponding to the intercept plus 10 times the standard deviation of the intercept. Inspection of the data in Table 1 revealed that the slope of the calibration plot was higher at the Nafion-coated electrode while the LOD and LOQ were lower. More significantly, the repeatability was found much better at the Nafion-coated screen-printed electrode, both at low (2 mg L-1) and high (10 mg L-1) concentration levels. Finally, the matrix effects on the Nafion-modified electrode were lower, as demonstrated in Section 3.1. The between-sensor variability of the Nafion-coated screen-printed electrodes was assessed by recording the DP peak current in a solution containing 10 mg L-1 of caffeine at 10 different electrodes; the % RSD was 12.5% which is considered acceptable for this type of sensor. These figures of merit indicate that the proposed screen-printed electrodes fulfill the fit-for-purpose requirements of the rapid voltammetric caffeine assay. Although there are some reports of voltammetric caffeine sensors with lower LOD, high sensitivity is not a primary requirement for food samples that contain higher amounts of caffeine. In contrast, other performance attributes are more important. Indeed, the Nafion-coated screen-printed electrodes are sufficiently sensitive for their intended purpose, are inexpensive and easy to fabricate, disposable, resistant to electrode fouling and do not require activation/cleaning or complex modification protocols.
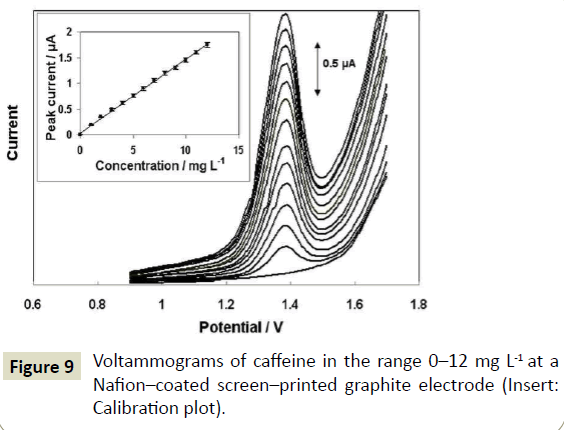
Figure 9: Voltammograms of caffeine in the range 0–12 mg L-1 at a Nafion–coated screen–printed graphite electrode (Insert: Calibration plot).
| |
Bare screen-printed |
Nafion-coated screen-printed |
| Slope (± SD) a(μΑ mg-1L) |
0.113 (± 0.001) |
0.143 (± 0.001) |
| Intercept (± SD) a(μΑ) |
0.036 (± 0.010) |
0.042 (± 0.009) |
| Linear range (mg L-1) |
0.9-54 |
0.6-48 |
| R2 b |
0.998 |
0.999 |
| LOD (mg L-1) c |
0.3 |
0.2 |
| LOQ (mg L-1) d |
0.9 |
0.6 |
| RSD % e (at 2.0 mg L-1)(at 10 mg L-1) |
5.6
3.2 |
2.8
1.3 |
Table 1: Analytical features of merit for caffeine determination at bare and Nafion-coated screen-printed electrodes. aStandard deviation; bCoefficient of determination; cLimit of detection; dLimit of quantification; e% Relative standard deviation of n=8 consecutive measurements.
Analytical applications
The Nafion-coated screen-printed sensors were applied to the determination of caffeine in energy and cola drinks and in instant coffee. The results are summarized in Table 2. The concentration of caffeine in the samples was determined via the recovery, R%, calculated as: R%=[(Cm-Cn)/Cs] × 100, where Cm is the measured caffeine concentration in the sample after spiking, Cn is the native concentration in the sample and Cs is the added concentration in the sample. For proper quantification, the method of multiple standard additions was used in order to account for matrix effects and for the between-sensors variability. As seen in the Table 2, the mean recoveries obtained for the samples at the Nafioncoated screen-printed sensors ranged from 97% to 103% and the results of the voltammetric analysis yielded % relative errors in the range from -5.5 to +2.9% with respect to the reference HPLC method. Both the mean recoveries and the % relative errors demonstrate satisfactory method accuracy. For illustration, DP voltammograms for the determination of caffeine in an energy drink sample by the method of standard additions are shown in Figure 10. For comparison, the same analyses were carried out at bare screen-printed sensors. In this case, the mean recoveries ranged from 81% to 85% and the results of the voltammetric analysis yielded % relative errors in the range from -8.9 to -10.8% with respect to the reference HPLC method. The lower recoveries and higher % relative errors at the bare screen-printed electrodes were attributed to gradual sensor fouling.
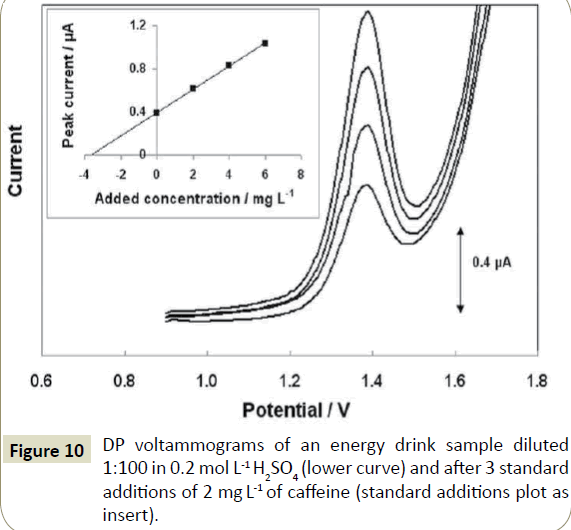
Figure 10: DP voltammograms of an energy drink sample diluted 1:100 in 0.2 mol L-1 H2SO4 (lower curve) and after 3 standard additions of 2 mg L-1 of caffeine (standard additions plot as insert).
| |
Content (HPLC) |
Content (voltammetry) |
R % (SD) a |
er% b |
| Energy drink 1 |
37.1 mg/100mL |
36.2mg/100mL |
102 ± 5 |
–2.4 |
| Energy drink 2 |
27.9mg/100mL |
28.7mg/100mL |
98 ± 4 |
+2.9 |
| Cola drink |
7.2mg/100mL |
6.8mg/100mL |
103 ± 4 |
–5.5 |
| Instant coffee |
31.7mg/g |
33.0mg/g |
97 ± 5 |
–4.1 |
Table 2: Analysis and validation data for caffeine determination in beverages and coffee. aMean % recovery (± standard deviation) (n=3) b% Relative error.
Conclusions
In this work, screen-printed graphite electrodes were applied for the first time to the voltammetric determination of caffeine. The drop-coating and immersion approaches were compared for the modification of the electrode surface with a thin Nafion film. Screen-printed graphite modified with a single immersion in a 0.25% (w/v) Nafion solution improved the sensitivity and the repeatability of the measurements and prevented fouling of the electrode surface from matrix components. The supporting electrolyte and the voltammetric waveform were also studied. The voltammetric method developed, using DP voltammetry in 0.2 mol L-1 H2SO4, was applied to the determination of caffeine in samples of energy and cola drinks as well as of instant coffee. The recoveries were in the range 97% to 103% and % relative errors were in the range from -5.5 to +2.9% with respect to the reference HPLC method; these values were better than those obtained with bare screen-printed electrodes. Therefore, it was demonstrated that the proposed modified electrodes can be considered as excellent fit-for-purpose sensors for the rapid assay of caffeine in drinks.
Acknowledgments
V.K. participated in this work through a LLP-Erasmus Mobility Programme between the University of Athens and the University of Pardubice (ID 1250).
References
- Persad LA (2011) Energy drinks and the neurophysiological impact of caffeine.Front Neurosci 5: 116.
- Shapiro RE (2008) Caffeine and headaches.Curr Pain Headache Rep 12: 311-315.
- Ruxton CHS (2008) The impact of caffeine on mood, cognitive function, performance and hydration: a review of benefits and risks. Nut Bull 33: 15-25.
- Porciúncula LO, Sallaberry C, Mioranzza S, Botton PH, Rosemberg DB (2013) The Janus face of caffeine.Neurochem Int 63: 594-609.
- Nawrot P, Jordan S, Eastwood J, Rotstein J, Hugenholtz A, et al. (2003) Effects of caffeine on human health.Food Addit Contam 20: 1-30.
- De Maria CAB, Moreira RFA (2007) Analytical Methods for Caffeine. Quim Nova 30: 99-105.
- Švorc L (2013) Determination of Caffeine: A Comprehensive Review on Electrochemical Methods. Int J Electrochem Sci 8: 5755-5773.
- Câmpean A, Tertis M, Sandulescu R (2011) Voltammetric determination of some alkaloids and other compounds in pharmaceuticals and urine using an electrochemically activated glassy carbon electrode. Cent Eur J Chem 9: 688-700.
- Stoces M, Kosová L, Švancara I (2013) Determination of caffeine at unmodified carbon paste electrode. Sci Pap Univ Pardubice Ser A 19:5-14.
- Nunes RS, Cavalheiro ETG (2012) Caffeine determination at a carbon fiber ultramicroelectrode by fast-scan cyclic voltammetry. J Brazil Chem Soc 23: 670-677.
- Ly SY, Jung YS, Kim MH, Han IK, Jung WW, et al. (2004) Determination of caffeine using a simple graphite pencil electrode with square-wave anodic stripping voltammetry. Microchim Acta 146: 207-213.
- Goyal RN, Bishnoi S, Agrawal B (2011) Electrochemical sensor for the simultaneous determination of caffeine and aspirin in human urine samples. J Electroanal Chem 655: 97-102.
- Faria EO, Junior ACVL, Souto DEP, Leite FRF, Damos FS, et al. (2012) Simultaneous determination of caffeine and acetylsalicylic acid in pharmaceutical formulations using a boron-doped diamond film electrode by differential pulse voltammetry. Electroanalysis 24: 1141-1146.
- Svorc L, TomÄ?Ãk P, SvÃtková J, Rievaj M, Bustin D (2012) Voltammetric determination of caffeine in beverage samples on bare boron-doped diamond electrode.Food Chem 135: 1198-1204.
- Brunetti B, Desimoni E, Casati P (2007) Determination of caffeine at a Nafion-covered glassy carbon electrode. Electroanalysis 19: 385-388.
- Martínez-Huitle CA, Fernandes NS, Ferro S, De Battisti A, Quiroz MA, et al. (2010) Fabrication and application of Nafion®-modified boron-doped diamond electrode as sensor for detecting caffeine. Diamond Relat Mater 19: 1188-1193.
- Amare M, Admassie S (2012) Polymer modified glassy carbon electrode for the electrochemical determination of caffeine in coffee.Talanta 93: 122-128.
- Jeevagan AJ, John SA (2012) Electrochemical determination of caffeine in the presence of paracetamol using a self-assembled monolayer of non-peripheral amine substituted copper(II) phthalocyanine. Electrochim Acta 77: 137-142.
- Guo S, Zhu Q, Yang B, Wang J, Ye B (2011) Determination of caffeine content in tea based on poly(safranine T) electroactive film modified electrode.Food Chem 129: 1311-1314.
- Aklilu M, Tessema M, Redi-Abshiro M (2008) Indirect voltammetric determination of caffeine content in coffee using 1,4-benzoquinone modified carbon paste electrode.Talanta 76: 742-746.
- Sun JY, Huang KJ, Wei SY, Wu ZW, Ren FP (2011) A graphene-based electrochemical sensor for sensitive determination of caffeine.Colloids Surf B Biointerfaces 84: 421-426.
- Zhao F, Wang F, Zhao W, Zhou J, Liu J, et al. (2011) Voltammetric sensor for caffeine based on a glassy carbon electrode modified with Nafion and graphene oxide. Microchim Acta 174: 383-390.
- Sanghavi BJ, Srivastava AK (2010) Simultaneous voltammetric determination of acetaminophen, aspirin and caffeine using an in situ surfactant-modified multiwalled carbon nanotube paste electrode. Electrochim Acta 55: 8638-8648.
- Yang S, Yang R, Li G, Qu L, Li J, et al. (2010) Nafion/multi-wall carbon nanotubes composite film coated glassy carbon electrode for sensitive determination of caffeine. J Electroanal Chem 639: 77-82.
- Hayat A, Marty JL (2014) Disposable screen printed electrochemical sensors: tools for environmental monitoring.Sensors (Basel) 14: 10432-10453.
- Li M, Li YT, Li DW, Long YT (2012) Recent developments and applications of screen-printed electrodes in environmental assays--a review.Anal Chim Acta 734: 31-44.
- Metters JP, Kadara RO, Banks CE (2011) New directions in screen printed electroanalytical sensors: an overview of recent developments.Analyst 136: 1067-1076.
- Srdjenovic B, Djordjevic-Milic V, Grujic N, Injac R, Lepojevic Z (2008) Simultaneous HPLC determination of caffeine, theobromine, and theophylline in food, drinks, and herbal products.J Chromatogr Sci 46: 144-149.
- Spataru N, Sarada BV, Tryk DA, Fujishima A (2002) Anodic Voltammetry of Xanthine, Theophylline, Theobromine and Caffeine at Conductive Diamond Electrodes and Its Analytical Application. Electroanalysis 14: 721-728.