Keywords
ECG; Abnormal beat; Classification; Correlation based algorithm; Slope-Amplitude algorithm
Introduction
In India, chronic diseases are projected to account for 53% of all deaths. WHO has projected that over the next 10 years in India, over 60 million people will die form a chronic disease. Deaths from chronic diseases will increase by 18%. So, diagnosis of these diseases is crucial if we want to reduce the number of deaths by these diseases. The electrocardiogram (ECG) is one of the simplest and oldest cardiac investigations available. And it provides a wealth of information about the heart of the patient. An ECG is simply a representation of the electrical activity of the heart muscle as it changes with time, usually printed on paper for easier analysis. The majority of the clinically useful information in the ECG is originated in the intervals and amplitudes defined by its features. The improvement of precise and rapid methods for automatic ECG feature extraction is of chief importance, particularly for the examination of long recordings [1]. The ECG feature extraction system provides fundamental features (amplitudes and intervals) to be used in subsequent automatic analysis [2]. In recent times, a number of techniques have been proposed to detect these features [3-5]. The ECG features can be extracted in time domain [6] or in frequency domain [7].
Our aim is to reduce the extensive analysis performed by the physicians thereby saving their time as well as efforts. This analysis requires a lot of medical knowledge to identify the type of abnormality since there exists around 35-40 types of abnormalities of ECG signal for human heart. So manual recognition of all these types has been proved to be a time consuming and tedious task, making the results subjective to the examiner. So, this gave rise to a need for an automation to perform this classification. A lot of work has been done to make this process automated, but very less research has been done using Digital Signal Processor. So, our aim is to make a standalone system that classifies ECG abnormalities using Digital Signal Processor. The system proposed here exploits the morphological characteristics of the ECG signal to accurately classify the abnormalities. This approach yields accurate results while reducing computational efforts required by the classical methods. The morphological characteristics that can be used to extract information from the ECG signal are listed below.
• Time Intervals
• Voltage extremes (amplitude)
• Duration
• Location
The remaining segment of this section provides an overview of previous work done by researchers in the field of ECG abnormality classification.
In Mahamoodabadi et al. has used Daubechies wavelet for ECG feature extraction i. e. detection of QRS complex, P wave and T wave [2]. They achieved sensitivity of 99.18% ± 2.75 for the algorithm applied on MIT-BIH database. Martínez JP et al. and Cuiwei Li et al. have used the wavelet transform for ECG wave delineation and characteristic points (P- wave, T-wave and QRS wave) [3,5]. Krishna Prasad et al. have performed the classification of ECG arrhythmias using the wavelet transform and combination of Genetic Algorithm (GA) and support vector machine (SVM) [4]. The wavelet transform is applied to reduce the noises from ECG signal. The features of ECG signals comprise of both temporal features (like R-R interval, PQ interval, PR interval, and PT interval) and morphological features (like maximum and minimum values of ECG beats). The GA has been used to optimize the feature set, which will improve the performance of SVM classifier.
Hu YH et al. have proposed a patient-adaptable method for classifying the abnormal ECG beats using mix of experts (MOE) technique [6]. Thus, the designed classifier will fine tune itself for different patients’ datasets/features. The proposed approach is based on three artificial neural network (ANN) related algorithms- the self-organizing maps (SOM), the learning vector quantization (LVQ) and the MOE method. The MOE is a combination of global expert (GE) and local expert (LE) classifiers. The local expert classifier is a patient-specific classifier and the global expert classifier works on the classification of ECG beats of many other patients. The SOM and LVQ algorithms are used to train the patient- specific classifier i.e. LE. Finally, the classification outcomes of LE and GE are combined to better overall classification result.
Papaloukas C et al. have presented a comprehensive survey on automated methods for detecting myocardial ischemia from long term ECG [7]. These methods include a digital signal analysis based on wavelet transform and principal component analysis (PCA), rule-based systems, fuzzy logic systems and various forms of artificial neural networks. The features used in these methods are: the average frequency characteristics of ST segments, average of the ST absolute deviation, the average of the ST deviation, the average of the ST slope etc.
Adriana MC et al. has processed a noisy ECG signal obtained from the database and to plot the scalograms of some forms of the ECG [8]. The noisy ECG is first filtered using high-pass filter, notch filter and low-pass filter for removing the lowfrequency noise (baseline wander), powerline interference and high- frequency noise, respectively. The scalograms of ECG signals with bradycardia and tachycardia have been obtained using the continuous wavelet transform (CWT) in Matlab software. These scalograms are apparently different from those of normal ECG beats/ signals.
Sarfaraz et al. have proposed an algorithm that uses independent component analysis (ICA) to improve the performance of ECG pattern recognition [9]. The authors applied the presumption that the components of ECG signals, during the normal and arrhythmic cardiac cycles, generated by the different parts of the heart are independent in nature. The ICA features alongwith the R-R interval and QRS segment power are applied to the classifier. In this work, artificial neural network (ANN) as a classifier, implemented on Matlab software, has been used. Eight beat types- normal beat (NORM), left bundle branch block beat (LBBB), right bundle branch block beat (RBBB), atrial premature beat (APB), premature ventricular contraction (PVC), paced beat (PB), ventricular flutter wave (VFW), and ventricular escape beat (VEB) have been employed in the study. Authors used back propagated neural network (BPNN) as classifier in the training stage. The input is feature vectors and the output value can be set at 1, 2, 3, or 8 for NORM, LBBB, RBBB, or PVC (8 types of ECG). The aim of this stage is for adjusting the best parameters in neural networks for the best classification. To study the effect of the Numbers of independent components (ICs) in ECG beat classification, the numbers of ICs were varied from 5 to 40 and their effects were investigated. The authors achieved the best performance of classifier with 15 ICs.The proposed system seems simple but accurate for real-time performance.
Muthuvel et al. have used Harr Wavelet Transform (HWT) to extract features from the ECG signal [10]. These features of ECG signals have been fed to the classifier- Feed Forward Neural Network. Five types of abnormal beat signals- Left bundle branch block beat (LBBB), Right bundle branch block beat (RBBB), Premature Ventricular Contraction (PVC), Atrial Premature Beat (APB) and Nodal (junction) Premature Beat (NPB) from the MIT-BIH database is used to implement the proposed algorithm. The algorithm is evaluated using the accuracy, sensitivity and specificity parameters. The proposed ECG beat classification technique has achieved the overall accuracy value of 62%, sensitivity value of 73% and specificity value of 63%.
Cherif et al. has proposed a system for collecting cardiac signals with minimal equipment [11]. This system reduces the size of the circuitry by using a processor specializing in audio processing which is the Texas Instruments TMS320C6713 DSP development board. This system focuses on the extraction and processing of the cardiac signal in real time. Adam S et al. have used the distribution of the voltage extreme values of the signal and the time distribution of proper extreme values to extract heartbeats [12]. The algorithm consists of four stages: (amplitude) extremes evaluation, signal smoothing, signal denoising and heartbeat extraction. The algorithm obtained 99.43% rate of heart beats detection from the ECG signals.
ECG classification is carried out based on the correlation coefficient approach [13]. A window is positioned at the QRS complex for the matching of the constituent elements. The window only spans the duration of the QRS complex rather the whole cardiac cycle. The beneficial property helps to minimize the computation in order to achieve classification quickly. Thus, the classification of abnormal beats is based on QRS wave only. The authors used the self- developed “So and Chan” method of QRS detection based on slope parameter only. This QRS detection method is faster than the “Pan- Tompkins” algorithm and more accurate than the QRS detection method developed by Tan et al. In this algorithm the authors have classified the ECG beats as normal beat, atrial premature contraction (APC) beat and ventricular premature contraction (PVC) beat and achieved 99.44%, 100% and 95.35% accuracy (detection rate) for normal beats, APCs and PVCs, respectively.
D. Pandit et al. have presented an efficient algorithm for abnormal beat detection from ECG signals using artificial neural network (ANN) and ensemble classifiers [14]. As per this scheme, first a simplified feature extraction algorithm identifies the locations, amplitudes and duration times of P, Q, R, S, T waves from lead II ECG signals. Eleven features- Normalized P-peak R-peak distance, Normalized Q-peak Rpeak distance, Normalized R-peak S-peak distance, Normalized Q-peak S-peak distance, Normalized R-peak T-peak distance, Normalized P-peak amplitude, R-peak amplitude, Normalized Q-peak amplitude, Normalized T-peak amplitude, Normalized S-peak amplitude and R-R interval are subsequently extracted based on the derived P, Q, R, S and T indicators to represent one-lead heartbeat signal more effectively. Finally, a neural network classifier and an ensemble method with AdaBoost were respectively developed for the detection of abnormal ECG beats based on the above extracted eleven features.
Goutam Kumar S et al. described a five-stage methodology to detect the ischemic episodes in ECG signals [15]. In first stage the ECG recording is pre-processed to achieve noise removal. In the next stage, ECG feature extraction is carried out to locate the changes in QRS-complex, ST-segment and T-wave. Thereafter Heart rate is calculated from the extracted features. In the next stage beat is classified as normal or ischemic using some rule based on medical knowledge and the final stage provides the identification of ischemic episode which is based on the detection of two or more consecutive ischemic windows using first 30s of each ECG recording. The performance of the ischemic episode detection technique is evaluated in terms of sensitivity and positive predictive accuracy.
Automated arrhythmia beat detection from ECG signal using genetic algorithm (GA) and probabilistic neural network (PNN) was described [16]. Two types of input vectors to the ANN are considered. First the whole ECG signal is taken as input; in which case the results are good. In the second input type the reduced data along with the important parameters of ECG beat is considered as input; this way the ANN has better performance because of the reduced overhead. Wavelet transform of type coilflet is used to extract the parameters from ECG waves. It is the most efficient compared to other methods. The set of parameters fed to the network is also very important. To choose the optimum set of parameters among all parameters Genetic Algorithm is used. GA selects the best parameters without affecting the performance of ANN. The set of parameters chosen by GA is in good agreement with the set suggested by physicians to detect arrhythmia type.
Rest of the paper is organized as follows. Section 2 discusses the materials and methods (system hardware and algorithms). Section 3 and 4 describe the discussion and experimental results obtained for the algorithms implemented, respectively. Section 5 concludes this contribution.
Materials and Methods
After surveying the literature, we came to know that more focus is laid upon implementing classification algorithms on signal processing software like Matlab and hardware implementation is being given less importance. The ECG signals provided by various databases are processed and classified by the help of this software. But there is no system that classifies the ECG signal solely using processor like Digital Signal Processor in real time. The use of this signal analyzing software makes these systems unattractive for use in real time. So, there is a need of a system that does the work of analyzing the signal in real time. And the processing capabilities of a Digital Signal Processor make it a strong contender for our application. Hardware implementation of algorithm makes it possible to use the system ideal for using it in real time. The exploitation of morphological characteristics of signals make it possible to reduce the computing efforts required to classify the signal. Hence the classification is done using morphological parameters like value of correlation coefficient between a normal and abnormal signal, slope of the QRS-complex and the amplitude of QRS-complex. These features of the signal require very less computation. By applying a simple equation, we can extract these features and use them to classify the abnormality in the ECG signal.
Experimental system description
We have used Texas Instrument’s TMS320C6713 DSP kit for implementing the algorithm. The features of the kit are listed below.
• 32bit floating point processor
• operating frequency of 225MHz
• Embedded JTAG support via USB
• High-quality 24-bit stereo codec
• Four 3.5mm audio jacks for microphone, line in, speaker and line out
• 512K words of Flash and 16 MB SDRAM
• Expansion port connector for plug-in modules
• On-board standard IEEE JTAG interface
• +5V universal power supply
Code Composer Studio has been used as an integrated development environment (IDE). Its features are listed below.
• Code Composer Studio (CCStudio or CCS) is an IDE to develop applications for Texas Instruments (TI) embedded processors. It includes an optimizing C/C++ compiler, source code editor, project build environment, debugger, profiler, and many other features. The source file (with .c extension) written in C language will be converted to a binary file (.out) by CCS. This file will then be transferred to the TMS3220C6713 kit.
Preprocessing
For this work, the ECG signals available on MIT-BIH database [17] have been used. These signals mainly consist the baseline wander and powerline interference. Thus, to improve the accuracy of the classification we need to de-noise the signal. As we are implementing this algorithm on a DSP processor, there are many constraints like memory, time etc. So, to keeping that in mind our main aim was to reduce the computing effort required to classify the signal which in turn would reduce the memory requirements. This makes this system attractive for real time use. Now, to reduce the computing efforts, we have concentrated more on morphological characteristics of the signal. These characteristics include voltage extremes, time duration of waves, slope of the wave etc. By exploiting these characteristics, we can classify the signal. Figure 1 shows the result of preprocessing implemented on the DSP kit. The right part of the figure is an ECG beat containing powerline interference and the left part of the figure is the de-noised beat.
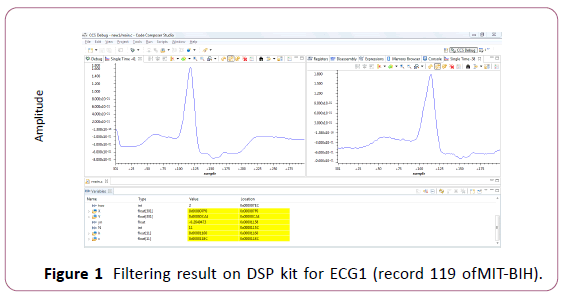
Figure 1: Filtering result on DSP kit for ECG1 (record 119 ofMIT-BIH).
Correlation-based algorithm
This algorithm uses the distinguishing characteristics of abnormal signals in general to classify them.
Meaning, all the abnormal signal has a set of features that make it different than others. Using this fact, we developed an algorithm to correlate a template signal which is a normal signal and depending upon the value or rather the range of values the abnormal signals are classified. Now, the signals that are normal will have a strong correlation coefficient which will be near to 1. So, the beats with correlation coefficient near to value ‘1’ are classified as normal beats. The flowchart of the algorithm is shown in Figure 2. The results obtained by applying this classification algorithm for different abnormal signals are shown in the tables below. It can be observed from these tables that this method or algorithm is less accurate. Because the correlation coefficient alone is not sufficient to provide information for reliable classification. The next algorithm addresses this issue by incorporating two parameters-slope and amplitude- for classification. This algorithm is explained below.
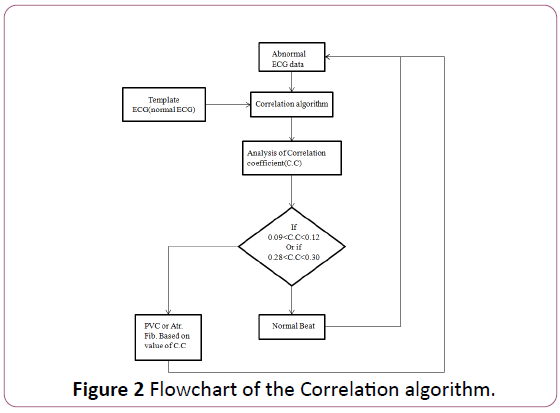
Figure 2: Flowchart of the Correlation algorithm.
Slope and amplitude-based algorithm
In this algorithm two parameters- slope and amplitude- are used to classify the abnormal beats from normal ECG beats.
As explained earlier, the PVC has broader waveform and higher amplitude than the regular normal QRS-waves. Using this fact to our advantage we classified the abnormal beat. The amplitude parameter is self-explanatory, but the formula used for slope is given below.
slope= -2×x(n-2)-x(n-1)+x(n+1)+2×x(n+2)
The reason for using four elements to count the slope is to increase the resolution of the end result which increases the margin between the value of slop for PVC beat and that of the normal beat. So, by taking into account these two parameters, the classification algorithm is implemented. The flow chart of the algorithm is shown in Figure 3.
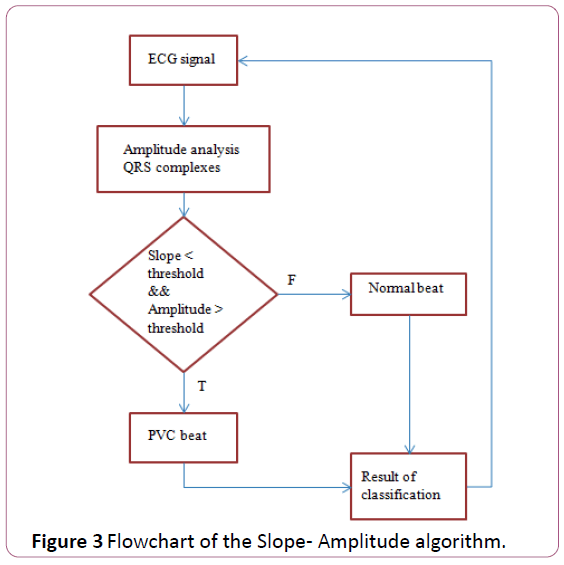
Figure 3: Flowchart of the Slope- Amplitude algorithm.
Discussion
After surveying the literature, we came to know that more focus is laid upon implementing classification algorithms on signal processing software and hardware implementation is being given less importance. Hardware implementation of algorithm makes it possible to use the system ideal for using it in real time. The exploitation morphological characteristics of signals make it possible to reduce the computing efforts required to classify the signal.
Hence the classification is done using morphological parameters like value of correlation coefficient between a normal and abnormal signal, slope of the QRS-complex and the amplitude of QRS-complex. The results in Tables 1 and 2 suggest that using only one parameter for classification can yield low accurate results. These features of the signal require very less computation. By applying a simple equation, we can extract these features and use them to classify the abnormality in the ECG signal. It is evident from the results in Table 3 that using these characteristics we can classify the abnormalities in ECG with fairly high accuracy.
| Sample file no. |
Total No. of atrial fibrillation beats |
No. of Detected atrial fibrillation beats |
Accuracy |
| 05091 |
40 |
25 |
62.5% |
| 06695 |
35 |
22 |
62.8% |
| 06426 |
43 |
29 |
67.4% |
| |
Total beats = 118 |
Total detected beats = 76 |
Average Accuracy = 64.06% |
Table 1: Results of correlation algorithm for atrial fibrillation.
| Sample file No. |
Total No. of PVC beats |
No. of detected PVC beats |
Accuracy |
| 119 |
37 |
26 |
70.27% |
| 106 |
30 |
21 |
70% |
| 105 |
07 |
04 |
57.14% |
| 215 |
19 |
12 |
63.15% |
| |
Total beats = 93 |
Total detected beats = 63 |
Average Accuracy = 67.41% |
Table 2: Results of correlation algorithm for PVC.
| Sample file No. |
Total No. of PVC beats |
No. of detected PVC beats |
Accuracy |
| 119 |
23 |
23 |
100% |
| 106 |
30 |
29 |
97% |
| 105 |
07 |
07 |
100% |
| 112 |
00 |
00 |
100% |
| 215 |
05 |
05 |
100% |
| |
Total beats = 65 |
Total detected beats = 64 |
Average Accuracy = 98.46% |
Table 3: Results of the PVC classification on DSP.
Results
Figure 4 shows the atrial fibrillation beat detected using the correlation-based algorithm. The value of the correlation coefficient (corel) for an abnormal beat with atrial fibrillation comes in the range of 0.09 to 0.126. Thus, for beats which have correlation coefficient in this range is classified as an abnormal ECG beats with atrial fibrillation. For the beat shown in Figure 4, the correlation coefficient value comes out to be 0.12586. The result of correlation between a normal and an abnormal beat with premature ventricular contraction (PVC). The range for correlation coefficient for PVC beat and normal beat is in the range of 0.28 to 0.30. So, the beats having the correlation coefficients in this range are classified as ECG beats with PVC. The correlation coefficient value comes out to be 0.291875. The results obtained by applying the correlation-based algorithm for ECG signals with atrial fibrillation and PVC beats are shown in the Tables 1 and 2 respectively.
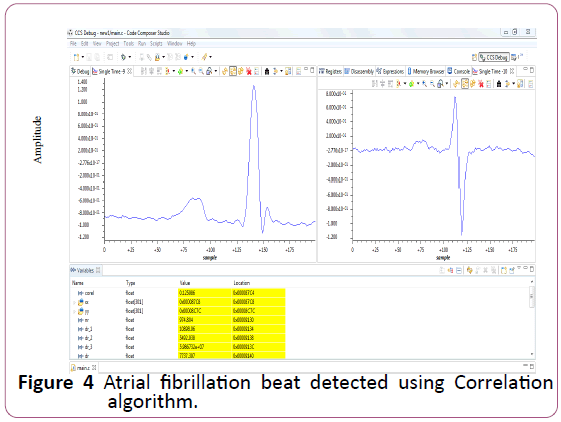
Figure 4: Atrial fibrillation beat detected using Correlation algorithm.
Figures 5-9 shows the results of slope-amplitude based algorithm for PVC beat detection. Here, the beat on the left-hand side is the filtered version of the wave on the right-hand side. The variable ‘count’ in the variable window will show ‘1’ if the beat is a PVC beat and if it’s a normal beat it will show ‘0’. Figure 6 shows the filtered and non-filtered versions of a normal ECG beat for the record number 105 of the MIT-BIH database. We can see that the resulting signal is quite smoothened and the variable ‘count’ is ‘0’ which is suggestive of the fact that it is a normal beat. Figure 7 shows the filtered and non-filtered versions of an abnormal ECG (PVC) beat for the record number 105 of the MIT-BIH database. We can see that the variable ‘count’ is now ‘1’ which indicates that it is an abnormal beat. Table 3 shows the results of slope-amplitude based algorithm for other ECG signals of MIT-BIH database.
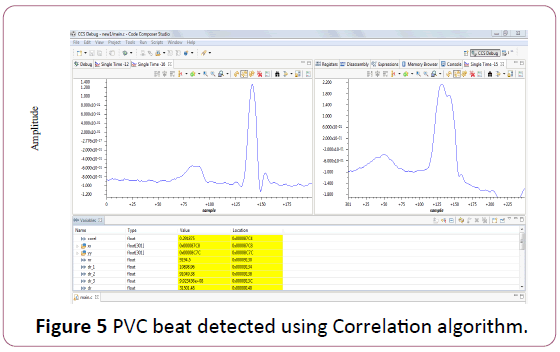
Figure 5: PVC beat detected using Correlation algorithm.
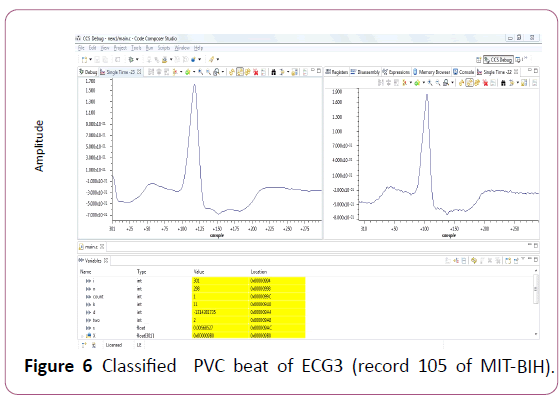
Figure 6: Classified PVC beat of ECG3 (record 105 of MIT-BIH).
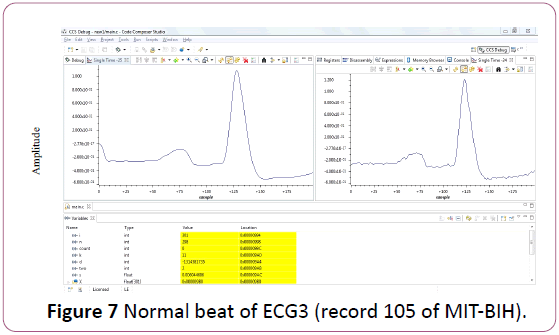
Figure 7: Normal beat of ECG3 (record 105 of MIT-BIH).
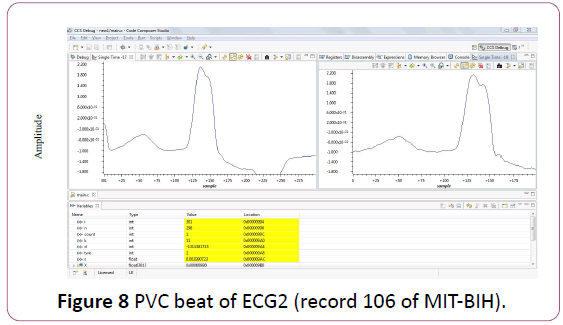
Figure 8: PVC beat of ECG2 (record 106 of MIT-BIH).
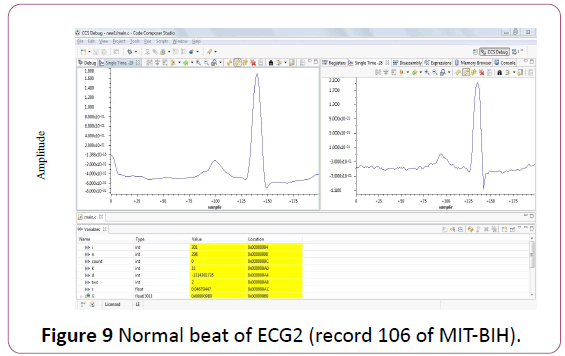
Figure 9: Normal beat of ECG2 (record 106 of MIT-BIH).
Conclusion
In this work, arrhythmia detection and classification from ECG signals has been performed using a digital signal processor-TMS320C6713. Two of the predominant ECG arrhythmias- premature ventricular contraction (PVC) and atrial fibrillation (AF) have been addressed. In order to distinguish the PVC and AF beats from normal ECG beats, algorithms based on the morphological characteristics of arrhythmias have been applied. The PVC and AF beats present in ECG signals have been classified using correlation-based algorithm. Another algorithm based on slope/amplitude has also been implemented for detecting the PVC beats from ECG signals. The slope/amplitude-based algorithm detects the PVC beats with 98.94% accuracy as compared to 65.20% accuracy by correlation-based algorithm. Thus, slope/ amplitude-based algorithm outperforms the correlation-based algorithm. This system is ideal for use in real time applications. The processor used in this work had a major limitation in terms of memory, the data loaded in the program had to be small in amount so that the program could fit in the memory footprint of the processor. Other algorithms, which are computationally complex though, such as Principal Component Analysis (PCA), wavelet transform, Support Vector Machine (SVM) can be implemented on DSP processor for better and accurate classification of abnormal ECG beats. Other abnormalities like atrial/ventricular flutter, T-wave alternans, ventricular fibrillation, tachycardia, bradycardia etc. can also be included for the classification.
References
- www.who.int/chp/chronic_disease_report/media/india.pdf
- Mahmoodabadi SZ, Ahmadian A, Abolhasani MD (2005) ECG feature extraction using daubechies wavelets. Proceedings of the 5th IASTED International conference on Visualization, Imaging and Image Processing, pp: 343-348.
- Martínez JP, Almeida R, Olmos S, Rocha AP, Laguna P (2004) A wavelet-based ecg delineator: evaluation on standard databases. IEEE Trans Biomed Eng 51: 570.
- Krishna Prasad, Sahambi JS (2003) Classification of ECG arrhythmias using multi-resolution analysis and neural networks, IEEE Trans Biomed Eng 1: 227.
- Cuiwei Li, Chongxun Zheng, Changfeng Tai (1995) Detection of ECG characteristic points using wavelet transforms. IEEE Trans Biomed Eng 42: 21.
- Hu YH, Palreddy S, Tompkins W (1997) A patient adaptable ecg beat classifier using a mixture of experts approach. IEEE Trans Biomed Eng 44: 891.
- Papaloukas C, Dimitrios I, Aristidis L, Lampros K, Michalis (2003) Automated methods for ischemia detection in long duration ecgs. Cardiovasc Rev Rep 24: 1.
- Adriana MC, Nicolae MR (2015) Study of ECG signal processing using wavelet transform. Proceedings of the 9th International Symposium on Advanced Topics in Electrical Engn, pp: 27-30.
- Mohammad Sarfraz, Ateeq Ahmed Khan, Francis F (2014) Using independent component analysis to obtain feature space for reliable ECG arrhythmia classification. IEEE International Conference on Bioinformatics and Biomedicine, pp: 62-67.
- Muthuvel, Suresh, Krishna Veni SH, Bharathi Kannan X (2014) ECG signal feature extraction and classification using harr wavelet transform and neural network. Proceedings of the International Conference on Circuit, Power and computing technology, pp: 1396-1399.
- Meddour C, Malika D, Malika T (2013) Acquisition and processing on dsp of a cardiac signal. Proceedings of the 5th International Conference on Information and Communication Systems, pp: 4-8.
- Adam S, Khalid S, Ferscha A (2010) A new method for ecg signal feature extraction, proceeding ICCVG’10 Proceedings of the 2010 international conference on Computer vision and graphics: part II, pp: 334-341.
- Chuang, Ben-Yi Liau (2005) Using correlation coefficient in ecg waveform for arrhythmia detection. Biomed Eng Appl Basis Commun 17: 147.
- Pandit D (2014) An efficient abnormal beat detection scheme from ecg signals using neural network and ensemble classifiers. 8th International conference on software, knowledge, Information management and applications (SKIMA), Dhaka, Bangladesh.
- Goutam Kumar S, Samit A, Sarat Kumar P (2013) ECG signal analysis for detection of heart rate and ischemic episodes. Int J Adv Com Res 3: 148-152.
- https://arxiv.org/pdf/1209.0167.pdf
- www.physionet.org/physiobank/database/mitdb