Marie-Claude Vohl1,2, Frédéric Guénard1,2, André Tchernof1,2,3, Yves Deshaies3,4, Katherine Cianflone3,4, John G. Kral5 , Picard Marceau3,6
1Institute of Nutrition and Functional Foods (INAF) and School of Nutrition, Laval University, Quebec, Canada
2Endocrinology and Nephrology, CHU de Quebec Research Center, Canada
3Quebec Heart and Lung Institute, Quebec, Canada
4Department of Medicine, Laval University, Quebec, Canada
5Departments of Surgery and Medicine, SUNY Downstate Medical Center, Brooklyn, New York, USA
6Department of Surgery, Laval University, Quebec, Canada
*Corresponding Author:
Marie-Claude Vohl
Institute of Nutrition and Functional Foods (INAF), Université Laval
2440 Hochelaga Blvd, Quebec, Quebec, Canada
Tel: 418-656-2131
E-mail: marie-claude.vohl@fsaa.ulaval.ca
Received date: September 03, 2015; Accepted date: September 24, 2015; Published date: October 03, 2015
Citation: Vohl MC, Guénard F, Tchernof A, et al. Differential Methylation of Inflammatory and Insulinotropic Genes after Metabolic Surgery in Women. J Clin Epigenet. 2016, 1:1. DOI: 10.21767/2472-1158.100001
Copyright: © 2016 Vohl MC, Guénard F, Tchernof A, et al. This is an open-access article distributed under the terms of the Creative Commons Attribution License, which permits unrestricted use, distribution, and reproduction in any medium, provided the original author and source are credited.
Keywords
Epigenetics, Bariatric surgery, Genome-wide methylation, Diabetes, Cardiometabolic risk
Abbreviations
BMI, body mass index; BPD-SD, biliopancreatic diversion with duodenal switch; DBP, diastolic blood pressure; ECM, extracellular matrix; HOMA-IR, homeostatic model of insulin resistance; IGT, impaired glucose tolerance; IPA, Ingenuity Pathway Analysis; RYGB, Roux-en-Y gastric bypass; SBP, systolic blood pressure; T2DM, type 2 diabetes mellitus; TC, total cholesterol; TG, triglycerides.
Introduction
Obesity with dyslipidemia, type 2 diabetes mellitus (T2DM) and hypertension contributes to high prevalences of morbidity and excess mortality worldwide. Weight loss is associated with an improved metabolic risk profile in severely obese individuals [1]. Metabolic surgery is the most effective treatment of obesity and its comorbidities, improving glucose and lipid metabolism and preventing hypertension and T2DM [2,3] more than nonsurgical methods [4]. Moreover, surgery decreases obesityrelated low-grade inflammation [5]. Biliopancreatic diversion with duodenal switch (BPD-DS) is the most effective metabolic bariatric operation [2,3] because it combines sleeve gastrectomy and duodeno-jejunal and proximal ileal bypass-induced reduced absorption predominantly of lipids [6].
Epigenetic marks are traditionally defined as heritable changes in gene expression without alterations in DNA sequence, providing a potential mechanism by which environmental factors influence phenotypic variation [7]. Components of the obesity-related metabolic complications are under the influence of complex interactions between genetic/epigenetic and environmental factors [8], thus warranting assessment of gene methylation in relation to obesity complications and weight loss. Animal studies of diets, weight change and caloric restriction demonstrated changes in gene methylation levels [9,10] similar to those we [11] and others [12] observed in human adipose tissue following caloric restriction. Furthermore, the clinical studies demonstrated pre-intervention differences in methylation levels of several genes including some related to energy balance and insulin secretion between high and low responders to caloric restriction [11,12]. Roux-en-Y gastric bypass (RYGB), a metabolic, gastro-pyloro-duodenal restrictive bypass operation altering nutrient digestion, flow and sequence and magnitude of incretin peptide release, induced more profound epigenetic changes in whole blood than very low calorie diets in an analysis focusing on specific genes [13].
The present study was designed to analyze relationships between gene methylation levels in blood and metabolic risk factors comparing women after pylorus-preserving malabsorptive BPD-DS surgery to non-operated, untreated, severely obese women. Pathway analyses were conducted to identify potential mechanisms associated with metabolic improvements induced by this operation.
Methods
Patients
Twenty unrelated women who had undergone BPD-DS [2] between 1998 and 2005 were recruited. Clinical data and blood samples were obtained at follow-up visits in 2010. Preoperative data were obtained from medical records. Lacking banked presurgical blood samples for these 20 operated women primarily identified to assess the impact of maternal bariatric surgery on offspring [14], 20 severely obese unoperated women recruited from the list of candidates for BPD-DS at the Quebec Heart and Lung Institute (Quebec City, Quebec, Canada) were matched for age, BMI, comorbidities (hypertension, dyslipidemia, T2DM), medication and smoking status (current vs. non-smoker) to operated women.
Cardiometabolic markers
Weight, height, body mass index (BMI) and resting systolic (SBP) and diastolic (DBP) blood pressure were measured according to standard practice. Blood samples were collected after an over-night fast in tubes containing EDTA, measuring plasma lipids [total cholesterol (TC), LDL-C, HDL-C, and triglycerides (TG)] and glucose concentrations as described [15]. Diagnoses of T2DM and prediabetes [impaired glucose tolerance (IGT); fasting glucose >6.0 mmol/l], hypertension (SBP >140 or DBP >90), hypertriglyceridemia (TG >2.3 mmol/l) [16] and/or relevant medication were retrieved from medical records. In unoperated obese controls and post-surgery patients insulin levels were measured by ELISA (ALPCO Diagnostics) and homeostatic model of insulin resistance (HOMA-IR) index was calculated as glucose (mmol/l) x insulin (mU/ml) /22.5.
DNA extraction and genome-wide methylation analysis
Blood genomic DNA was isolated from the blood buffy coat using the GenElute™ Blood Genomic DNA kit (Sigma). Quantification and verification of DNA quality were conducted via both NanoDrop spectrophotometer (Thermo Scientific) and PicoGreen DNA methods. Bisulfite conversion and quantitative DNA methylation analysis from 1 μg of DNA was performed at the McGill University and Genome Quebec Innovation Centre (Montreal, Canada). Samples were loaded on nine different Infinium® HumanMethylation450 BeadChips (Illumina Inc.) to minimize any batch effect and processed following manufacturer instructions. The BeadChip interrogates more than 485,000 methylation sites at a single-nucleotide resolution and can accommodate 12 samples simultaneously.
Methylation data were visualized and analyzed with the GenomeStudio® software, version 2011.1 (Illumina Inc.) and the Methylation Module. None of the samples were excluded following quality control steps assessed by bisulfite conversion, extension, staining, hybridization, target removal and negative and non-polymorphic control probes. Methylation levels (beta values; β) were estimated as the ratio of signal intensity between methylated and sum of methylated and unmethylated alleles (β value = C/(T+C)). The β values vary from 0 (no methylation) to 1 (100% methylation). Data correction (background subtraction and normalization) used internal control probe pairs. Probe type-specific normalization was conducted using internal control probes using the GenomeStudio Methylation Module normalization algorithm. CpG sites with a detection p-value >0.05 or located on Y chromosome were not analysed. The presence of SNPs in CpG site surrounding regions may potentially affect methylation levels, we excluded polymorphic CpG sites according to Chen et al. [17] (CpG sites with SNP underneath or with SNP at the position where single-base extension occurs) and to BeadChip annotation leaving 349,740 CpG sites for statistical analyses. Between-group differences in methylation levels (mean β values) were tested using Student t-test in Genome Studio software. Bonferroni correction of the differential methylation analysis provided a p-value cutoff of p<1.43x10⁻⁷ (based on 0.05/349,740) for statistical significance. “Overmethylated” and “undermethylated” probes were defined in the study group relative to obese controls.
Gene expression analysis
Expression levels for the most differentially methylated genes were retrieved from previously obtained microarray data (HumanHT-12 v4 Expression BeadChip, Illumina Inc.) for a subset of the postsurgery study group (N=18). Briefly, microarray experiments were carried out using 250 ng of total RNA isolated and purified from whole blood using PAXgene™ Blood RNA Kit (Qiagen) and processed according to the manufacturer’s instructions at the McGill University and Génome Québec Innovation Centre (Montréal, Canada). Expression data was visualized and analyzed as previously described [14].
Gene functions and pathways analysis
We identified potentially altered pathways from the top 200 differentially methylated genes (top 100 overmethylated + top 100 undermethylated) produced from differentially methylated probes, thus focusing on genes showing differences in methylation levels of more than 10% thus having higher probability of functional impact. Analyses were also conducted separately on the full sets of overmethylated (N=188) and undermethylated (N=3660) genes with differences in methylation levels greater than 10%. Ingenuity Pathway Analysis® (IPA) classified genes according to functions and pathways (calculating p-values with righttailed Fisher’s exact test for each). Statistically overrepresented functions and pathways (p≤0.05) were then identified in the lists of differentially methylated genes.
Ethics
The study was approved by the Quebec Heart and Lung Institute and Université Laval ethics committees; all participants provided written informed consent. The study protocol respects the ethical guidelines of the “World Medical Association Declaration of Helsinki”.
Statistics
Clinical data were expressed as mean ± SD. Differences in anthropometric and clinical data between the pre-operative and control patients and between the controls and the postsurgery patients were tested by t-tests. Within-group paired t-tests compared pre- to post-surgery clinical data. Differences in categorical variables and distribution of CpG sites were assessed using the Chi-square test. Pairwise Pearson correlations were computed for all CpG site methylation levels in the control and post-surgery groups. Similar analyses were conducted for a subset of differentially methylated CpG sites. CpG site methylation levels from the most differentially methylated genes were correlated with corresponding gene expression levels. CpG site methylation levels from differentially methylated genes related to the function termed “Insulin-dependent diabetes mellitus” function, thereafter termed “diabetes”, were correlated with plasma glucose and insulin levels as well as HOMA-IR using pairwise Pearson correlations. Statistical significance was defined as p≤0.05. Statistical analyses for clinical data were conducted using the SAS software version 9.2 (SAS Institute Inc.) and descriptive statistics for genome-wide methylation data were calculated in R version 2.14.1 (R Foundation for Statistical Computing; www.rproject. org).
Results
Patient characteristics
Pre-surgical clinical characteristics of women from the control and operated groups were similar (29.2±3.3 years for control and 29.9±3.8 for study groups). BMI, plasma lipid and glucose levels were not significantly different (p>0.05) between the groups (Table 1), 3 patients in each group were dyslipidemic and 6 in each were hypertensive where one control patient was on medication.
| Characteristics |
Control group |
Study group |
P-value (pre-surgery vs. controls) |
Paired p-value (pre- vs. post-surgery) |
P-value (controls vs. post-surgery) |
| Pre-surgery |
Post-surgery |
| Age atoperation (years) |
29.2 ± 3.3 |
28.9 ± 3.7 |
41.0 ± 5.3 |
0.800 |
< 0.0001 |
< 0.0001 |
| BMI (kg/m2) |
45.8 ± 5.7 |
45.0 ± 7.2 |
27.6 ± 4.8 |
0.695 |
< 0.0001 |
< 0.0001 |
| Blood pressure (mm Hg) |
|
| SBP |
130.0 ± 12.4 |
136.9 ± 11.1 |
112.2 ± 9.5 |
0.069 |
< 0.0001 |
< 0.0001 |
| DBP |
81.3 ± 8.6 |
87.3 ± 10.1 |
68.2 ± 8.9 |
0.051 |
< 0.0001 |
< 0.005 |
| Hypertension (N) |
6 |
6 |
0 |
1.000 |
0.020 |
0.020 |
| Lipid profile |
|
| TC (mmol/l)III |
4.68 ± 0.62 |
4.93 ± 0.79 |
3.52 ± 0.49 |
0.283 |
< 0.0001 |
< 0.0001 |
| LDL-C (mmol/l)II |
2.79 ± 0.58 |
3.00 ± 0.83 |
1.68 ± 0.50 |
0.379 |
< 0.0001 |
< 0.0001 |
| HDL-C (mmol/l)I |
1.22 ± 0.21 |
1.14 ± 0.26 |
1.39 ± 0.25 |
0.310 |
< 0.0001 |
0.023 |
| TC/HDL-CI |
3.93 ± 0.75 |
4.63 ± 1.69 |
2.59 ± 0.59 |
0.100 |
< 0.0001 |
< 0.0001 |
| TG (mmol/l)I |
1.48 ± 0.68 |
1.65 ± 0.76 |
0.97 ± 0.41 |
0.467 |
0.003 |
0.007 |
| Glucose metabolism |
|
| Fasting glucose (mmol/l)IV |
5.2 ± 0.9 |
5.7 ± 2.4 |
4.7 ± 0.3 |
0.346 |
0.060 |
0.038 |
| IGT |
3 |
4 |
0 |
1.000 |
0.106 |
0.231 |
| Insulin (mU/mL)V |
26.6 ± 23.9 |
N/A |
3.1 ± 1.7 |
--- |
--- |
< 0.0001 |
| HOMA-IRV |
5.9 ± 5.0 |
N/A |
0.7 ± 0.4 |
--- |
--- |
< 0.0001 |
Abbreviations: SD, standard deviation; N, numbers; N/A, not available; BMI, body mass index; TC, total cholesterol; LDL-C, low-density lipoprotein cholesterol; HDL-C, high-density lipoprotein cholesterol; TG, triglycerides; SBP, systolic blood pressure; DBP, diastolic blood pressure; IGT, impaired glucose tolerance; HOMA-IR, homeostatic model of insulin resistance.
I Pre-surgery group N=16. II Pre-surgery group N=15. III Pre-surgery group N=18. IV Pre-surgery group N=19. V Pre-surgical insulin levels were not available (N/A) for the study group.
Table 1: Characteristics of control and study groups (means ± SD).
Mean postoperative follow-up for the post-surgery study group was 12 years 2 months (range: 4-22 years). BPD-DS induced changes in cardiometabolic risk profile following intervention with significant improvements in plasma lipids (p=0.003 for TG and p<0.0001 for HDL-C, LDL-C, TC and TC/HDL-C ratio), blood pressure (SBP and DBP; p<0.0001), and resolution of hypertension and IGT.
All parameters were statistically significantly different between non-operated controls and the post-surgical group (p=0.02 - <0.0001) reflecting clinically significant metabolic improvements after BPD-DS surgery, as previously reported [2].
Global methylation levels
Briefly, the call rate for methylation data for both groups was 99.9%. Systematic exclusion of polymorphic CpG sites resulted in 349,740 CpG sites for further analyses. Lower global methylation levels were observed in the post-surgical group compared to controls; 40% of highly methylated probes post-surgery vs. 42% in controls (p<0.0001; Figure S1), representing 136,413 CpG sites with low methylation levels in controls in comparison to 142,612 in post-surgery study patients. These results suggest that there are important differences in gene expression levels between groups. The majority of CpG sites demonstrated similar levels of methylation between control and post-surgery groups evident in a correlation of r=0.997 (p<2.2x10⁻¹⁶; Figure 1, Panel A).
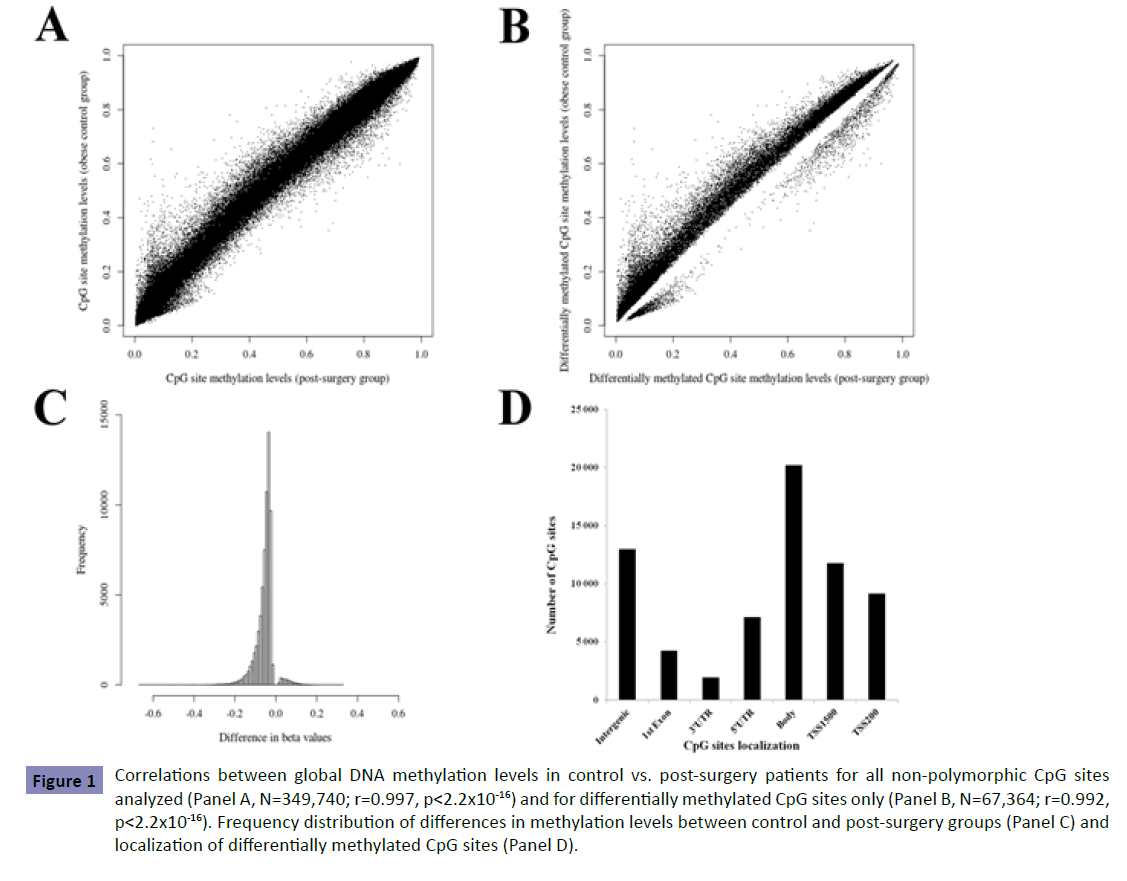
Figure 1: Correlations between global DNA methylation levels in control vs. post-surgery patients for all non-polymorphic CpG sites analyzed (Panel A, N=349,740; r=0.997, p<2.2x10⁻¹⁶) and for differentially methylated CpG sites only (Panel B, N=67,364; r=0.992, p<2.2x10⁻¹⁶). Frequency distribution of differences in methylation levels between control and post-surgery groups (Panel C) and localization of differentially methylated CpG sites (Panel D).
Differential methylation analysis
Differential methylation analysis for non-polymorphic CpG sites identified 67,364 sites exhibiting significant postoperative differences (p<1.43x10⁻⁷). Lower correlation was observed for differentially methylated sites compared to correlation obtained considering all sites analyzed (Figure 1, Panel B). Most of the differentially methylated CpG sites (88.5%) showed absolute differences (<10%) in DNA methylation between groups with 11.5% of the sites demonstrating group differences above 10% (Figure 1, Panel C). Most undermethylated and overmethylated genes are shown in Table S1. Among the differentially methylated CpG sites, 80.8% were located within gene regions (Figure 1, Panel D). Exclusion of age-associated CpG sites (according to refs. [18,19]) and their respective genes revealed statistically significant group differences with minor effects on the distribution of CpG site localization in 67,245 CpG sites. From the 15,343 genes demonstrating at least one differentially methylated site, 11,769 (77%) were identified by two or more probes with 179 showing significant differences in methylation levels for all CpG sites assessed. To further assess the potential impact of differences in methylation levels between groups, the correlation between gene methylation and expression levels was assessed in the post-surgery study group for which gene expression levels were available (N=18). Significant correlations between gene methylation and expression levels were found for most overmethylated and undermethylated genes with some others demonstrating barely significant correlations (Table S2).
Gene function and pathway analysis
Gene function and pathway analysis, from the list of the 200 differentially methylated genes [top 100 undermethylated + top 100 overmethylated (Table S1)] with the largest betweengroup differences identified “Systemic autoimmune syndrome”, “Rheumatoid arthritis” and “Diabetes” among the top 10 overrepresented functions. The majority of genes were inflammation- or immune function-related, such as 13 among the 14 genes in the “diabetic” function cluster. Pathway analysis revealed 4 statistically significantly overrepresented pathways (Rac signaling, Actin cytoskeleton signaling, D-myo-inositol (1,4,5)-trisphosphate biosynthesis and Regulation of actin-based motility by Rho). Trends towards overrepresentation (p<0.10) were identified for 12 pathways including “Insulin receptor signaling” and “Hypoxia signaling in the cardiovascular system” (Figure S2). Analysis of all overmethylated and undermethylated genes separately confirmed overrepresentation of Rac signaling and Actin cytoskeleton signaling pathways in undermethylated genes. In addition, 159 other pathways were overrepresented from the list of undermethylated genes in the post-surgery study group relative to obese controls among which top pathways were related to intracellular signaling (G-protein coupled receptor signaling, signaling by Rho family GTPases, cAMP-mediated signaling), immunity (IL-8 signaling, leukocyte extravasation signaling) and cancer (molecular mechanisms of cancer, pancreatic adenocarcinoma, non-small cell lung cancer signaling).
Correlations between CpG site methylation levels and diabetes-related variables
Correlations between methylation levels of the most significantly differentially methylated CpG sites for each of 14 genes related to “diabetes” function, among which the insulin receptor gene, INSR, and fasting insulin levels and HOMA-IR index were statistically significant (p≤0.002 for all sites; Table 2). Among the overmethylated “diabetes” genes, FKBP1A, a regulator of neuronal differentiation and immune responsiveness, and ZNF323, a member of the zinc-finger transcription factor family expressed in the pancreas, exhibited the highest correlations with insulin and HOMA-IR.
| CpG site (Gene) |
Position* |
Fasting glucose |
Insulin |
HOMA-IR |
| cg14793544 (ABCF1) |
Chr6:30538842 |
0.300 (0.060) |
0.597 (<0.0001) |
0.614 (<0.0001) |
| cg16500605 (BAT3) |
Chr6:31620861 |
0.308 (0.053) |
0.533 (0.0004) |
0.541 (0.0003) |
| cg07516946 (FKBP1A) |
Chr20:1373593 |
0.293 (0.066) |
0.614 (<0.0001) |
0.627 (<0.0001) |
| cg05055326 (HCG9) |
Chr6:29945080 |
0.289 (0.070) |
0.611 (<0.0001) |
0.627 (<0.0001) |
| cg17353079 (HSPA1L) |
Chr6:31779020 |
-0.307 (0.054) |
-0.536 (0.0004) |
-0.565 (0.0001) |
| cg19280196 (HTT) |
Chr4:3234462 |
-0.336 (0.034) |
-0.514 (0.0007) |
-0.535 (0.0004) |
| cg21403543 (IFIT2) |
Chr10:91061583 |
0.378 (0.016) |
0.539 (0.0003) |
0.569 (0.0001) |
| cg14900579 (INSR) |
Chr19:7294137 |
0.327 (0.040) |
0.604 (<0.0001) |
0.623 (<0.0001) |
| cg21323836 (NCRNA00171) |
Chr6:29985506 |
-0.324 (0.041) |
-0.555 (0.0002) |
-0.585 (<0.0001) |
| cg06658129 (OR12D2) |
Chr6:29364602 |
-0.275 (0.086) |
-0.576 (<0.0001) |
-0.594 (<0.0001) |
| cg24192846 (PPP1R11) |
Chr6:30037773 |
-0.362 (0.022) |
-0.480 (0.002) |
-0.524 (0.0005) |
| cg22772698 (ZBP1) |
Chr20:56195991 |
-0.331 (0.037) |
-0.501 (0.001) |
-0.526 (0.0005) |
| cg07369507 (ZNF323) |
Chr6:28304287 |
0.329 (0.038) |
0.583 (<0.0001) |
0.609 (<0.0001) |
| cg20325280 (ZNF705A) |
Chr12:8324153 |
-0.338 (0.033) |
-0.580 (<0.0001) |
-0.597 (<0.0001) |
Pearson’s r coefficients are shown. Associated p-values are in parenthesis. Abbreviations: Chr, Chromosome; HOMA-IR, homeostatic model of insulin resistance.
* Genome build 37.
Table 2: Correlations between diabetes-related phenotypic variables and methylation levels for the most differentially methylated CpG sites from genes related to “diabetes” function.
Discussion
We found differences in genome-wide CpG site methylation levels between a control group of unoperated severely obese premenopausal surgical candidates matched to pre-operative phenotypes of other women who subsequently underwent BPDDS, a metabolic gastrointestinal bypass operation. Gene function and pathway analyses identified potentially mechanistic genes associated with post-surgical metabolic improvements which exhibited correlations between CpG site methylation levels and diabetes-related phenotypes. We show large differences in cardiometabolic parameters associated with differences in DNA methylation levels between the obese control and post-BPDDS patients. We found a high proportion of CpG sites with high (>75%) or low (<25%) levels of methylation in agreement with other genome-wide methylation studies [20,21] and strong correlations among methylation levels in blood as shown by others in blood, muscle and adipose tissue [18,21].
Our findings of significant long-term differences in global CpG site methylation in blood contrast with one study of blood methylation patterns in post-menopausal women in a diet and exercise program [22], and with a 6-month study of skeletal muscle changes after gastric bypass [23]. In the latter study, differentially methylated CpG sites were almost exclusively undermethylated (397 out of 409) similar to the very long term methylation levels we found. It is tempting to speculate that greater metabolic improvements after BPD-DS [2,3] may cause greater global genome-wide differences in methylation levels via reduction of overnutrition-driven toxicity (nutritoxicity), especially lipotoxicity [9,10,24]. BPD-DS may have both short- and long-term persistent effects on methylation levels explaining the larger differences observed in the present study in comparison to studies evaluating methylation levels 1-2 days, 6 or 12 months after different bariatric operations [13,23].
Overrepresentation of immune and inflammatory genes identified in our study is consistent with reduced low-grade inflammation after bariatric surgery [5], changes in methylation levels in blood following RYGB [13] and expression levels in adipose tissue one year after BPD-DS [25]. Concurrent overrepresentation of immune and inflammatory genes and genes related to cellular assembly and organization (Actin cytoskeleton signaling and Regulation of actin-based motility by Rho pathways) accords with remodeling of adipose tissue extracellular matrix (ECM). These results may represent an interplay between ECM components and inflammatory processes [26] and are in agreement with previously reported similar changes in adipose tissue gene expression levels one year after BPD-DS [25]. Our findings of overrepresentation of the Hypoxia Signaling pathway is concordant with the relative hypoxia of obese patients [27,28] and adipose tissue as well as aberrant pro-inflammatory ECM remodeling [26,29], both of which are reversed postoperatively.
Gene methylation differences in diabetic functions and pathways agree with gene expression profiling in blood before and after bariatric surgery demonstrating changes in genes related to lipid metabolism, obesity and T2DM as well as metabolic pathways related to small molecule biochemistry and gene expression [30]. Genes related to RNA processing were also overrepresented agreeing with studies of genes related to gene expression and to transcriptional, translational and transport processes (RNA processing, tRNA metabolism, translation, protein transport) in adipose tissue and blood following bariatric surgery [25,30]. Our identification of Rac signaling pathways is in line with the dysmetabolic diathesis of diabesity, Rac1 being activated by insulin, necessary for insulin-stimulated GLUT4 translocation and inducing actin cytoskeleton remodeling of plasma membrane in skeletal muscle [31]. Concurrent overrepresentation of D-myoinositol (1,4,5)-trisphosphate biosynthesis also supports the finding of altered diabetic functions and pathways post-surgery as well as abnormalities in inositol metabolism associated with diabetes and its comorbidities [32]. Supplementation of myoinositol has been shown to improve HOMA-IR in postmenopausal women with the metabolic syndrome [33].
Globally, correlation of methylation levels for selected CpG sites with insulin and HOMA-IR suggests that epigenetic changes after BPD-DS may be determinants of the durable metabolic improvement, although the current study was not designed to analyse differences in gene expression levels between control and post-surgical patients. Nonetheless, our results agree with previous pre- vs. post-surgery reports showing alterations in similar functions [13,25,30,34,35]. Furthermore, specific differentially methylated genes related to those with “diabetic” functions identified here (ABCF1, FKBP1A, IFIT2, HTT) and correlated with insulin levels and HOMA-IR have also been shown previously to be differentially expressed in adipose tissue and/ or skeletal muscle [23,25,34]. FKBP1A participates in neuronal differentiation and plasticity affecting age-related cognitive dysfunction, a comorbidity of diabesity. Furthermore it modulates immune responsiveness in the non-neuronal acetylcholine system mediated by the vagus nerve innervating the foregut. ZNF323 is a member of the zinc-finger transcription factor family and is involved in the development of liver, intestine and pancreas: key organs in nutrient trafficking affecting the dysmetabolic diathesis of diabetes.
Taken together our findings fit conceptually into an ergostatic theory of energy balance postulating a developmentally conserved adaptive framework of energy supplies cyclically fluctuating between surfeit and deficit both of which elicit inflammatory responses and drive neuro-endocrine regulation of pancreatic and intestinal effects on nutrient trafficking contributing to insulin resistance [36].
Limitations of this study
Our patients are cross-sectionally studied without longitudinal sequential samples necessary to fully assess potential temporal postoperative changes in methylation levels. While insulin levels were measured and HOMA-IR index was calculated in control and postoperative women, classical measures of insulin resistance such as oral glucose tolerance tests or hyperinsulinemic euglycemic clamps were not performed. Our study design resulted in age differences between the two groups but we systematically excluded age-associated CpG sites [18,19] to rule out such effects. Our array approach may have led to overrepresentation of CpG sites in gene surrounding regions [37]. Whole-genome bisulfite sequencing may be necessary to fully determine the effects of bariatric surgery on CpG site methylation levels in intergenic regions. Since the presence of SNPs may affect methylation levels of CpG sites we excluded CpG sites with SNPs in surrounding regions. We extracted blood DNA to assess global metabolic changes although analyses of other metabolically relevant tissues might contribute valuable information on postoperative improvements, even though the overall impact of tissue-specific methylation patterns is likely minor in view of reported similarities between tissues [38,39]. Our results of long-term effects of BPD-DS might be specific and not applicable to purely restrictive operations or those with other mechanisms.
In summary, BPD-DS associated long-term effects on cardiometabolic risk may be attributable to changes in gene regulation. Differences in blood global methylation levels between obese control and post-surgical patients suggest that CpG site methylation levels are subject to substantial changes following BPD-DS. By reducing inflammation and overnutrition, characteristic of the dysmetabolic syndrome of diabesity, BPD-DS may alter CpG site methylation levels. Although methylation is generally accepted as an epigenetic marker of choice, we must also consider the potential mechanistic importance of histone modification, changes in chromatin structure and/or interfering microRNAs or combinations of these as activators or silencers of specific genes. Future studies utilizing other techniques will be necessary to uncover the upstream mechanisms of the postoperative reversal of diabesity related nutritoxicity.
Funding
This study was supported by a grant-in-aid from the Heart and Stroke Foundation of Canada (G-14-0005824).
Acknowledgment
We thank all participants for their excellent collaboration, the surgeons of the department of bariatric surgery at the Quebec Heart and Lung Institute (Laurent Biertho, Simon Biron, Frédéric- Simon Hould, Stéfane Lebel, Odette Lescelleur, Simon Marceau) for their involvement in clinical care and subject recruitment. We express our gratitude to Suzy Laroche for help in sample and clinical information collection and Paule Marceau for subject recruitment, data management and project coordination. We would like to acknowledge the contribution of Christine Racine, Caroline Gagnon and Mélanie Nadeau for their help in management of the tissue bank. We acknowledge the contribution of the McGill University and Genome Quebec Innovation Centre for gene methylation array analyses. M.C.V. is Canada Research Chair in Genomics Applied to Nutrition and Health.
References
- Janosz KE, Zalesin KC, Miller WM, McCullough PA, Franklin BA (2009) Impact of surgical and nonsurgical weight loss on diabetes resolution and cardiovascular risk reduction. CurrDiab Rep 9:223-228.
- Marceau P, Biron S, Marceau S, Hould FS, Lebel S,et al. (2015) Long-Term Metabolic Outcomes 5 to 20 Years AfterBiliopancreatic Diversion. ObesSurg 25:1584-1593
- Buchwald H, Avidor Y, Braunwald E, Jensen MD, Pories W, Fahrbach K, et al. (2004) Bariatric surgery: a systematic review and meta-analysis. JAMA 292:1724-1737.
- Gloy VL, Briel M, Bhatt DL, Kashyap SR, Schauer PR, et al. (2013) Bariatric surgery versus non-surgical treatment for obesity: a systematic review and meta-analysis of randomised controlled trials. BMJ 347: f5934.
- Rao SR (2012)Inflammatory markers and bariatric surgery: a meta-analysis. Inflamm Res 61:789-807.
- Rosa G, Mingrone G, Manco M, Euthine V, Gniuli D, et al. (2007) Molecular mechanisms of diabetes reversibility after bariatric surgery. Int J Obes (Lond) 31:1429-1436.
- Feinberg AP (2008) Epigenetics at the epicenter of modern medicine. JAMA 299:1345-1350.
- Martinez JA, Cordero P, Campion J, Milagro FI (2012) Interplay of early-life nutritional programming on obesity, inflammation and epigenetic outcomes. Proc Nutr Soc 71:276-283.
- Milagro FI, Campion J, Garcia-Diaz DF, Goyenechea E, Paternain L,et al. (2009) High fat diet-induced obesity modifies the methylation pattern of leptin promoter in rats. J Physiol Biochem 65:1-9.
- Widiker S, Karst S, Wagener A, Brockmann GA (2010) High-fat diet leads to a decreased methylation of the Mc4r gene in the obese BFMI and the lean B6 mouse lines. J Appl Genet 51:193-197.
- Bouchard L, Rabasa-Lhoret R, Faraj M, Lavoie ME, Mill J, et al. (2010) Differential epigenomic and transcriptomic responses in subcutaneous adipose tissue between low and high responders to caloric restriction. Am J ClinNutr 91:309-320.
- Milagro FI, Campion J, Cordero P, Goyenechea E, Gomez-Uriz AM, et al. (2011) A dual epigenomic approach for the search of obesity biomarkers: DNA methylation in relation to diet-induced weight loss. FASEB J 25:1378-1389.
- Kirchner H, Nylen C, Laber S, Barres R, Yan J, et al. (2014) Altered promoter methylation of PDK4, IL1 B, IL6, and TNF after Roux-en Y gastric bypass. SurgObesRelat Dis 10: 671-678.
- Guenard F, Deshaies Y, Cianflone K, Kral JG, Marceau P, et al. (2013) Differential methylation in glucoregulatory genes of offspring born before vs. after maternal gastrointestinal bypass surgery. Proc Natl Acad Sci USA 110:11439-11444.
- Robitaille J, Despres JP, Perusse L, Vohl MC (2003) The PPAR-gamma P12A polymorphism modulates the relationship between dietary fat intake and components of the metabolic syndrome: results from the Quebec Family Study. Clin Genet 63:109-116.
- Expert Panel on Detection EaToHBCiA (2001) Executive Summary of the Third Report of The National Cholesterol Education Program (NCEP) Expert Panel on Detection, Evaluation, And Treatment of High Blood Cholesterol In Adults (Adult Treatment Panel III). JAMA 285:2486-2497.
- Chen YA, Lemire M, Choufani S, Butcher DT, Grafodatskaya D, et al. (2013) Discovery of cross-reactive probes and polymorphic CpGs in the Illumina Infinium Human Methylation450 microarray. Epigenetics 8:203-209.
- Bell JT, Tsai PC, Yang TP, Pidsley R, Nisbet J, et al. (2012) Epigenome-wide scans identify differentially methylated regions for age and age-related phenotypes in a healthy ageing population. PLoS Genet 8.
- Rakyan VK, Down TA, Maslau S, Andrew T, Yang TP, et al. (2010) Human aging-associated DNA hypermethylation occurs preferentially at bivalent chromatin domains. Genome Res 20: 434-439.
- Bell JT, Pai AA, Pickrell JK, Gaffney DJ, Pique-Regi R, et al. (2011) DNA methylation patterns associate with genetic and gene expression variation in HapMap cell lines. Genome Biol 12: R10.
- Ribel-Madsen R, Fraga MF, Jacobsen S, Bork-Jensen J, Lara E, et al. (2012) Genome-wide analysis of DNA methylation differences in muscle and fat from monozygotic twins discordant for type 2 diabetes. PLoS One 7:e51302.
- Duggan C, Xiao L, Terry MB, McTiernan A (2014) No effect of weight loss on LINE-1 methylation levels in peripheral blood leukocytes from postmenopausal overweight women. Obesity (Silver Spring) 22:2091-2096.
- Barres R, Kirchner H, Rasmussen M, Yan J, Kantor FR, et al. (2013) Weight loss after gastric bypass surgery in human obesity remodels promoter methylation. Cell Rep 3:1020-1027.
- Mingrone G, DeGaetano A, Greco AV, Capristo E, Benedetti G, et al. (1997) Reversibility of insulin resistance in obese diabetic patients: role of plasma lipids. Diabetologia 40:599-605.
- Dankel SN, Fadnes DJ, Stavrum AK, Stansberg C, Holdhus R, et al. (2010) Switch from stress response to homeobox transcription factors in adipose tissue after profound fat loss. PLoS One 5:e11033.
- Lee MJ, Wu Y, Fried SK (2010) Adipose tissue remodeling in pathophysiology of obesity. CurrOpinClinNutrMetab Care 13:371-376.
- Oppenheimer BW, Berger KI, Rennert DA, Pierson RN, Norman RG, et al. (2006) Effect of circulatory congestion on the components of pulmonary diffusing capacity in morbid obesity. Obesity (Silver Spring) 14:1172-1180.
- Sixt R, Bake B, Kral J (1976) Closing volume and gas exchange in obese patients before and after intestinal bypass operation. (A preliminary report). Scand J Respir Dis Suppl 95:65-72.
- Trayhurn P (2014) Hypoxia and adipocyte physiology: implications for adipose tissue dysfunction in obesity. Annu Rev Nutr 34:207-36.
- Berisha SZ, Serre D, Schauer P, Kashyap SR, Smith JD (2011) Changes in whole blood gene expression in obese subjects with type 2 diabetes following bariatric surgery: a pilot study. PLoS One 6:e16729.
- Chiu TT, Jensen TE, Sylow L, Richter EA, Klip A (2011) Rac1 signalling towards GLUT4/glucose uptake in skeletal muscle. Cell Signal 23:1546-1554.
- Croze ML, Soulage CO (2013) Potential role and therapeutic interests of myo-inositol in metabolic diseases. Biochimie 95:1811-1827.
- Santamaria A, Giordano D, Corrado F, Pintaudi B, Interdonato ML, et al. (2012) One-year effects of myo-inositol supplementation in postmenopausal women with metabolic syndrome. Climacteric 15:490-495.
- Cancello R, Henegar C, Viguerie N, Taleb S, Poitou C, et al. (2005) Reduction of macrophage infiltration and chemoattractant gene expression changes in white adipose tissue of morbidly obese subjects after surgery-induced weight loss. Diabetes 54:2277-2286.
- Henegar C, Tordjman J, Achard V, Lacasa D, Cremer I, et al. (2008) Adipose tissue transcriptomic signature highlights the pathological relevance of extracellular matrix in human obesity. Genome Biol 9: R14.
- Kral JG (2005)The pathogenesis of obesity: Stress and the brain-gut axis. SurgObesRelat Dis 1:25-34.
- Grundberg E, Meduri E, Sandling JK, Hedman AK, Keildson S, et al. (2013) Global analysis of DNA methylation variation in adipose tissue from twins reveals links to disease-associated variants in distal regulatory elements. Am J Hum Genet 93: 876-890.
- Ma B, Wilker EH, Willis-Owen SA, Byun HM, Wong KC, et al. (2014) Predicting DNA methylation level across human tissues. Nucleic Acids Res 42: 3515-3528.
- Talens RP, Boomsma DI, Tobi EW, Kremer D, Jukema JW, et al. (2010) Variation, patterns, and temporal stability of DNA methylation: considerations for epigenetic epidemiology. FASEB J 24:3135-3144.