Keywords
ABR; Depression; Biological marker; Therapy control; Diagnosis
Introduction
This study was undertaken to find electrophysiological effects of the influence of depression on the brain stem. Following depressive development and recovery will have a great value in clinical settings and for pharmacological (therapeutic) control.
Depression has a 25-40% life time prevalence, around 10 percent point prevalence [1]. It may be hereditary as part of MDS (Manic Depressive Syndrome), reactive to physical and psychological tension, secondary to somatic disorders, neurotic by characterological under-esteem of the self, or it may be stress induced - a reaction to overstrained activity or responsibility [2,3]. When a depressive state has developed to a certain level of illness, all types of depression show the same fundamental symptomatology as well as body-changes. Retardation of physiological and psychological processes develop. Mimic and motoric inhibition emerges, as do delusions of self-depreciation and guilt feelings with suicidal ideation and apathy. On the somatic side hormonal and physiological symptoms consist of e.g. anorexia, sleep and circadian rhythm disturbances [4]. Due to the seriousness and suicide danger of the illness it is imperative to assess a correct diagnosis and initiate an appropriate treatment. Biological markers for depression are rare. Leuchter et al. used QEEG to construct an Antidepressant Treatment Response index that foresaw an Escitalopram treatment reaction within 2-6 days [5]. Lithgow et al. showed an influence of depression on the brain stem by extracting data from EVestG i.e. electrical derivation of voltages from vestibular nucleus [6]. Similarly, Sköld et al. demonstrated higher ABR-waves III and VII plus thalamo-cortical aberrances related to affective disorder [7]. In view of results from other psychiatric disorders on the brain stem [Schizophrenia, ADHD (Attention Deficit Hyperactivity Disorder) and ASD (Autism Spectrum Disorder)] it would be supposed that depression might show ABR aberrances as well [8-13].
By comparisons between groups of healthy subjects and defined patient groups, researchers have validated ABR markers and made calculations of specificity and sensitivity for diagnostic groups. Highly significant and reciprocally exclusive differences may be defined as biological markers. Markers constitute a ground for operational categorization of an individual into a specific diagnostic group. There is a great need of reducing subjective influences and incorporating biological markers in diagnostic and therapeutic processes, especially in psychiatry [14].
The impetus to investigate ABR and depression also comes from the fact that Serotonins have an influence on the auditory sorting processing by direct connections of neurons from the raphae nuclei to diverse nuclei of the auditory pathway [15]. In preliminary ABR studies regarding depression, we could not find any significant group differences for depressive/healthy subjects by comparisons of amplitudes and latencies of the ABR waves I to VII. Some new algorithm for revealing further components of the ABR had to be tested. During long times of experimenting with ABRs, high frequency components embedded in the ABRs had been observed. They request a certain build up time to be stable and therefore the measurement must be preceded by an adapting period of stimulation. For this study a frequency of 3500 HZ was judged to be useful for comparisons as seen as represented in patients with depression.
Aims
This study is a search for a biological measure for the assessment of aspects of depression. The final goal is to get a measure that can be used clinically for diagnose and therapy control and is directed towards the effects of an anti-depressant substance as well. ABR measures will be used as dependent variables together with a clinically widely used rating scale (Montgomery Åsberg Depressive Rating scale, MADRS) [16]. The investigation was performed in two steps. First, one trait was sought for to demonstrate the depressive state as such. Secondly, a trait to differentiate individual differences, development and effect of a SSRI (Specific Serotonin Reuptake Inhibitor) was looked for.
Methods
Subjects and design
Twelve depressive women (23 to 55 years of age. Mean: 38 years, SD: 12 Years) from the outward of Karlstad psychiatric hospital in Sweden were recruited for the study. They were compared with a group of 41 age matched healthy females (HC) from a data base earlier brought together from several Swedish psychiatric outwards. The group was created by engaging consecutive patients searching for treatment of depression. Those with obvious clinical signs of depression with no other psychiatric diagnosis were included. Patients above 55 years and those with other simultaneous psychiatric diagnoses were excluded. During the recruiting time too few males could be listed for gender comparisons. Attitudes of men toward searching psychiatric help is very negative compared to women in this region.
Informed consent was signed, and ethical approval achieved, Diary Nr 2012-500, The Ethical Committee of Karlstad University Hospital, Sweden.
The depressive symptoms of the subjects were recorded by the application of Montgomery Åsberg Depression Rating scale. There were more rating scales used such as the Hamilton scale for depression but they have not been reported here in order to avoid excessive information. Standard clinical diagnostic procedure by chief physicians were performed to assess the diagnosis of clinical deep depression state [16]. Anti-depressive medication was prescribed with a dose of 10 raising to 20-40 mg of Citalopram. One patient got Mirtazapine in addition and one got it as exclusive medication (Table 1).
| heme Patient nr |
MADRS scores |
Week 0 |
Week 2 |
Week 4 |
| 1 |
25 |
Citalopram 10 mg 3 days, then 20 mg |
Citalopram 20 mg |
Citalopram 30 mg in the past 9 days |
| 2 |
32 |
Citalopram 20 mg |
Citalopram 30 mg |
Citalopram 30 mg |
| 3 |
39 |
Citalopram 10 mg3 days, then 20 mg |
Citalopram 30 mg |
Citalopram 30 mg plus Mirtazapine 30 mg in the past 7 days |
| 4 |
33 |
Citalopram 10 mg |
Citalopram 20 mg |
Citalopram 20 mg |
| 5 |
31 |
Citalopram 10 mg 3 days, then 20 mg |
Citalopram 20 mg |
Citalopram 20 mg |
| 6 |
33 |
Citalopram 10 mg 3 days, then 20 mg |
Citalopram 20 mg |
Citalopram 30 mg in the past 14 days |
| 7 |
33 |
Citalopram 20 mg |
Citalopram 20 mg |
Citalopram 40 mg |
| 8 |
29 |
Citalopram 20 mg |
Citalopram 20 mg |
Citalopram 30 mg in tha past 21 days |
| 9 |
40 |
Citalopram 30 mg |
Citalopram 20 mg |
Citalopram 40 mg |
| 10 |
34 |
Citalopram 10 mg 3 days, then 20 mg |
Citalopram 30 mg |
Citalopram 40 mg in the past 14 mg |
| 11 |
31 |
Citalopram 30 mg |
Citalopram 30 mg |
Mirtazapine 45 mg in the past 14 days |
| 12 |
23 |
Citalopram 20 mg |
Citalopram 40 mg |
40 mg |
Table 1: Displays the medication given each depressive subject during the 4-week long observation. The pertinent MADRS scores are to the left.
Measurements of auditory brain stem responses (ABR) were conducted on the first day, then after the first and the fourth week. At the same time points, new evaluations were made of the clinical status and the depression scales were applied again. Please observe that patient no 12 didn´t take part in all evaluations.
Stimulus and apparatus
Four different kinds of complex sound stimuli were used; standard broadband square-shaped click pulse (probe), high-pass filtered variant of the same, example of forward masking and one of backward masking (sounds patented). They are schematically displayed in Figure 1a and 1b.
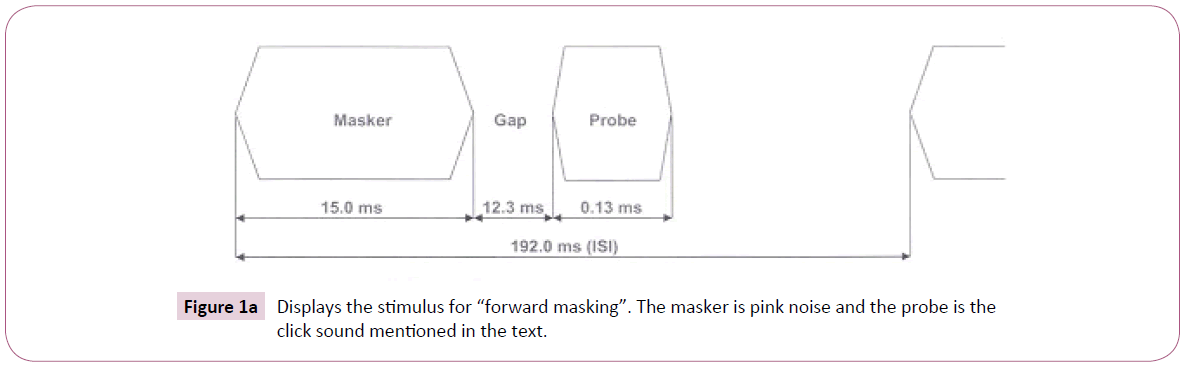
Figure 1a: Displays the stimulus for “forward masking”. The masker is pink noise and the probe is the click sound mentioned in the text.
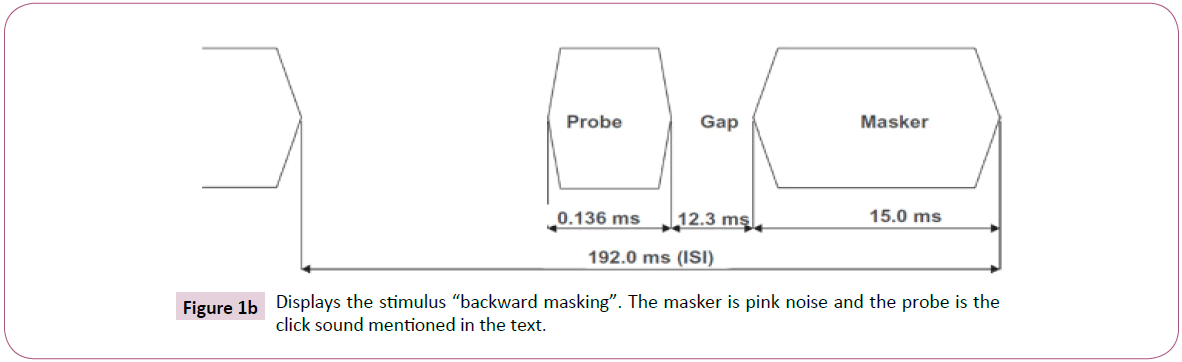
Figure 1b: Displays the stimulus “backward masking”. The masker is pink noise and the probe is the click sound mentioned in the text.
The click pulse has a duration time of 0.000136 s and a rise and fall time of 0.000023 s. The individual clicks of the stimulus train have a sound and inter stimulus interval (ISI) from onset to onset of 0.192 s. Backward and forward masking stimuli have time relations according to Figure 1. The stimuli were presented to the subjects with a sound pressure level (SPL) of 80 dB. TTL trigger pulses coordinated the sweeps with the auditory stimuli. The stimuli were repeated until a total of 1024 accepted evoked potentials for each ear had been collected. The stimuli were presented through SensoDetect Brainstem Evoked Response Audiometry® (SensoDetect, Lund, Sweden). The responses to the 1024 stimulus presentations of each sound were averaged. Aberrant activity, such as extremely high amplitudes due to extraordinary movements, was rejected. Sound levels were calibrated using a Bruel and Kjaer 2203 sound level meter and Type 4152 artificial ear (Bruel and Kjaer S&V Measurement, Naerum, Denmark). All stimuli were constructed using the MATLAB Signal Processing Toolbox (The MathWorks, Inc., Natick, MA, USA). Presentations were made both monaurally and binaurally with the stimuli in phase over headphones.
Testing procedure
All tests were performed in a quiet darkened room. Participants were comfortably seated in an armchair in a resting position. Surface electrodes were attached to the skin over the mastoid bones behind the left and right ear, with a ground electrode and a reference electrode placed on the vertex and forehead, respectively. Voltage was reorded between L/R mastoids and vertex. Before the test session, the procedure was fully explained to the test subject and the click sounds were presented beforehand to acquaint him/her with the stimuli. Absolute impedances and interelectrode impedance were measured before and after the experiments to verify that electrode contact was maintained (below 5000 Ω). The subjects were instructed to relax with their eyes closed and were permitted to fall asleep. The test required no active participation other than being subjected to sound stimulation. The subjects were tested one at a time and the duration of the testing procedure was 20 minutes.
Analysis
The analysis started with the study of correlations between different sinus / triangle waves and ABRs. Waves of 3500 HZ were chosen as they had given rise to sufficient magnitude of differences between healthy individuals and depressive subjects.
The ABRs were marked with 256 data points during the time-span of the total 10 msec. Correlations with the selected sinus wave of 3500 Hz were computed for all subjects. 25,6 (10/256) data points are positioned in each msec. In the same time span there are 3,5 cycles of the 3500 Hz tone. One cycle then has a duration of 1/3,5=0,29 msec. This means that 25,6 data points occur during one cycle (Hz) of 0,29 msec. The quotient 25,6/0,29 is 7,4, meaning that 7 ABRs beginning from these 7 points were checked for all subjects to obtain best phase match with the 3500 Hz frequency. The best match is in the following designated rmax.
Trait 1 was the result of the following calculations:
The BM sound was used as stimulus. The ABR of each patient and ear was consecutively correlated with 20 sinus waves and 3 triangle waves of different frequencies and rmaxs were extracted as described above. The resultant 2 x 23 rmax values from right and left ears were then correlated. This correlation is the Trait 1 value. Correlation values were extracted from each patient and merged over patients to represent the depressive group (median).
Trait 2 was achieved by means of the following operations:
All four complex sounds were used giving rise to 8 ABR-curves, one for each ear and individual. Each ABR-curve was correlated with a hard-coded sinus wave with fixed frequency (3500 Hz), and the starting point was varied to find rmax (see above). In this fashion 8 rmax values for each patient were produced. The median of these 8 values represents Trait 2.
Comparisons between the groups were then made. Each computation regarded the total ABR from 0-10 msec of the ABRs. When comparing the results, non-parametric statistical tests were applied due to the numbers not being normally distributed.
Mann Whitney Test was used for independent samples and Wilcoxon Pair Test for groups of same subjects measured at different times.
Results
Comparisons were made from the individuals of the depressive group and healthy subjects. All the curves had been scrutinized for best technical quality and all dubious ones were discarded and remade. The group of patients recovered significantly within 4 weeks. After 1 week there was a significant reduction in scores of MADRS (p=below 0,02) and Trait 2. The reduction remained significant to week four (from week 0 to 4) except for Trait 1. Between week 1 to week 4 there was no further significant reduction in any of the measures (Table 2 and Figure 2).
| ABR-traits for Depression |
Mann-Whitney test. Depressed patients/HC. No treatment N=12 |
Wilcoxon test p-value. Depressed patients after 1 week of treatment with Citalopram Week 0/week 1 N=11 |
Wilcoxon test p-value. Depressed patients treated with Citalopram daily. Week 0/week 4 N=11 |
Wilcoxon test p-value. Depressed patients treated with Citalopram Week1/week4 N=11 |
| TR1 |
<0.0001 *** |
0,1016 n.s. |
0,0537 n.s. |
0.8984 n.s. |
| TR2 |
<0.0002 *** |
0.0049 ** |
0.0020 ** |
0.7002 n.s. |
| |
|
|
|
|
| MADRS |
|
0.0020 ** |
0.0033 * |
0,1029 n. s. |
Note: Treatment results expressed as scores of MADRS and magnitude of trait 1 and 2 values.
Table 2: Shows the level of group differences between depressed patients and healthy controls. In Column 2-4 the changes until 4 weeks can be followed.
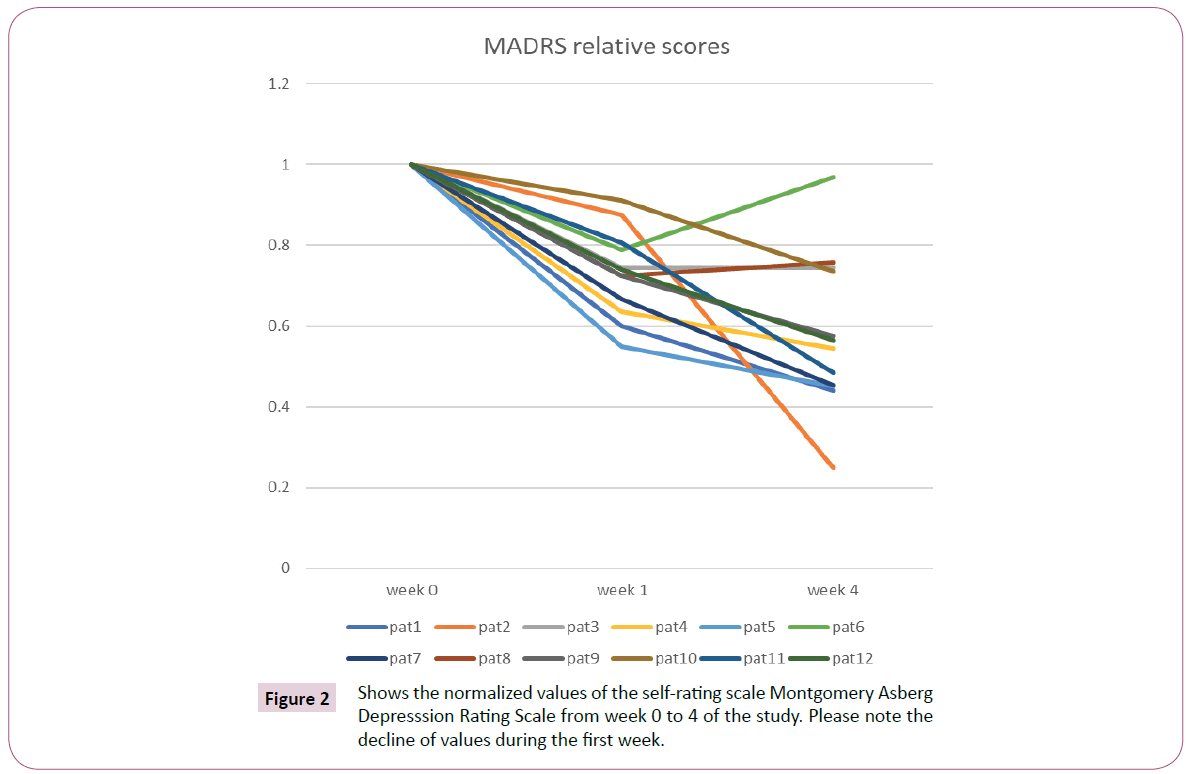
Figure 2: Shows the normalized values of the self-rating scale Montgomery Asberg Depresssion Rating Scale from week 0 to 4 of the study. Please note the decline of values during the first week.
Discussion
The depression confirmed by MADRS and clinical procedure was significantly consistent with objective ABR data. Trait 1 fulfilled the task to significantly separate the healthy group from the depressive one. The congruence between the change of Trait 2 and MADRS from week 0 to week 1 is important. In the future this decline could be of help to check for pharmacological success. It is also to be noted that it fulfills the primary aim of the study, namely, to reveal significant correlates between ABR data and depression.
From Table 3 comes forth that for Trait 1 medians of the rmaxs are higher than those for Trait 2. This is because Trait 1 measures similarities between the sides of the ears while Trait 2 reflects the content of the frequency 3500 Hz. Trait 1 was used only to separate depressive versus healthy groups but also as a surveillance control of the proceedings of the measurements. The correlation of the depressives is at the level of 0,6 and of healthy subjects only on 0,2. Normally there is a preference for right ear hearing resulting in right-left differences of the ABR supposedly contributing to the ABR difference [17]. Depression decreases mental activity and it may diminish sorting differences generally. Right left differences play a role for lateralized activity involved in directional hearing but also for elementary sorting for further complex processing at higher levels (e.g. in dichotic listening).
| Trait |
Group |
Median |
Mean ± SD |
Typical |
Specificity/ |
Power 90% for p=0,01 |
Kappa values between MADRS and Traits |
| rmax Depression/ |
rmax Depression/ |
depressive response/none |
Sensitivity |
Sample size; |
| rmax Healthy |
rmax Healthy |
Cutoff set by median of all subjects |
(%) |
N |
| TR1 |
Depression |
0,626 |
0,601 ± 0,155 |
10/2 |
83/83 |
10/group |
0,421W.0–1 |
| 0,298 w.1-4 |
| |
Healthy |
0,230 |
0,328 ± 0,164 |
12/29 |
|
|
|
| TR2 |
Depression |
0,149 |
0,148 ± 0,0173 |
11/1 |
78/92 |
12/group |
0.645 w.0-4 |
| 82% |
| |
Healthy |
0,111 |
0,114 ± 0,0281 |
9/32 |
|
|
|
Table 3: Some descriptive data from the study.
Trait 2 shows that the depressives have higher amount of 3500 Hz content than the group of healthy individuals. Trait 2 reflects the effects of the stimulating sounds on the ABR and the result indicates that, similarly, there is less involvement of 3500 Hz activity in healthy individuals. This frequency can be reproduced by the brainstem to depict a stimulus tone of this height. Proportionally, however, frequency analysis of high tones is not a primary matter in the present context by the auditory passway. Therefore, it is more plausible that the high frequency content reflects activities necessary for complex processing (synchronization, cross-correlation, feed-back etc.) A loss of precision in sound processing among depressive individuals might then let the 3500 Hz activity stand out clearer in them. Speculatively, it could be supposed that raised contents of high frequencies in auditory processing could be kind of redundant noise influence.
Trait 2 included all four sounds combined in the analysis to get better stability and differentiation compared to studying only one kind of stimulus. A slight overlap between healthy and depressive groups for Trait 1 but none within the Trait 2 of the SD-span ± 1 is seen in Table 3 col 4.
There is a need for still better differentiating power to make the method fit for clinical use. More research will be done on pin pointing levels of disturbances in the brain stem. That will request studying the variation of the traits with time. It will certainly give valuable information on the function of the brain stem but this is not within the scope of this study. Validation on larger samples need to be made as well as specificity studies regarding other psychiatric disorders. Such studies are eased by the following circumstances. Sensitivity and specificity are pretty good (Table 3 col 5,6) which facilitates coming clinical research work. A study - with the same method as here - showed significant differences between ADHD and healthy individuals [12]. The direction of the values was the same as in the present study (higher content of 3500 Hz in patients than healthy controls). Several of the other “traits” extracted in the present study (not shown), however, show an opposite direction of values between the groups. ADHD and depression (and healthy controls) can then be separated but other diagnostic groups have to be checked for validity as well. It is, of course, essential that there is as little overlapping with other disorders as possible to get best discriminative strength.
The statistical high power making small test groups applicable, is useful for cheaper and faster development of this method (Table 3 col.7). It may be further enhanced by changing the stimuli to incite reactions in specific serotonin/adrenalin regulating functions in the auditory pathway; and to go deeper in analysis - both phenomenologically and technically [15].
Finally, the Kappa values between MADRS and Trait 2 (Table 3 col. 8) mean a good to excellent congruence between the two. It may be stated that the present results are fully comparable to the MADRS rating technique. Their superior strength lies in the acquirement of the ABR which is impossible to subjectively influence [18] (Figure 3).
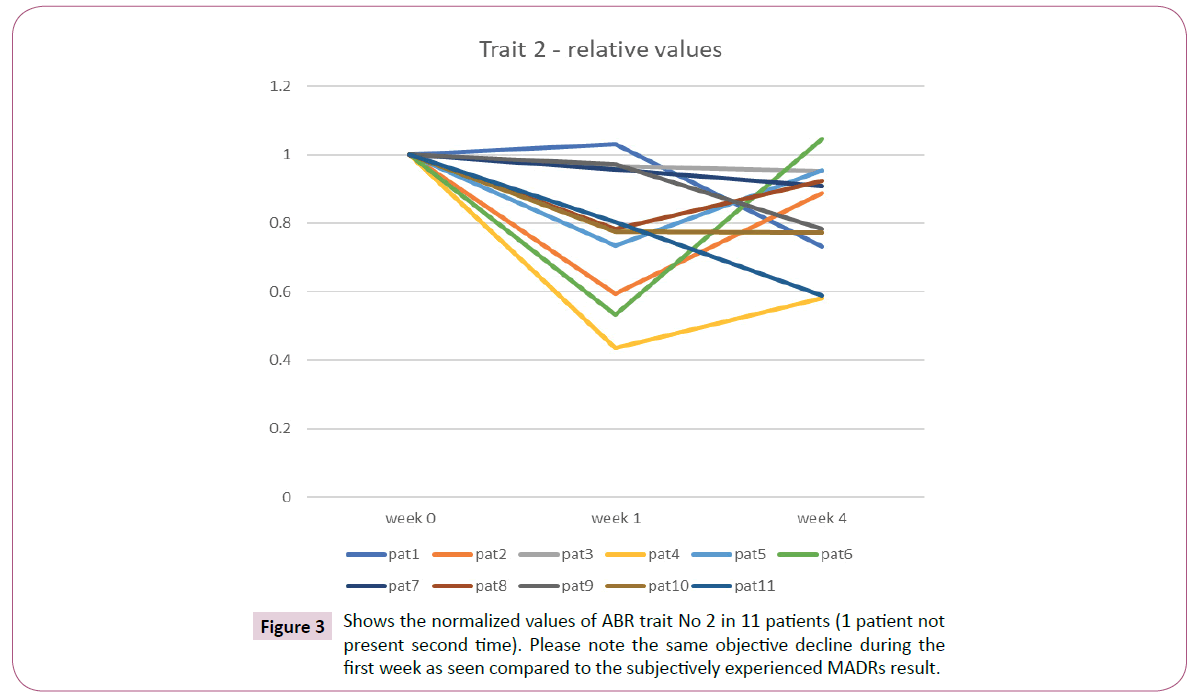
Figure 3: Shows the normalized values of ABR trait No 2 in 11 patients (1 patient not present second time). Please note the same objective decline during the first week as seen compared to the subjectively experienced MADRs result.
Conclusion
An electrophysiological marker for depression has been identified by this study. It separated depressive individuals from healthy ones with high statistical significance. By combining ABR results from several complex stimuli a second marker was constructed that made possible the detection of effects of treatment with Citalopram after only one week. The study is a starting point for further development which is commented upon in the discussion. The final goal is to achieve a method for diagnose and treatment control. An objective contribution for these ends in psychiatry would be of great value.
Acknowledgement
The authors would like to thank Dr Erik Jodal for a meticulous work in acquiring patients, conducting clinical surveillance, and performing the ABR measurements. We also thank M.Sc. Engineering, Joakim Larsson, for analytical work and stimulating discussions. For supporting equipment and technical support we thank CEO Johan Olsson of SensoDetect®.
Conflict of Interest
Jens Holmberg was earlier employed by SensoDetect®.
Johan Källstrand works as a consultant for the company.
Sören Nielzén is assistant professor at the psychiatric department of the Lund University. He holds shares of but is not employed by SensoDetect®.
References
- Marnane C, Iranpour C, Chey T, Jackson J W, Patel V, et al. (2014) The global prevalence of common mental disorders: a systematic review and meta-analysis 1980-2013. Int J Epidemiol 43: 476-493.
- Fried EI, Nesse RM (2015) Depression sum-scores don't add up: why analyzing specific depression symptoms is essential. World J Biol Psychiatry 16: 13-72.
- Sadock BJ, Sadock VA, Ruiz P (2017) Kaplan and Sadock's comprehensive textbook of psychiatry (10th Edn). Wolters Klüwer, p: 4997.
- Horowitz MA, Zunszain PA (2015) Neuroimmune and neuroendocrine abnormalities in depression: two sides of the same coin. Ann N Y Acad Sci 1351: 68-79.
- Leuchter AF, Cook IA, Gilmer WS, Marangell LB, Burgoyne KS, et al. (2009) Effectiveness of a quantitative electroencephalographic biomarker for predicting differential response or remission with escitalopram and bupropion in major depressive disorder. Psychiatry Res 169: 132-138.
- Lithgow BJ, Garrett AL, Moussavi ZM, Gurvich C, Kulkarni J, et al. (2014) Major depression and vestibulography. World J Biol Psychiatry 16: 334-350.
- Sköld M, Källstrand J, Nehlstedt S, Nordin A, Nielzén S, et al. (2014) Thalamocortical abnormalities in auditory brainstem response patterns distinguish DSM-IV bipolar disorder type I from schizophrenia. J Affect Disord 169: 105-111.
- Tarasenko MA, Swerdlow NR, Makeig S, Braff DL, Light GA (2014) The auditory brain-stem response to complex sounds; a potential biomarker for guiding treatment of psychosis. Front Psychiatry 5: 142.
- Källstrand J, Nehlstedt SF, Sköld ML, Nielzén S (2012) Lateral asymmetry and reduced forward masking effect in early brainstem auditory evoked responses in schizophrenia. Psychiatry Res 196: 188-193.
- Källstrand J, Olsson O, Nehlstedt SF, Sköld ML, Nielzén S (2010) Abnormal auditory forward masking pattern in the brainstem response of individuals with Asperger syndrome. Neuropsychiatr Dis Treat 6: 289-296.
- Nielzen S (2016) Towards a neurophysiologic support for diagnosis and therapeutic control in psychiatry. Acta Psychopathol 2: 27.
- Claesdotter-Hybbinette E, Safdarzadeh-Haghighi M, Råstam M, Lindvall M (2015) Abnormal brainstem auditory response in young females with ADHD. Psychiatry Res 229: 750-754.
- Juselius Baghdassarian E, Nilsson Markhed M, Lindström E, Nilsson BM, Lewander T (2017) Auditory brainstem response (ABR) profiling tests as diagnostic support for schizophrenia and adult attention-deficit hyperactivity disorder (ADHD). Acta Neuropsychiatr 30: 137-147.
- Fernandes BS, Williams LM, Steiner J, Leboyer M, Carvalho AF, et al. (2017) The new field of ‘precision psychiatry’. BMC Med 15: 80.
- Hurley LM, Hall IC (2011) Context-dependent modulation of auditory processing by serotonin. Hear Res 279: 74-84.
- Montgomery SA, Åsberg M (1979) A new depression scale designed to be sensitive to change. Br J Psychiatry 134: 382-389.
- Böhme G (1978) High tone audiometry I. Dominant sidedness of hearing (author's transl). HNO 26: 312-315.
- Mössner R, Mikova O, Koutsilieri E, Saoud M, Ehlis AC, et al. (2007) Consensus paper of the WFSBP Task Force on Biological Markers: biological markers in depression. World J Biol Psychiatry 8: 141-174.