Research Article - (2022) Volume 8, Issue 9
CO2 hydrogenation to methane over Zeolite promoted Ni/CeO2 Catalysts at Atmospheric Pressure
Abdullahi Isah*
Department of Science Laboratory Technology, Umaru Ali Shinkafi Polytechnic,Sokoto, Nigeria
*Correspondence:
Abdullahi Isah, Department of Science Laboratory Technology, Umaru Ali Shinkafi Polytechnic,Sokoto,
Nigeria,
Email:
Received: 02-Apr-2022, Manuscript No. IPIAS-22-12812;
Editor assigned: 05-Apr-2022, Pre QC No. IPIAS-22-12812(PQ);
Reviewed: 19-Apr-2022, QC No. IPIAS-22-12812;
Revised: 10-Oct-2022, Manuscript No. IPIAS-22-12812(R);
Published:
17-Oct-2022, DOI: 10.36648/2394-9988.9.12.101
Abstract
The zeolite promoted Ni/CeO2 catalysts were constructed via impregnation method and applied for conversion of CO2 to methane at atmospheric pressure for the first time. The influence of calcination temperatures and operation conditions (such as reaction temperature, Gas Hourly Space Velocity (GHSV), H2/CO2 ratio) were studied. The results uncovered that the non-promoted 10 wt% Ni/CeO2 catalyst showed %CO2 conversion and %CH4 selectivity (about 99% CO2 conversion and 35.5% CH4 selectivity) and the zeolite (2-8 wt%) promoted 10 wt% Ni/CeO2 catalysts recorded (about 99% CO2 conversion and 0-17.6% CH4 selectivity) at 350 atmospheric pressure, gas hourly space velocity (GHSV) of 72000 SmL (gcat h)-1 and the H2/CO2 ratio of 4. The zeolite promoter addition to 10 wt% Ni/CeO2 clearly and significantly reduced the % CH4 selectivity and this selectivity reduction is directly proportional to the quantity of the zeolite added. The physicochemical characterizations of the catalysts in terms of morphology, compositional phase, functional group, Brunauer Emmett Teller (BET) surface area (m2/g), total volume (m3/g), mesoporous volume (m3/g), average pore diameter (A), Ni metal surface area, average crystallite size (nm) were carried out with Scanning Electron Microscope (SEM), X-Ray Diffract meter (XRD), Fourier Transform Infrared spectrophotometer (FTIR), Brunauer Emmett Teller surface area analyzer, Debye-Scherrer equation, BJH method.
Keywords
CO2 methanation; Zeolite promoter; Ni/CeO2 based catalysts
Introduction
As a result of the growing human population and their
activities, the use of fossil fuels is dramatically increasing
consequently the proportion of the atmospheric carbon
dioxide is rising continuously [1-4]. Considering Carbon
Dioxide (CO2) a chief greenhouse gas (GHG) hence one of the
main agents of global warming and a key player to climate
change [5,6]. Nowadays became one of the dominants
environmental concerns of the present century faced by
human race [7,8]. As such, there is an urgent universal
demand to arrest the global warming caused by the
accumulation of carbon dioxide in the atmosphere thereby providing lasting solutions to this issue [9]. Therefore, one of
the encouraging techniques to mitigate anthropogenic CO2 from the atmosphere is carbon capture utilization and this
makes the area an interesting for the researchers [10].
Catalytic hydrogenation of carbon dioxide has been
investigated as one of the suitable approaches for the
recycling of CO2 to valuable substances especially when
hydrogen is readily available from the renewable sources such
as hydrolysis of water [11-16]. The Sabatier reaction known as
methanation reaction found to be one of the suitable catalytic
hydrogenation of carbon dioxide. This methanation reaction
as reported in the equation (1) and (2) is a process in which
methane is generated from hydrogen and carbon dioxide or Carbon monoxide (CO) or even CO2/CO mixture and the key
component for this process is found to be the catalysts design.
Recently, numerous methanation catalysts such as Co, Fe, Mo,
Ni and Ru dispersed over support ZrO2, TiO2, SiO2, CeO2 and
Al2O3 due to their high catalytic activity and selectivity as such
have gotten considerable attention [17].
CO2(g)+4H2(g)→CH4(g)+2H2O(g)(ΔH298=−165 kj/mol) (1)
CO(g)+3H2(g)→CH4(g)+H2O(g)(ΔH298=−206 kj/mol) (2)
This paper reported the addition of zeolite promoter to the 10
wt% Ni/CeO2 and 10 wt% Ni/Al2O3 catalysts and evaluated for
CO2 hydrogenation to methane at atmospheric pressure for
the irst time. The support (ceria) and promoter (zeolite) used
in this work have relative lower cost compared to support
(alumina) used in the commercial catalyst as such, using ceria
as a support and incorporation of such zeolite promoter will
signi icantly reduce the cost of the catalyst production and
expect to have better catalytic performance and catalytic
stability than the commercial catalyst.
Materials and Methods
Analytical grade ≥ 99% nickel nitrate hex hydrate (Merck), 98%
aluminium oxide (Sigma Aldrich), 98% cerium dioxide (Sigma
Aldrich), 98% zeolite (Sigma Aldrich) and distilled water
produced using Sartorius 61316 and 611 UV ultrapure water
system (UK) were used for the synthesis of the catalysts.
Liquid CO2 (>99.99%), 10% CH4 in Ar (>99.99%) and H2 (>99.99%) all purchased from from Linde Group company
were used for the catalytic reaction.
Synthesis of Catalysts
The catalysts of non-promoted 10 wt% Ni/CeO2 (NC) and 10
wt% Ni/CeO2 promoted with various zeolite weight
percentage (NZC-X) were synthesized via impregnation
method. The Ni/CeO2/zeolite weight percentage is 10/90/0
for NC, the concentration of Ni is ixed at 10 wt% where X
varied (2-8 wt%). Brie ly, for NC and NZC-X catalysts, 0.99 g Ni
(NO3)2.6H2O was weighed and dissolved in 20 mL distilled
water to form an aqueous solution. Then 1.80 g of cerium (IV)
oxide (ceria) for NC, 1.76 g of cerium (IV) oxide (ceria) and
0.04 g of zeolite for NZC-2 was added slowly with constant
stirring to the aqueous solution. The obtained slurry was dried
at 110°C in an oven for 12 hours. All the dried catalyst
samples were mixed thoroughly and then calcined in a muffle
furnace at 400°C for 4 hours. Only NC was further calcined at
different temperatures (350-500°C) for calcination
experiments.
Characterization of the Catalysts
The determination of the structural morphology of each
catalyst was carried out using Scanning Electron Microscope
(SEM). Each catalyst was coated with a thin layer of gold by a
sputter coater and then examined at an accelerating voltage
of 40 kV with JSM-6510 SEM (JEOL Ltd). The X-Ray Diffraction
(XRD) analysis of the catalysts was determined using an ARL
X’TRA X-ray Diffract meter (thermo scienti ic) at a scanning speed 12°/minute over the 2θ range of 20-70°. The XRD was
operated with a Ni filtered Cu Ka radiation source at 40 kV
and 40 mA. The identification of the compositional phases
was carried out by comparing with the Joint Committee on
Powder Diffraction Standards (JCPDS). The average size (μm)
of the catalysts was 54 obtained from the SEM images using
image application. The crystallite size of the catalysts (D) was
calculated using the XRD data and the Scherer’s equation [18].
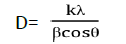
where, K is the shape factor (0.94), λ is X-ray wavelength
(0.154 nm), β is the line broadening at half the maximum
intensity in radians (FWHM), and θ is Bragg angle. Fourier
transform infrared (FT-IR) spectra were recorded in the
wavelength range of 400-4000 cm-1 using an IR prestige-21 FTIR
Spectrophotometer (Shimadzu). The Brunauer Emmett
Teller (BET) surface area, total pore volume, Mesoporous
volumes, average pore diameter and the Ni metal surface area
determined by AutoSorb-6iSA instrument
(Quanta chrome) at -196°C using N2 adsorption-desorption
measurements.
Catalytic Testing
The catalytic performance of each catalyst was studied under
atmospheric pressure in a continuous low ixed bed reactor
with a catalytic bed of 5 mm (inner diameter) and 20 mm
length. The reactor was placed horizontally in a muffle furnace
equipped with a temperature control unit. The introduction of
all gases into the reactor were monitored and controlled by
calibrated mass low meters. Before the catalytic performance
test, 250 mg of each calcined catalyst was sandwiched
between two layers of glass wool in the catalytic bed and then
pretreated (reduced) with pure hydrogen gas for 2 hours using
a total gas low of 100 mL/min with a heating rate of 10°C/min
up to 400°C and then cooled down to the speci ic
reaction temperature (250-450°C). A terwards, a mixture of H2 and CO2 gas with a molar ratio of 4 (H2:CO2) was introduced
into the reactor at a low rate of 300 mL/min, under
atmospheric pressure. A ter 1 hour of reaction the irst sample
was taken in duplicate.
The outlet gas samples were analyzed using Gas
Chromatography Mass Spectrophotometry (GCMS-TQ8040,
Shimadzu, Japan) equipped with a carboxen-1010 plot
capillary column (30 m × 0.32 mm, Supelco Sigma-
Aldrich).
Each of the reaction temperatures was maintained
for 30 minutes before the next temperature was
adjusted and each experiment was conducted in
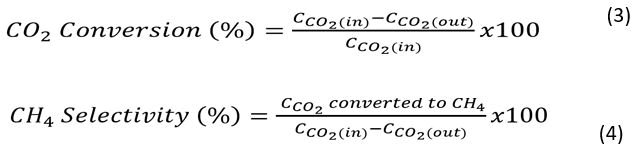
duplicate. The catalytic conversion and product selectivity
were calculated as follows using equation 3 and 4,
respectively Cco2 (mol.L-1s-1) and Cco2 (out) (mol.L-1s-1) where
are the concentrations of CO2 entering and exiting the
reactor respectively.
Based on the repeated experiments, the variability in the CO2 conversion and CH4 selectivity are estimated to be within ±
0.79% and ±7.7%, respectively.
Results and Discussion
Texture, Structure and Morphological Characteristics
Figure 1 illustrates the SEM images of the samples. The micrographs showed that the size of the smaller particles within the samples increased consistently from NC to NZC-8. This increase in small particle sizes could not be unconnected to the addition of zeolite promoter to Ni/CeO2. The NC exhibited a relative higher surface area in comparison to NC zeolite promoted catalysts.

Figure 1: SEM images of (A) NC; (B) NZC-2; (C) NZA-4; (D) NZA-8 catalysts claimed at 400°C.
The XRD patterns are displayed in Figure 2. The characteristic peaks at 2θ indicated that the 8 wt% of zeolite addition to Ni/CeO2 catalyst slightly shifted the NiO and CeO2 peaks to lower 2θ values. The 2θ values for NC are NiO (36.88, 43.13 and 62.63, JCPDS 22–1189) and CeO2 (28.38, 33.13, 47.19, 56.19, 58.88, 69.38, 76.88 and 79.06) while that of NZC-8 are NiO (36.75, 42.88 and 62.50) and CeO2 (28.25, 32.80, 47.13, 56.13, 58.75, 69.00, 76.56 and 79.00, JCPDS81-0792 which is clear indication that the higher zeolite content changed the lattice constant of the Ni/CeO2. Hence, the superior catalytic performance of NC can be attributed to the strong synergistic effects between finely dispersed NiO species and oxygen vacancies in CeO2. More so, the surface coverage by CO2 derived species on the CeO2 support contributed to the outstanding performance of NC. The Scherer’s equation gives the average crystallite size of 16.37 nm, 15.81 nm, 15.68 nm and 15.39 nm for NC, NZC-2, NZC-4 and NZC-8, respectively (Figure 2).

Figure 2: (A) XRD patterns of NC, NZC-2, NZC-4 and NZC-8 catalysts; (B) FTIR spectra of NC, NZC-2, NZC-4 and NZC-8 catalysts.
Figure 2 depicts the infrared absorption peaks of the samples. The obvious absorption peaks of zeolite at 3568 cm−1, 1689 cm−1 and 994 cm−1 are attributed to the structural O-H, physically absorbed water and bending vibration peaks of Si– O, respectively [19]. The broad band at 3335–3786 cm−1 in all the spectra is attributed to the stretching vibration of -OH. The peaks below 1000 cm−1 are related to metal oxides (NiO) from the interatomic vibrations. Bonds observed at 1435 and 1690 cm−1 corresponded to the physically adsorbed water molecule and hydroxyl group. The spectra of the zeolite promoted nano catalysts (NZC-2, NZC-4 and NZC-8) show the characteristic peak of zeolite (994 cm−1 ), with a slight displacement and decrease in intensity. The specific surface areas (BET), pore volumes and areas covered by the Ni metal of the samples are listed in Table 1. As obtained from the image software, all the samples have particles size below 100 nm with an average particle size of 47.52 nm, indicating a nano sized particle. In comparison with NC, specific surface areas of NZC-X obviously decreased. This is attributed to the integration of zeolite particles (with an average surface area of (m2/g)) on the NZC-X, resulting in increased particle dispersion and 200–700 nm porosity. Notably, both the pore volume and BET surface area of NZC-X exhibited a decreasing trend with increasing the zeolite concentration. This may be due to the gradual degradation of the zeolite structure during the calcination. Also, the slight decreased in crystallite sizes (XRD data) could also be due to the degradation of zeolite at calcinations of 400°C and can result in the decreasing trend of BET surface area (m2/g) and pores volume of NZC-X. The NC has the highest specific surface area (82.3 m3/g), consistent with its better catalytic performance than the 24 pore volume (0.273 cm) other nano catalysts (Table 1).
| Catalyst |
Code name |
BETa ( m2/g) |
Vtotal ab ( m3/g) |
Vmesoac ( m3/g) |
D (Aº)c |
Ni metal SA |
ACSd (nm) |
| Ni/CeO2 |
NC |
82.3 |
0.273 |
0.154 |
48.2 |
2.96 |
16.37 |
| Ni/2 wt% zeo/CeO2 |
NZC-2 |
73.5 |
0.141 |
0.094 |
56.8 |
2.43 |
15.81 |
| Ni/4 wt% zeo/CeO2 |
NZC-4 |
65.5 |
0.109 |
0.083 |
49.9 |
2.29 |
15.68 |
| Ni/10 wt% zeo/CeO2 |
NZC-8 |
56.4 |
0.093 |
0.071 |
28.9 |
1.85 |
15.39 |
D: Average pore diameter; VTotal: Total pore volume, Vmeso: Mesoporous volume,
a Determined by BET equation, b Determined by single point adsorption, c Determined by the BJH method, d Determined by Debye-Scheerer equation; ACS: Average Crystallite Size (nm); Ni metal SA: Ni metal surface area; zero=zeolite
Table 1: Textural characteristics of the Ni/CeO2 based catalysts claimed at 400°C.
The Influence of Reaction Temperature
The results shown in Figure 3 revealed that the reaction temperature did not have significance influence on the catalytic CO2 conversion. All the non-promoted 10 wt% Ni/CeO2 and zeolite promoted 10 wt% Ni/CeO2 catalysts (NC, NZC-2, NZC-4, NZC-8) showed very high (~99%) CO2 conversion percentage at the reaction temperatures tested (250-450°C). Such high CO2 conversion values were obtained with nickel supported ceria catalysts on previously reported in other study. The influence of the reaction temperature on CH4 selectivity was clearly observed in Figure 4. At low reaction temperatures up to 300°C, all the catalysts including NA showed a very low CH4 selectivity. The highest CH4 selectivity of 68% and 35.5% were achieved for NA and NC at 350°C respectively. When the reaction temperature was increased, NA sustained a similar CH4 selectivity at 400°C and 43% at 450°C, while CH4 selectivity decreased to almost zero at a temperature between 400-450°C for NC. The CH4 selectivity of all the zeolite promoted 10 wt% Ni/CeO2 (NZC-2, NZC-4 and NZC-8) were almost zero at reaction temperature of 250-300°C. At 350°C the selectivity was almost zero for NZC-8, 8% for NZC-2 and 17% for NZC-4. Similarly, at 400-450°C the NZC-4 and NZC-8 reported almost no CH4 formation, while NZC-2 exhibited 17.5% and 11.0% CH4 selectivity at 400 and 450°C respectively. There was no CO formation for any of the catalyst investigated at all the reaction temperatures tested, similar to what was observed elsewhere. It is obvious that the addition of zeolite does not promote the CH4 selectivity rather lower the selectivity. The lower CH4 selectivity reported by promoted catalysts might be due to the lower BET surface area (m2/g), Ni metal surface area (1.85-2.43 m2/g), total volume (0.093-0.141(56.4-C73.5 mm3/g) and meso volume (0.071-0.094 m3/g) when compared to that of NC (82.3 m2/g, 2.93 m2/g, 0.273 m3/g and 0.154 m3/g respectively) as shown in Table 1. The reduced CH4 selectivity as the proportion of zeolite increased might be connected with less availability of Ni metal surface area as well as consistent decreased in the BET surface area. Hence, the superior catalytic performance of NC can be attributed to the strong synergistic effects between finely dispersed NiO species and oxygen vacancies in CeO2. More so, the surface coverage by CO2 derived species on the CeO2 support contributed to the outstanding performance of NC. Despite the lowest BET surface area of 56.4 m2/g displayed by the NZC-8 still has a comparable CO2 conversion efficiency with NZC-4 and NZC-2 and this might be due to the fact that the relative higher oxygen storage capacities o f NZC-2 a nd NZC-4 i n CeO2 compensated their larger particle sizes.

Figure 3: Effect of reaction temperature on %CO2 conversion of the catalysts (NC, NZC-2, NZC-4, and NZC-8) under atmospheric pressure (1 atm), H2/CO2 ratio of 4, GHSV=72000 SmL (gcat.h)-1 and calcination temperature of 400°C.

Figure 4: Effect of reaction temperatures on %CH4, %CO selectivity of the catalysts (NC, NZC-2, NZC-4, NZC-8) under atmospheric pressure (1 atm), H2/CO2 ratio of 4, GHSV=72000 SmL(gcat.h)-1 and calcination temperature of 400°C.
The influence of calcination temperature and process parameters NC showed the highest methane selectivity, as such, further optimization experiments were conducted using NC. The results indicated that the CO2 conversion of NC was not influenced by the variations in the temperature at which the catalyst was calcined. Similarly, variation in H2/CO2 ratio and gas hourly space velocity did not affect the CO2 conversion percent as shown in Figure 5, respectively. Neither the reaction parameters nor the catalyst calcination temperatures tested showed any CO2 selectivity. The results in demonstrated similar CO2 conversion percentages for NC calcined at various temperatures between 350 and 500°C. Nevertheless, the calcination temperature influenced the methane selectivity of the catalyst. The highest CH4 selectivity of 35.3% was recorded when NC was calcined at 400°C. When higher calcination temperatures were used, there was a considerable reduction of methane selectivity to 20.5% at 450°C and 21.5% at 500°C. This higher selectivity for NC at calcination temperature 400°C is possibly due to the larger nickel dispersion as well as the formation of smaller NiO crystallite particles on CeO2. At higher calcination temperatures the Ni is expected to move to the bulk from the surface of the catalyst leading to a stronger Ni-CeO2 bond, hence adversely affecting the catalytic activity. When the H2/CO2 ratio was varied between 3 and 10, the CH4 selectivity of 35.5% was found to be optimum at the H2/CO2 ratio of 4 which is in line with the stoichiometric molar ratio of H2/ CO2 in the methanation reaction presented in equation 1. The lower or higher H2/CO2 ratio than 4 resulted in lower CH4 selectivity and this is mainly due to the fact that one reacting species (CO2 or H2) is limiting while the other in excess. The lowest GHSV of 72000 SmL (gcat h-1) selectivity. This is due to the fact that the contact time between the reacting gases and the catalyst surface is relatively long when compared to the higher GHSV tested. The longer contact time increased the effective collision between the reactants on the catalyst surface, hence resulting in the highest %CH4 selectivity. As such, to improve the single pass conversion it is necessary to maintain the optimum GHSV as any further increase or decrease in GHSV decreases the %CH4 selectivity (Figure 5).

Figure 5: The influence of calcination temperature on a) CO2 conversion %; b) CH4; CO selectivity (%) at H2/CO2 ratio of 4 and GHSV 72000 SmL (gcat h)-1. The influence of H2/CO2 ratio on; c) CO2 conversion %; d) CH4, CO selectivity (%) with calcination temperature of 400°C and GHSV 72000 SmL (gcat h)-1. The influence of GHSV on; e) CO2 conversion %; f) CH4, CO selectivity (%) with H2/CO2 ratio of 4 and calcination temperature of 400°C. All the experiments were conducted on 10 wt% Ni/CeO2 under atmospheric pressure and at a reaction temperature of 350°C.
Results and Discussion
Texture, Structure and Morphological Characteristics
Figure 1 illustrates the SEM images of the samples.
The micrographs showed that the size of the smaller
particles within the samples increased consistently from NC
to NZC-8. This increase in small particle sizes could not be
unconnected to the addition of zeolite promoter to Ni/CeO2.
The NC exhibited a relative higher surface area in comparison
to NC zeolite promoted catalysts.
Figure 1: SEM images of (A) NC; (B) NZC-2; (C) NZA-4; (D)
NZA-8 catalysts claimed at 400°C.
The XRD patterns are displayed in Figure 2. The characteristic
peaks at 2θ indicated that the 8 wt% of zeolite addition to
Ni/CeO2 catalyst slightly shifted the NiO and CeO2 peaks to
lower 2θ values. The 2θ values for NC are NiO (36.88, 43.13
and 62.63, JCPDS 22–1189) and CeO2 (28.38, 33.13, 47.19,
56.19, 58.88, 69.38, 76.88 and 79.06) while that of NZC-8 are
NiO (36.75, 42.88 and 62.50) and CeO2 (28.25, 32.80, 47.13,
56.13, 58.75, 69.00, 76.56 and 79.00, JCPDS81-0792 which is
clear indication that the higher zeolite content changed the
lattice constant of the Ni/CeO2. Hence, the superior catalytic
performance of NC can be attributed to the strong synergistic
effects between finely dispersed NiO species and oxygen
vacancies in CeO2. More so, the surface coverage by CO2 derived species on the CeO2 support contributed to the
outstanding performance of NC. The Scherer’s equation gives
the average crystallite size of 16.37 nm, 15.81 nm, 15.68 nm
and 15.39 nm for NC, NZC-2, NZC-4 and NZC-8, respectively
(Figure 2).
Figure 2: (A) XRD patterns of NC, NZC-2, NZC-4 and NZC-8
catalysts; (B) FTIR spectra of NC, NZC-2, NZC-4 and NZC-8
catalysts.
Figure 2 depicts the infrared absorption peaks of the samples.
The obvious absorption peaks of zeolite at 3568 cm−1, 1689
cm−1 and 994 cm−1 are attributed to the structural O-H,
physically absorbed water and bending vibration peaks of Si–
O, respectively [19]. The broad band at 3335–3786 cm−1 in all
the spectra is attributed to the stretching vibration of -OH.
The peaks below 1000 cm−1 are related to metal oxides (NiO)
from the interatomic vibrations. Bonds observed at 1435 and
1690 cm−1 corresponded to the physically adsorbed water
molecule and hydroxyl group. The spectra of the zeolite
promoted nano catalysts (NZC-2, NZC-4 and NZC-8) show the
characteristic peak of zeolite (994 cm−1 ), with a slight
displacement and decrease in intensity. The specific surface
areas (BET), pore volumes and areas covered by the Ni metal
of the samples are listed in Table 1. As obtained from
the image software, all the samples have particles size below
100 nm with an average particle size of 47.52 nm,
indicating a nano sized particle. In comparison with NC,
specific surface areas of NZC-X obviously decreased. This is
attributed to the integration of zeolite particles (with an
average surface area of (m2/g)) on the NZC-X, resulting in
increased particle dispersion and 200–700 nm porosity.
Notably, both the pore volume and BET surface area of NZC-X
exhibited a decreasing trend with increasing the zeolite
concentration. This may be due to the gradual degradation
of the zeolite structure during the calcination. Also, the
slight decreased in crystallite sizes (XRD data) could also be
due to the degradation of zeolite at calcinations of 400°C
and can result in the decreasing trend of BET surface area
(m2/g) and pores volume of NZC-X. The NC has the highest
specific surface area (82.3 m3/g), consistent with its better
catalytic performance than the 24 pore volume (0.273 cm)
other nano catalysts (Table 1).
| Catalyst |
Code name |
BETa ( m2/g) |
Vtotal ab ( m3/g) |
Vmesoac ( m3/g) |
D (Aº)c |
Ni metal SA |
ACSd (nm) |
| Ni/CeO2 |
NC |
82.3 |
0.273 |
0.154 |
48.2 |
2.96 |
16.37 |
| Ni/2 wt% zeo/CeO2 |
NZC-2 |
73.5 |
0.141 |
0.094 |
56.8 |
2.43 |
15.81 |
| Ni/4 wt% zeo/CeO2 |
NZC-4 |
65.5 |
0.109 |
0.083 |
49.9 |
2.29 |
15.68 |
| Ni/10 wt% zeo/CeO2 |
NZC-8 |
56.4 |
0.093 |
0.071 |
28.9 |
1.85 |
15.39 |
D: Average pore diameter; VTotal: Total pore volume, Vmeso: Mesoporous volume,
a Determined by BET equation, b Determined by single point adsorption, c Determined by the BJH method, d Determined by Debye-Scheerer equation; ACS: Average Crystallite Size (nm); Ni metal SA: Ni metal surface area; zero=zeolite
Table 1: Textural characteristics of the Ni/CeO2 based catalysts claimed at 400°C.
The Influence of Reaction Temperature
The results shown in Figure 3 revealed that the reaction
temperature did not have significance influence on the
catalytic CO2 conversion. All the non-promoted 10 wt%
Ni/CeO2 and zeolite promoted 10 wt% Ni/CeO2 catalysts (NC,
NZC-2, NZC-4, NZC-8) showed very high (~99%) CO2 conversion percentage at the reaction temperatures tested
(250-450°C). Such high CO2 conversion values were obtained
with nickel supported ceria catalysts on previously reported in
other study. The influence of the reaction temperature on CH4 selectivity was clearly observed in Figure 4. At low reaction
temperatures up to 300°C, all the catalysts including NA
showed a very low CH4 selectivity. The highest CH4 selectivity
of 68% and 35.5% were achieved for NA and NC at 350°C
respectively. When the reaction temperature was increased,
NA sustained a similar CH4 selectivity at 400°C and 43% at
450°C, while CH4 selectivity decreased to almost zero at a
temperature between 400-450°C for NC. The CH4 selectivity
of all the zeolite promoted 10 wt% Ni/CeO2 (NZC-2, NZC-4 and
NZC-8) were almost zero at reaction temperature of
250-300°C. At 350°C the selectivity was almost zero for NZC-8,
8% for NZC-2 and 17% for NZC-4. Similarly, at 400-450°C the
NZC-4 and NZC-8 reported almost no CH4 formation, while
NZC-2 exhibited 17.5% and 11.0% CH4 selectivity at 400 and
450°C respectively. There was no CO formation for any of the
catalyst investigated at all the reaction temperatures tested,
similar to what was observed elsewhere. It is obvious that the
addition of zeolite does not promote the CH4 selectivity rather
lower the selectivity. The lower CH4 selectivity reported by
promoted catalysts might be due to the lower BET surface
area (m2/g), Ni metal surface area (1.85-2.43 m2/g), total
volume (0.093-0.141(56.4-C73.5 mm3/g) and meso volume
(0.071-0.094 m3/g) when compared to that of NC (82.3 m2/g,
2.93 m2/g, 0.273 m3/g and 0.154 m3/g respectively) as shown
in Table 1. The reduced CH4 selectivity as the proportion of
zeolite increased might be connected with less availability of
Ni metal surface area as well as consistent decreased in the
BET surface area. Hence, the superior catalytic performance
of NC can be attributed to the strong synergistic effects
between finely dispersed NiO species and oxygen vacancies in
CeO2. More so, the surface coverage by CO2 derived species
on the CeO2 support contributed to the outstanding
performance of NC. Despite the lowest BET surface area of
56.4 m2/g displayed by the NZC-8 still has a comparable CO2 conversion efficiency with NZC-4 and NZC-2 and this might be
due to the fact that the relative higher oxygen storage
capacities o f NZC-2 a nd NZC-4 i n CeO2 compensated their
larger particle sizes.
Figure 3: Effect of reaction temperature on %CO2 conversion of the catalysts (NC, NZC-2, NZC-4, and
NZC-8) under atmospheric pressure (1 atm), H2/CO2 ratio of
4, GHSV=72000 SmL (gcat.h)-1 and calcination temperature of
400°C.
Figure 4: Effect of reaction temperatures on %CH4, %CO
selectivity of the catalysts (NC, NZC-2, NZC-4, NZC-8) under
atmospheric pressure (1 atm), H2/CO2 ratio of 4, GHSV=72000
SmL(gcat.h)-1 and calcination temperature of 400°C.
The influence of calcination temperature and process
parameters NC showed the highest methane selectivity, as
such, further optimization experiments were conducted using
NC. The results indicated that the CO2 conversion of NC was
not influenced by the variations in the temperature at which
the catalyst was calcined. Similarly, variation in H2/CO2 ratio and gas hourly space velocity did not affect the CO2 conversion percent as shown in Figure 5, respectively. Neither
the reaction parameters nor the catalyst calcination
temperatures tested showed any CO2 selectivity. The results
in demonstrated similar CO2 conversion percentages for NC
calcined at various temperatures between 350 and 500°C.
Nevertheless, the calcination temperature influenced the
methane selectivity of the catalyst. The highest CH4 selectivity
of 35.3% was recorded when NC was calcined at 400°C. When
higher calcination temperatures were used, there was a
considerable reduction of methane selectivity to 20.5% at
450°C and 21.5% at 500°C. This higher selectivity for NC at
calcination temperature 400°C is possibly due to the larger
nickel dispersion as well as the formation of smaller NiO
crystallite particles on CeO2. At higher calcination
temperatures the Ni is expected to move to the bulk from the
surface of the catalyst leading to a stronger Ni-CeO2 bond,
hence adversely affecting the catalytic activity. When the
H2/CO2 ratio was varied between 3 and 10, the CH4 selectivity
of 35.5% was found to be optimum at the H2/CO2 ratio of
4 which is in line with the stoichiometric molar ratio of H2/
CO2 in the methanation reaction presented in equation 1.
The lower or higher H2/CO2 ratio than 4 resulted in lower
CH4 selectivity and this is mainly due to the fact that one
reacting species (CO2 or H2) is limiting while the other in
excess. The lowest GHSV of 72000 SmL (gcat h-1) selectivity.
This is due to the fact that the contact time between the
reacting gases and the catalyst surface is relatively long
when compared to the higher GHSV tested. The longer
contact time increased the effective collision between the
reactants on the catalyst surface, hence resulting in the
highest %CH4 selectivity. As such, to improve the single pass
conversion it is necessary to maintain the optimum GHSV
as any further increase or decrease in GHSV decreases the
%CH4 selectivity (Figure 5).
Figure 5: The influence of calcination temperature on a)
CO2 conversion %; b) CH4; CO selectivity (%) at H2/CO2 ratio
of 4 and GHSV 72000 SmL (gcat h)-1. The influence of H2/CO2 ratio on; c) CO2 conversion %; d) CH4, CO selectivity (%)
with calcination temperature of 400°C and GHSV 72000 SmL
(gcat h)-1. The influence of GHSV on; e) CO2 conversion %; f)
CH4, CO selectivity (%) with H2/CO2 ratio of 4 and calcination
temperature of 400°C. All the experiments were conducted on 10 wt% Ni/CeO2 under atmospheric pressure and at a
reaction temperature of 350°C.
Conclusion
All the catalysts investigated recorded significant CO2 conversion (>99%) at reaction temperature of 250-450°C. The
10% Ni/CeO2 catalyst recorded the highest CH4 selectivity of
35.3% at a reaction temperature of 350°C, which may be
attributed to the higher BET surface area, total volume, meso
volume as well as Ni metal surface area. While the zeolite
promoted catalysts exhibited lower CH4 selectivity in which
the catalyst with 8 wt% zeolite recorded almost 0% CH4 selectivity at all the reaction temperatures investigated. This
lower CH4 selectivity of the zeolite promoted catalysts may
not be unconnected with the decreased in the physical
characteristics of the catalysts (BET surface areas, total
volumes, meso volumes as well as Ni metal surface areas) and
decreased in the quantity of CeO2. The methane selectivity of
NC was reduced when the catalyst was calcined at a
temperature above 400°C. The reaction temperature of
350°C, H2/CO2 ratio of 4 and the GHSV of 72000 SmL (gcat
h)-1 were found to be the optimum conditions favoring the
highest methane selectivity. Ni/CeO2 shows potential as a low
cost catalyst and further optimization studies are required to
enhance the methane selectivity and stability.
Acknowledgement
The Ph.D. research of Abdullahi Isah was funded by the Tertiary
Education Trust Fund (TETFUND) provided by the Federal
Government of Nigeria. The authors thank Tarık Haydar from
the state laboratory based in Cyprus for helping with the Gas
Chromatography Mass Spectrometer (GC-MS) analysis of the
gas samples.
References
- Kharaji AG, Shariati A (2013) Performance of Co-Mo/Al2O3 Nano Catalyst for CAMERE Process in a Batch Reactor. Chem Biochem Eng Q. 27(3):275–278.
[Google Scholar]
- Li MMJ, Zeng Z, Liao F, Hong X, Tsang SCE (2016) Enhanced CO2 hydrogenation to methanol over CuZn nanoalloy in Ga modified Cu/ZnO catalysts. J Catal. 343(1):157-167.
[Crossref][Google Scholar][Indexed]
- Abanades JC, Alvarez D (2003) Conversion Limits in the Reaction of CO2 with Lime. Energy Fuels. 17(2):308–315.
[Crossref][Google Scholar][Indexed]
- Abu-Zahra MRM, Niederer JPM, Feron PHM, Versteeg GF (2007) CO2 Capture from Power Plants Part II. A Parametric Study of the Economic Performance based on Mono-Ethanolamine. Int J Greenh Gas Con. 1(1):135–142.
[Crossref][Google Scholar][Indexed]
- McCollum D, Bauer N, Calvin K, Kitous A, Riahi K (2014) Fossil resource and energy security dynamics in conventional and carbon-constrained worlds. Clim Change. 123(1):413–426.
[Crossref][Google Scholar][Indexed]
- Yannopoulos SI, Lyberatos G, Theodossiou N, Li W, Valipour M, et al. Evolution of water lifting devices (pumps) over the centuries worldwide. Water. 7(9):5031–5060.
[Crossref][Google Scholar][Indexed]
- Valipour M (2012) Comparison of surface irrigation simulation models: full hydrodynamic, zero inertia, kinematic wave. J Agric Sci. 4(12):1-4.
[Google Scholar][Indexed]
- Bansode A, Urakawa A (2014) Towards full one-pass conversion of carbon dioxide to methanol and methanol-derived products. J Catal. 309(1):66-70.
[Crossref][Google Scholar][Indexed]
- Bansode A, Tidona B, Von Rohr PR, Urakawa A (2013) Impact of K and Ba promoters on CO2 hydrogenation over Cu/Al2O3 catalysts at high pressure. Catal Sci Technol. 3(1):767-778.
[Crossref][Google Scholar][Indexed]
- Stangeland K, Kalai D, Li H, Yu Z (2022) CO2 methanation: The effect of catalysts and reaction Conditions. Energy Procedia. 105(1):2022–2027.
[Crossref][Google Scholar][Indexed]
- Yang C, Ma ZY, Zhao N, Wei W, Hu TD, et al. (2006) Methanol synthesis from CO2 rich syngas over a ZrO2 doped CuZnO catalyst. Catal Today. 115(1):222–227.
[Crossref][Google Scholar][Indexed]
- Li C, Yuan X, Fujimoto K (2014) Development of highly stable catalyst for methanol synthesis from carbon dioxide, Appl Catal. A: General. 46(1):306-311.
[Crossref][Google Scholar][Indexed]
- Jun K, Shen W, Lee K (1999) Concurrent Production of Methanol and Dimethyl Ether from Carbon Dioxide Hydrogenation: Investigation of Reaction Conditions Bull. Korean Chem Soc. 20:993-998.
[Crossref][Google Scholar][Indexed]
- Yu KM, Curcic I, Gabrielm J, Tsang SCE. Recent advances in CO2 capture and utilization. Chem Sus Chem. 1(11):893-899.
[Crossref][Google Scholar][Indexed]
- Turner J, Sverdrup G, Mann MK, Maness P, Kroposki B, et al. (2007) Renewable hydrogen production. Int J Energy Res. 32(5):379-407.
[Crossref][Google Scholar][Indexed]
- Gao J, Liu Q, Gu F, Liu B, Zhong Z, et al. (2015) Recent advances in methanation catalysts for the production of synthetic natural gas. RSC Adv. 5(1):22759-22776.
[Crossref][Google Scholar][Indexed]
- Patterson A (1939) The Scherrer Formula for X-Ray Particle Size Determination. Phys Rev J Arch. 939(56):978–982.
[Google Scholar][Indexed]
- Talkhoncheh SK, Haghighi M, Jodeiri N, Aghamohammadi S (2017) Hydrogen production over ternary supported Ni/Al2O3 clinoptilolite CeO2 nanocatalyst CH4/CO2 reforming: Influence of support composition. J Nat Gas Sci Eng. 46(1):699–709.
[Crossref][Google Scholar][Indexed]
- Oladipo AA, Vaziri R, Abureesh MA (2018) Highly robust AgIO3/MIL (Fe) nanohybrid composites for degradation of organ phosphorus pesticides in single and binary systems: Application of artificial neural networks modelling. J Taiwan Inst Chem Eng. 83(1):133–142.
[Crossref][Google Scholar][Indexed]
Citation: Isah A (2022) CO2 hydrogenation to methane over Zeolite promoted Ni/CeO2 Catalysts at Atmospheric Pressure. Int J
Appl Sci Res Rev. 9:101.
Copyright: © 2022 Isah A. This is an open-access article distributed under the terms of the Creative Commons Attribution
License, which permits unrestricted use, distribution, and reproduction in any medium, provided the original author and source
are credited.