Research Article - (2024) Volume 21, Issue 1
Chronic Disease and Minimum Wage: Disparities in Diagnosis among Black and Hispanic Workers
Molly M Jacobs1* and
Lee Ann Johnson2
1Department of Health Services Research, University of Florida College of Public Health and Health Professions, USA
2Department Acute and Specialty Care, University of Virginia School of Nursing, USA
*Correspondence:
Molly M Jacobs,
Department of Health Services Research, University of Florida College of Public Health and Health Professions,
USA,
Email:
Received: 05-Feb-2024, Manuscript No. IPDEHC-24-19027;
Editor assigned: 07-Feb-2024, Pre QC No. IPDEHC-24-19027 (PQ);
Reviewed: 21-Feb-2024, QC No. IPDEHC-24-19027;
Revised: 26-Feb-2024, Manuscript No. IPDEHC-24-19027 (R);
Published:
04-Mar-2024, DOI: 10.35248/2471-8505-21.1.01
Abstract
Introduction: While the positive correlation between earnings and health outcomes is well-established, little is known about the relationship between minimum wages and health. Even though some counties and municipalities set minimum wages above the federally mandated level, the impact of these higher wages on the health of low wage workers is not clear.
Methods: Using the 2019 Selected Metropolitan/Micropolitan Area Risk Trends of the Behavioural Risk Factor Surveillance System this study examines the relationship between the number of chronic disease diagnoses and county-level minimum wages. Since insurance benefits, employment, and chronic disease outcomes are interdependent, and individual health endowments are unobserved, a structural equation modelling framework is used to model complex relationships between the county-level minimum wages and individual health, employment status, insurance, and chronic disease outcomes.
Results: Even after controlling for employment, insurance, and age, results indicate higher minimum wages are associated with fewer chronic disease diagnoses. Findings are robust to various model specifications and distributional assumptions. Likely a reflection of their higher chronic disease burden and increased likelihood earning low wage, the impact of wage on chronic disease is greater for Hispanic and African American workers than Whites.
Conclusion: Among historically oppressed populations, increases in the federally mandated minimum could improve chronic disease outcomes. Policy makers and labour advocates should consider health-related justifications in their efforts to lobby for higher federal, state, and local minimum wages.
Keywords
Chronic disease; Minimum wage; Health disparities; Diagnosis
Introduction
While the positive correlation between earnings and health outcomes is well-established, little is known about the relationship between minimum wages and health outcomes. In the United States, the minimum wage was created with passage of the Fair Labour Standards Act (FLSA) and defined as the lowest hourly amount that an employee could be paid for their labour. Though some counties and municipalities in the United States (US) set minimum wages above the federally mandated level, the influence of these higher wages on the health of low wage workers is not clear.
The Affordable Care Act mandated that employers with 50 or more full-time employees must provide health insurance to 95% of their full-time employees or pay a penalty (equal to $ 3,860 per employee per year in 2020). If workers are healthy, health coverage cost an employer roughly $ 3,000 annually. However, if the worker has 1 chronic condition, the cost increases to an average of $ 10,000. 7 chronic diseases-cancer, diabetes, hypertension, stroke, heart disease, pulmonary conditions, and mental illness-have a total impact on the economy of $ 1.3 trillion annually. Of this amount, $ 1.1 trillion represents the cost of lost productivity (Milken Institute Study: Chronic Disease Costs U.S. Economy More Than $ 1 Trillion Annually | Keeping Education ACTIVE | Partnership to Fight Chronic Disease, n.d.).
The Affordable Care Act increased the number of individuals with access to health insurance and higher minimum wages increase an individual’s overall income. These two factors may have the potential to help workers to either avoid developing or effectively manage chronic conditions. However, the relationship between individual health, minimum wages, insurance, and chronic conditions has not been well-defined. Among a nationally representative sample of US workers, this study utilizes county and state level variation in the minimum wage to examine the relationship between chronic conditions and local-level minimum wages.
Background
While the relationship between income and health has been well established-higher income is associated with improved health and better health outcomes-the relationship between the minimum wage and individual health outcomes remains unclear [1-5]. Minimum wage increases have the potential to not only increase wages for low-wage workers, but also to reduce their employment prospects. Some studies have shown that higher minimum wages are associated with improved health outcomes including (1) lower suicide rates, (2) cardiovascular disease, and (3) diabetes [6-12]. The directionality of findings, however, depends both on the specific subgroup analyzed and whether the analysis sample included both employed and unemployed workers [6,7,9,13-15]. Positive health outcomes are observed among experienced, employed workers while negative health outcomes are observed among those who are unemployed or out of the labor force [16].
Results investigating the relationship between both obesity and mental health have been mixed. Studies examining the association between higher minimum wages and obesity have shown that higher minimum wages are associated with both higher and lower obesity prevalence [6,9]. Similarly, research shows associations between the minimum wage and both positive and negative mental health outcomes [17,18]. Further studies are needed to determine why outcomes may vary.
In addition to employment status, minimum wage changes may also have a differential impact on women or workers from historically marginalized groups who are more likely to be low wage earners and earn hourly compensation. Whether these groups actually benefit from minimum wage changes, however, has not yet been determined [19,20]. As age advances, the likelihood of fair or poor health, psychological distress, obesity, and diabetes is higher for Blacks and Hispanics than Whites (National Center for Health Statistics (US), 2017). While women have a higher likelihood of obesity and psychological distress, men are more likely to develop diabetes (National Centre for Health Statistics (US), 2017).
While studies have shown that the net health effects from minimum wage changes are small, the long-term contribution of wages on health cannot be overlooked [21-24]. Thus far, published evidence has remained mixed on how minimum wage may affect health. In general, findings have shown higher minimum wage and health outcome improvements are related [6-10]. The relationship between health outcomes, health disparities, and minimum wage have not been thoroughly explored or definably established. Therefore, the motivation of this study was to assess the relationships more thoroughly between health, disparities, and minimum wage. Three primary determinants of health-access to healthcare, environmental exposures, and health behaviour-are fundamentally driven by income. This study will examine the relationship between micro- level variations in the minimum wage and the prevalence and age of onset of 13 major chronic conditions. Coupling data from a nationally representative sample of US workers with an investigator curated database of county-level minimum wages, this study assesses the association between minimum wage and diagnosis of 13 chronic conditions-cancer, Chronic Obstructive Pulmonary Disease (COPD), kidney disease, diabetes, asthma, stroke, obesity, arthritis, depression, angina, heart attack, hypertension, and hyperlipidemia.
The Study
Aims: A unique coupling of county and individual level data from 2019, this study examined the relationship between the number of chronic disease diagnoses and county-level minimum wage.
Design: To examine the relationship between chronic disease diagnoses and county-level minimum wages, accounting for the endogeneity of health and employment status, this study applied structural equation modelling (SEM) to 2019 cross sectional data.
Sample: The analysis sample included all individuals in the 2019 Behavioral Risk Factor Surveillance Survey (BRFSS) between the ages of 18 and 64.
Data
Data: Data for this study was combined from two primary sources-Economic Policy Institute (EPI) Minimum Wage Tracker and the 2019 BRFSS.
BRFSS Data: The BRFSS is a state-based telephone surveys of more the 400,000 respondents representing the non-institutionalized, adult population with a landline or cellular phone [25]. BRFSS contains information on individual health-related behaviors, health conditions, and use of health services. BRFSS, however, is based on self-reported information and cannot be validated with medical records [26]. BRFSS also collects data on emerging health issues like vaccine shortages, influenza, localized health information, public health conditions, local health responses, and use of local resources for health needs.
The Center for Disease Control and Prevention (CDC) analyzes BRFSS data for metropolitan and micro-politan statistical areas (MMSAs), to provide localized health information that can help public health practitioners to 1) identify local emerging health problems, 2) plan, 3) evaluate local responses, and 4) efficiently allocate resources to specific needs. The Selected Metropolitan/ Micropolitan Area Risk Trends of BRFSS (SMART BRFSS) uses BRFSS data to provide prevalence rates for selected conditions and behaviors for cities and their surrounding counties both small and large residential areas.
The Office of Management and Budget defines the MMSAs given that they contain “population nucleus…having a high degree of economic and social integration” [27,28]. The SMART BRFSS data set was produced by adding new raking weights designed to correspond to the 2019 population estimates for each eligible MMSA. Typically, BRFSS data are used to produce state-level estimates; however, for the SMART project, BRFSS data were used to produce small area-level estimates for MMSAs. To identify respondent county and MMSA, a county of residence name was collected from the respondent during the telephone interview. The name of the county was used to determine the corresponding American National Standards Institute county code; this code was retained as a variable in the data set and used to assign an MMSA. If a county was missing from a landline or cell phone data record, a county was imputed using a systematic imputations process. The full BRFSS is weighted using an iterative proportional fitting methodology that permits the introduction of additional demographic characteristics that more accurately match sample distributions to known demographic characteristics. Raking adjusts the estimates using the margins (raking control variables). The raking method iteratively applies a proportional adjustment to the weights of the cases that belong to the same category of the margin until a convergence to within a target percentage difference is achieved. To generate the MMSA weights in the SMART BRFSS, additional raking to 5 margins is applied to the BRFSS raked data set at the MMSA level.
EPI State/County minimum wages: 30 states and D.C. have increased their minimum wage to be higher than the federal minimum wage. Furthermore, 45 localities have adopted a minimum wage that is higher than their state minimum wage. Monthly, the Economic Policy Institute updates their Minimum Wage Tracker (EPI, 2021). This resource indicates state level minimum wages for 1) standard and tipped workers, 2) states whose wage is annually indexed for inflation, 3) states with no minimum wage, and 4) localities with minimum wages that differ from the state minimum wage. The 2019 EPI Tracker was used to identified which state and local minimum wages varied from the federal level and the identified state/county variations were found using Department of Labour archive of state minimum wage laws.
Data integration: SMART BRFSS provides MMSA codes for all survey respondents. To integrate information from 2019 SMART BRFSS with the 2019 EPI minimum wages, corresponding Federal Information Processing System (FIPS) and MMSA codes were determined using the 2019 Social Security Administration to FIPS Core-Based Statistical Area and MMSA County Crosswalk published by the National Bureau of Economic Research. This allowed for the connection of MMSA codes to county FIPS codes. Some MMSAs correspond to more than 1 county FIPS code, however, since the SMART BRFSS has a probability-weighted, stratified sampling framework, each respondent can only be included once for the MMSA weighting scheme to be valid. In these instances, respondents will be assigned to the county in which their MMSA of residence has the largest geographical representation.
Outcome variables: The totally number of chronic diagnoses was derived from Section 6 of the BRFSS questionnaire which captures information on individuals’ chronic diagnoses. Nonskin cancer, COPD, kidney disease, diabetes, asthma, stroke, obesity, arthritis, depression, angina, heart attack, hypertension, and hyperlipidemia were the only chronic conditions included in this section. However, these conditions constitute those most common and costly health conditions in the US. The BRFSS only captures condition diagnosis rather than condition severity. Since most chronic conditions can vary widely in severity and individuals with very mild conditions are not comparable to those with very severe conditions, this analysis elected to utilize a count variable representing an individual’s total number of chronic diagnoses. Used in other studies of population health, the number of chronic conditions provides an indication of an individual’s overall health, cost of healthcare, and level of functionality and independence [29].
Demographic characteristics: Sex (female), marital status (married), number of children in the household, age, race (Black), and ethnicity (Hispanic) are included as covariates in the analysis.
Health, employment, insurance, education: Four binary variables are created from the BRFSS data. First, an educational indicator is created for respondents who report having education equal to or above completion of a high school degree or equivalent. Next, an employment status indicator is created for respondents who report being either employed for wages of self-employed. Those who report being out of work as well as homemakers, students, and retirees are not considered to be employed. Similarly, a health coverage indicator is created for respondents who, at the time of the survey, report having any type of health coverage. Lastly, respondents who reported having excellent, very good or good health are considered healthy and those who report fair or poor general health are considered not healthy.
Household income: Respondents classify their annual household income from all sources into 1 of 5 categories: 1) Less than $ 15,000 2) $ 15,000 to less than $ 25,000 3) $ 25,000 to less than $ 35,000 4) $ 35,000 to less than $ 50,000 and 5) $ 50,000 or more. A binary indicator for “low income” was created from categories 1 and 2 to represent income below $ 25,000. A binary indicator for “high income” was created from category 5 to represent income above $ 50,000. Income groups 3 and found were considered “Middle Income” and used as the reference category.
Theoretical framework: We hypothesized workers who lived in lower minimum wage areas would experience an increased negative health outcome and for marginalized groups, an increase in health disparities. The relationship between work, health, health insurance, and wages is complex, multidimensional, and continually evolving. Not only do employees rely on employers as their providers of health insurance, but employers also rely on healthy employees for business operations [30]. It is rational to assume that healthy workers would be more productive and active members of the labour force while workers with poor health would be less productive and may choose to discontinue their labour market participation. Being less productive or leaving the labour force may be a choice out of the individual’s control. Since chronic conditions indicate poor health outcomes, workers with multiple chronic conditions could be less productive as a result. Poorly managed or severe chronic conditions can prevent individuals from entering the workforce. However, for most American workers, the likelihood of being diagnosed with a chronic condition is dependent on access to healthcare, which is contingent upon having health insurance. Worker characteristics such as age, build, and health status not only effect their willingness to work but also their productivity while at work and their ability to perform work-related duties [31]. Furthermore, those diagnosed with chronic conditions rate their health as worse, are less likely to be satisfied at work, and are less likely to work if given an alternative compared to those without chronic diagnoses [31-33]. The attributes that affect a worker’s productivity may be the result of personal behavioural and modifiable lifestyle choices, such as smoking, as well as the current and previous economic, social, and environmental conditions in which they live, work, learn, and age. Health diagnoses, the decision to work, and the provision of health benefits, may also be influenced by the provision of social safety net benefits or spousal/household circumstances. Minimum wage changes impact both employers and employees. Higher minimum wages may encourage individuals to enter the labour market or increase their current level of labour force participation while higher minimum wages may discourage employers from hiring additional workers due to their higher marginal cost. Figure 1 depicts one characterization of the relationship between chronic conditions, employment, health, and insurance. This simplistic rendering outlines the key elements and one interpretation of their interrelationships.

Figure 1: Study Framework
Ethical considerations: US government national survey data, such as the BRFSS is funded by the CDC. Participation in BRFSS is voluntary and individuals are not compensated for their participation. BRFSS has no individually identifiable information and does not qualify as human subjects research as defined by the Department of Health and Human Services. Data users are required to accurately report results, use provided population and/or group weights, and acknowledge the CDC in their publication or related research (Centers for Disease Control and Prevention (CDC). Behavioral Risk Factor Surveillance System Survey Questionnaire, 2022).
Analysis
To examine the relationship between chronic disease diagnoses and county-level minimum wages, two types of analysis were conducted. First, descriptive statistics examined the heterogeneity within the sample and statistically significant differences within and between groups. Second, given that insurance, chronic diagnoses, employment, and general health status are all measured with a degree of error, the hypothesized relationship between these interrelated factors is estimated using nonlinear SEM which allows for multiple endogenous variables within the system. SEM incorporates ideas from regression estimation, path-analysis, and factor analysis to enable the estimation of models that reflect hypotheses based on complex theory [34].
Assuming that the number of chronic conditions, employment, health, and insurance are endogenous while age, education, race, and the minimum wage are exogenous, the appropriate model specification was identified through an iterative process. In this process, a matrix of all possible combinations of exogenous and endogenous covariates was created. Each combination was estimated comparing the chi-square statistic and Root Mean Square Error of Approximation (RMSEA) across all specifications. Each estimation enhanced our understanding of this complex framework as we endeavored to examine the associations between minimum wage changes and chronic conditions [35]. Finally, the specification presented in Equation 1 was identified as the best fit model. All data analysis was done in R. SEM used the nleqslv and lavaan packages.
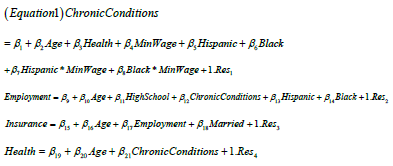
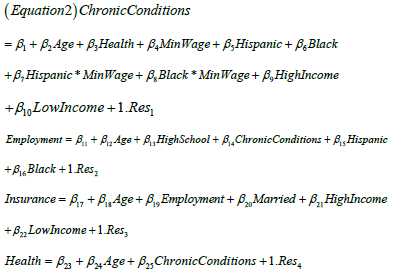
Since research has shown a strong relationship between household income and individual health, it is important to consider socioeconomic status in studies examining population health [36,37]. However, including both educational and income covariates in the regression model could introduce potential multicollinearity given the strong correlation between education and income [38]. Therefore, the system was first estimated without inclusion of income indicators (Equation 1) and re-estimated to include indicators of high-and low-income earners (Equation 2).
Sensitivity Analysis
Since a count variable indicating the total number of chronic diagnoses is unable to account for differences in severity, complications, or other associated health concerns, we performed two additional sensitivity analyses to test the robustness of the regression results [39]. First, the count of chronic diagnoses in Equation 2 was replaced with a binary indicator which equalled zero for those with no chronic diagnoses and one for those with at least one chronic diagnosis. This specification tested for differential minimum wage relationships between those with and without chronic diagnoses. Second, the relationship between minimum wages and heart attack, diabetes, obesity, stroke, and heart disease. These conditions were selected since they are widely regarded as the costliest to treat among the working-age population [40-42]. We acknowledge that these additional analyses do not replace the inclusion of condition severity in the existing model, but consistency between results found in these analyses and the original specification would support the findings.
Validity, Reliability, and Rigor
To ensure the reliability and consistency of the results presented, the outcome distributions of the outcome variables were tested to ensure appropriate distributional assumptions were met. Measurement stability within the sample was validated and empirical results were tested and retested against sample subsets to validate consistency of findings.
Results
Descriptive Statistics
Table 1 provides mean values for continuous and discrete variables and frequencies for categorical variables. Full sample values are provided in addition to those for the Black and Hispanic subgroups who comprise 11% and 14% of the sample, respectively (unweighted). Respondents are between 18 and 64 years old with an average age of 44 (SD=13.50). Blacks and Hispanics are slightly younger (Blacks: 43.82, SD=13.37; Hispanic: 39.67, SD=12.96) and these differences are statistically significant (Blacks: F=1.02, p=0.0746; Hispanics: F=1.07, p<0.001). A little over half of the sample is female (52%) and the average individual in the sample has (1) 2 chronic diagnoses (SD=1.71) and (2) was diagnosed with the first at age 45 (SD=13.15). Blacks, on average, have more chronic diagnoses (2.15, SD=1.80) and were first diagnosed at younger ages (43.73, SD=12.93)-both differences in age (F=1.04, p=0.0044)) and diagnoses (F=1.13, p<0.001) are statistically significant. Hispanics, on the other hand, have fewer chronic diagnoses (1.69, SD=1.61), but received their first chronic diagnoses at age 40 (SD=12.68)-both statistically significant (Diagnoses: F=1.14, p<0.001; Age at diagnosis: F=1.07, p<0.001).
Table 1: Sample and subgroup descriptive statistics and statistical differentials
| |
Full Sample |
Black |
Hispanic |
Test of Significant Black Differential |
Test of Significant Hispanic Differential |
| |
Mean Values |
F Stat |
P-Value |
F Stat |
P-Value |
| |
N |
Mean |
Std Dev |
Min |
Max |
N |
Mean |
Std Dev |
N |
Mean |
Std Dev |
|
|
|
|
| Chronic Conditions Count |
138528 |
1.93 |
1.71 |
0 |
13 |
15745 |
2.15 |
1.8 |
19510 |
1.69 |
1.61 |
1.13 |
<0.0001 |
1.14 |
<0.0001 |
| Min Age at Chronic Diagnosis |
111586 |
44.62 |
13.15 |
1 |
65 |
13295 |
43.73 |
12.93 |
15047 |
40.22 |
12.68 |
1.04 |
0.0044 |
1.07 |
<0.0001 |
| Age |
138528 |
44.15 |
13.5 |
18 |
64 |
15745 |
43.82 |
13.37 |
19510 |
39.67 |
12.96 |
1.02 |
0.0746 |
1.07 |
<0.0001 |
| Minimum Wage 2019 |
138527 |
9.36 |
1.3 |
7.25 |
16 |
15745 |
9.18 |
1.29 |
19509 |
9.16 |
1.41 |
1.02 |
0.2125 |
1.21 |
0.2301 |
| |
Frequency Values |
Chi-Square |
P-Value |
Chi-Square |
P-Value |
| Employed |
138528 |
70% |
0 |
0 |
0 |
15745 |
65% |
0 |
19510 |
65% |
0 |
223.95 |
<0.0001 |
329.09 |
<0.0001 |
| Has Health Insurance |
135219 |
88% |
0 |
0 |
0 |
15361 |
85% |
0 |
19203 |
71% |
0 |
114.46 |
<0.0001 |
5899.5 |
<0.0001 |
| Good Health |
138270 |
84% |
0 |
0 |
0 |
15705 |
80% |
0 |
19468 |
75% |
0 |
223.83 |
<0.0001 |
1289.1 |
<0.0001 |
| HS Education or Above |
138528 |
93% |
0 |
0 |
0 |
15745 |
92% |
0 |
19510 |
76% |
0 |
8.3333 |
0.0039 |
9841.2 |
<0.0001 |
| Female |
138528 |
52% |
0 |
0 |
0 |
15745 |
58% |
0 |
19510 |
54% |
0 |
2.2257 |
0.1101 |
1.5687 |
0.4022 |
| Married |
138528 |
51% |
0 |
0 |
0 |
15745 |
32% |
0 |
19510 |
41% |
0 |
2572.4 |
<0.0001 |
809.26 |
<0.0001 |
| ≥ 1 Chronic Diagnosis |
111601 |
81% |
0 |
0 |
0 |
13298 |
84% |
0 |
15054 |
77% |
0 |
172.23 |
<0.0001 |
167.79 |
<0.0001 |
| Angina |
3223 |
2% |
0 |
0 |
0 |
396 |
3% |
0 |
441 |
2% |
0 |
2.7749 |
0.0958 |
0.4391 |
0.5075 |
| Heart Attack |
3616 |
3% |
0 |
0 |
0 |
466 |
3% |
0 |
476 |
2% |
0 |
8.5328 |
0.0035 |
2.6004 |
0.1068 |
| Stroke |
3260 |
2% |
0 |
0 |
0 |
639 |
4% |
0 |
388 |
2% |
0 |
224.73 |
<0.0001 |
13.142 |
0.0003 |
| Obesity |
83598 |
60% |
0 |
0 |
0 |
10528 |
67% |
0 |
11745 |
60% |
0 |
315.41 |
<0.0001 |
0.2064 |
0.6496 |
| Diabetes |
11716 |
8% |
0 |
0 |
0 |
2044 |
13% |
0 |
1869 |
10% |
0 |
469.18 |
<0.0001 |
37.437 |
<0.0001 |
| Low Income |
10136 |
9% |
0 |
0 |
0 |
1880 |
15% |
0 |
3085 |
20% |
0 |
608.33 |
<0.0001 |
2674.8 |
<0.0001 |
| Middle Income |
36974 |
32% |
0 |
0 |
0 |
5612 |
43% |
0 |
8118 |
51% |
0 |
876.88 |
<0.0001 |
3217.4 |
<0.0001 |
| High Income |
68740 |
59% |
0 |
0 |
0 |
5454 |
42% |
0 |
4564 |
29% |
0 |
1788.4 |
<0.0001 |
6985.2 |
<0.0001 |
| Black |
138528 |
11% |
0 |
0 |
0 |
0 |
0 |
0 |
0 |
0 |
0 |
0 |
0 |
0 |
0 |
| Hispanic |
138528 |
14% |
0 |
0 |
0 |
0 |
0 |
0 |
0 |
0 |
0 |
0 |
0 |
0 |
0 |
About 70% of the sample is employed, with significantly lower percentages of Blacks (65%; χ2=223.95, p<0.001) and Hispanics (65%; χ2=329.09, p<0.001) reporting employment at the time of the survey. While 88% of the sample has health insurance, and 84% report being in good or excellent health, only 85% (χ2=114.46, p<0.001) of Blacks and 71% (χ2=5899.50, p<0.001) of Hispanics are insured with 80% (χ2=223.83, p<0.001) of Blacks and 75% (χ2=1289.11, p<0.001) of Hispanics reporting their health as good. The majority of respondents have a high school education (93%) and76% (χ2=9841.21, p<0.001) of Hispanics have achieved education beyond high school. Finally, 51% of those surveyed were married, however, this representation is slightly lower for Blacks (32%; χ2=2572.42, p<0.001) and Hispanics (41%; χ2=809.26, p<0.001). Only 9% of the full sample is low income, compared to 15% of Blacks (χ2=608.33, p<.0001) and 20% of Hispanics (χ2=2674.77, p<.0001). However, only 42% and 29% of Black and Hispanics, respectively, have income above $ 50,000 (χ2=1788.36, p<.0001; Hispanic χ2=6985.25, p<0.0001). In 2019, county level minimum wages ranged from $ 7.25 to $ 16.00 per hour with a national average minimum wage value of $ 9.36 (SD=1.30). County level wages were slightly lower for Blacks ($ 9.18, SD=1.29) and Hispanics ($ 9.16, SD=1.41) though these differences were not statistically significant (F=1.02, p=0.2125; F=1.21, p=0.2301).
Structural Equation Model Equation 1
Table 2 lists SEM estimation results from Equation 1. Model RMSEA (0.0881, p=0.139) suggests a reasonable approximate fit. The number of chronic conditions is positively correlated with age (β=0.3924, SE=0.0022) and insurance (β=0.0426, SE=0.0026) suggesting that the number of chronic diagnoses increases by 0.4 each year and that the likelihood of having insurance goes up each year. Both Blacks (0.0402, 0.0168) and Hispanics (β=0.0685, SE=0.0180) have comparatively more chronic conditions that other racial and ethnic groups, but these magnitudes are very small. The negative association between minimum wage and chronic conditions indicates that higher minimum wages are correlated with lower average number of chronic diagnoses (β=-0.0013, SE=0.0029). This value suggests that if the minimum wage increases by $ 1, the average number of chronic diagnoses would fall by 0.0013. Racial and ethnic minimum wage interaction terms indicate the effect of minimum wage variations on Blacks and Hispanics relative to other racial groups. In other words, these terms quantify the additional change in the number of chronic diagnoses experienced by these subgroups relative to other population groups. Blacks (β=-0.0168, SE=0.0180) and Hispanics (β=-0.0343, SE=0.0168) have even larger reductions in the number of chronic conditions. If the minimum wage increases by $ 1, the average number of chronic diagnoses among Blacks and Hispanics would both fall by 0.02 on average. Employment is positively associated with educational levels equal to or above high school graduation (β=0.1004, SE=0.0027) and older ages (β=0.0157, SE=0.0029). These results show that those with higher education are 1.1 (or roughly 10%) and those at older ages are 1.02 (or 2%) times more likely to be employed. However, Blacks (β=- 0.0324, SE=0.0026) and Hispanics (β=-0.0375, SE=0.0028) are 3% and 4% comparatively less likely to be employed that other racial and ethnic groups. Interestingly, the number of chronic conditions is negatively related to the relatively likelihood of employment (β=-0.2244, SE=0.0028) suggesting that relatively likelihood of employment declines as chronic diagnoses increase.
Table 2: SEM estimation chronic diagnoses, minimum wage, health, and insurance
| Chi-Square |
23355 |
P-Value |
0 |
| Root mean square error of approximation (RMSEA) |
0.088 |
P-value RMSEA ≤ 0.05 |
0.139 |
| |
|
Estimate |
Std Err |
t-Stat |
P-Value |
CIlower |
CIupper |
| Chronic Conditions |
Intercept |
-0.288 |
0.0234 |
-12.31 |
0 |
-0.334 |
-0.242 |
| Age |
0.3924 |
0.0022 |
174.45 |
0 |
0.388 |
0.3968 |
| Insured |
0.0426 |
0.0026 |
16.589 |
0 |
0.0375 |
0.0476 |
| Minimum Wage |
-0.001 |
0.0029 |
-4.401 |
0.0466 |
-0.07 |
-0.005 |
| Hispanic |
0.0402 |
0.0168 |
2.3915 |
0.0168 |
0.0072 |
0.0731 |
| Black |
0.0685 |
0.018 |
3.8049 |
0.0001 |
0.0332 |
0.1038 |
| Black* Minimum Wage |
-0.017 |
0.018 |
-6.933 |
0.0351 |
-0.052 |
-0.002 |
| Hispanic* Minimum Wage |
-0.034 |
0.0168 |
-2.049 |
0.0405 |
-0.067 |
-0.002 |
| Employed |
Intercept |
1.4205 |
0.0146 |
97.004 |
0 |
1.3918 |
1.4492 |
| Education ≥ HS |
0.1004 |
0.0027 |
36.832 |
0 |
0.0951 |
0.1057 |
| Chronic Conditions |
-0.224 |
0.0028 |
-79.49 |
0 |
-0.23 |
-0.219 |
| Age |
0.0157 |
0.0029 |
5.4225 |
0 |
0.01 |
0.0214 |
| Black |
-0.032 |
0.0026 |
-12.25 |
0 |
-0.038 |
-0.027 |
| Hispanic |
-0.038 |
0.0028 |
-13.52 |
0 |
-0.043 |
-0.032 |
| Insured |
Intercept |
2.2365 |
0.0119 |
187.81 |
0 |
2.2132 |
2.2599 |
| Age |
0.0873 |
0.0028 |
31.386 |
0 |
0.0818 |
0.0927 |
| Employed |
0.05 |
0.0028 |
18.129 |
0 |
0.0446 |
0.0554 |
| Married |
0.0993 |
0.0028 |
35.844 |
0 |
0.0938 |
0.1047 |
| Health |
Intercept |
2.6321 |
0.0093 |
282.54 |
0 |
2.6139 |
2.6504 |
| Age |
0.0404 |
0.0027 |
14.901 |
0 |
0.0351 |
0.0457 |
| Chronic Conditions |
-0.416 |
0.0025 |
-166 |
0 |
-0.421 |
-0.411 |
| Note: Indicates statistically significant α=0.05 |
Similarly, the relatively likelihood of being insured is positively associated with age (β=0.0873, SE=0.0028) suggesting that older individuals are 10% more likely than younger individuals to have health insurance. Most likely due to the provision of employer provided health benefits, individuals who are employed are relatively more likely to have health insurance than those who are not working or out of the labour force. Finally, married respondents (β=0.0993, SE=0.0028) have a 1.1 times higher likelihood of being insured that those who are not married. Finally, the relative likelihood of reporting good or excellent health is higher among individuals at older ages (β=0.0404, SE=0.0027), but relatively lower among those with higher number of chronic diagnoses (β=-0.4161, 0.0025). The relationships between the endogenous factors-chronic diagnoses, health, insurance, and employment-and the exogenous characteristics-age, race, ethnicity, marital status, and minimum wages-are outlined in Figure 2. While the direction and magnitude of these associations is not easily interpreted using this diagram, it provides evidence of the complexity of these interrelated factors and the multiple associations between them and individual characteristics. This figure indicates that simply increasing 1 factor or changing 1 individual characteristic is not guaranteed to change individual outcomes given numerous associations and influences acting simultaneously.

Figure 2: Vector Relationship for Total Chronic Diagnoses
Structural Equation Model Equation 2
Table 3 lists SEM estimation results from Equation 2 which adds indicators of high and low income to the previous model (Figure 3). Individuals earning high income have fewer chronic diagnoses (β=-0.178, 0.003) and those earning low income have more chronic diagnoses (β=0.093, 0.003) compared to middle income earners. When income indicators are included, neither the coefficient for Hispanic nor the minimum wage are significant in the model of chronic conditions. Therefore, Hispanics (β=-0.061, 0.018) do not, on average, have a significantly different number of chronic conditions that the rest of the sample and the average number of chronic conditions does not vary between areas having different minimum wage levels (β=-0.004, 0.003). However, Blacks (β=0.014, 0.019) do have a higher average number of chronic diagnoses than other racial and ethnic groups. The interaction effect between the minimum wage and Black (β=-0.090, 0.002) remains significant and indicates that Blacks who live in areas with higher minimum wage levels have a lower number of chronic diagnoses compared to Blacks living in other areas. Therefore, a $ 1 increase in the minimum wage corresponds to 0.1 fewer chronic diagnoses among Blacks. Income is also significantly related to the likelihood of having insurance. Individuals earning higher income (β=0.227, 0.003) are 25% more like to have insurance while those earning low income (β=-0.028, 0.003) are 3% less likely to have insurance compared to middle income earners.

Figure 3: Vector Relationship for Total Chronic Diagnoses with Income Indicators
Sensitivity Analysis
Table 4 lists the SEM estimation using a binary indicator of chronic diagnoses. Results show that on average, minimum wages (β=0.000, 0.003) are not significantly related to the likelihood of having at least one chronic diagnosis. However, as seen in the estimation of Equations 1 and 2, the effects among Blacks are significant. Compared to other racial and ethnic groups, Blacks (β=0.029, 0.021) are 1.03 times more likely to be diagnosed with a chronic condition. However, this likelihood is reduced among Blacks living in areas with higher minimum wages (β-0.010, 0.021). Results from models of the relationship between minimum wages and heart attack, diabetes, obesity, stroke, and heart disease are listed in Appendix (Tables 5-9). These results show that, on average, differences in the minimum wage levels do not have a significant impact on the likelihood of heart attack, heart disease, stroke, obesity, or diabetes diagnosis. However, they do show that among Blacks the relative likelihood of diagnosis is slightly lower in areas with a relatively higher minimum wage (Heart Attack 4.6%; Heart Disease 1.6%; Stroke 1.5%; Obesity 0.40%; Diabetes 0.20%).
Table 3: Full SEM estimation chronic diagnoses, minimum wage, health, and insurance
| Chi-Square |
92142 |
P-Value |
0 |
| Root mean square error of approximation (RMSEA) |
0.101 |
P-value RMSEA ≤ 0.05 |
0 |
| |
|
Estimate |
Std Err |
t-Stat |
P-Value |
CIlower |
CIupper |
| Chronic Conditions |
Intercept |
-0.132 |
0.025 |
-5.253 |
0 |
-0.181 |
-0.082 |
| Age |
0.399 |
0.002 |
168.24 |
0 |
0.394 |
0.403 |
| Insured |
0.067 |
0.003 |
23.873 |
0 |
0.061 |
0.072 |
| Minimum Wage |
-0.004 |
0.003 |
-1.358 |
0.174 |
-0.01 |
0.002 |
| Hispanic |
-0.061 |
0.018 |
-0.343 |
0.41 |
-0.095 |
-0.026 |
| Black |
0.014 |
0.019 |
7.424 |
0.001 |
0.002 |
0.051 |
| Black* Minimum Wage |
-0.09 |
0.002 |
-4.76 |
0.001 |
-0.698 |
-0.001 |
| Hispanic* Minimum Wage |
0.019 |
0.018 |
1.054 |
0.292 |
-0.016 |
0.053 |
| High Income |
-0.178 |
0.003 |
-60.25 |
0 |
-0.184 |
-0.172 |
| Low Income |
0.093 |
0.003 |
32.807 |
0 |
0.088 |
0.099 |
| Employed |
Intercept |
1.577 |
0.017 |
94.21 |
0 |
1.544 |
1.61 |
| Education ≥ HS |
0.088 |
0.003 |
29.712 |
0 |
0.082 |
0.094 |
| Chronic Conditions |
-0.229 |
0.003 |
-74.73 |
0 |
-0.235 |
-0.223 |
| Age |
-0.001 |
0.003 |
-0.167 |
0.867 |
-0.007 |
0.006 |
| Black |
-0.034 |
0.003 |
-11.89 |
0 |
-0.04 |
-0.028 |
| Hispanic |
-0.038 |
0.003 |
-12.61 |
0 |
-0.044 |
-0.032 |
| Insured |
Intercept |
2.28 |
0.014 |
168.45 |
0 |
2.253 |
2.307 |
| Age |
0.077 |
0.003 |
26.11 |
0 |
0.071 |
0.083 |
| Employed |
-0.013 |
0.003 |
-4.459 |
0 |
-0.019 |
-0.007 |
| Married |
0.018 |
0.003 |
5.628 |
0 |
0.012 |
0.024 |
| High Income |
0.227 |
0.003 |
71.79 |
0 |
0.221 |
0.233 |
| Low Income |
-0.028 |
0.003 |
-9.164 |
0 |
-0.034 |
-0.022 |
| Health |
Intercept |
2.694 |
0.01 |
260.3 |
0 |
2.674 |
2.715 |
| Age |
0.039 |
0.003 |
13.309 |
0 |
0.033 |
0.045 |
| Chronic Conditions |
-0.421 |
0.003 |
-155.2 |
0 |
-0.426 |
-0.415 |
| Note: Indicates statistically significant α=0.05 |
Table 4: SEM estimation binary chronic diagnosis indicator, minimum wage, health, and insurance
| Chi-Square |
58264 |
P-Value |
0 |
| Root mean square error of approximation (RMSEA) |
0.113 |
P-value RMSEA ≤ 0.05 |
0 |
| |
|
Estimate |
Std Err |
t-Stat |
P-Value |
CIlower |
CIupper |
| Chronic Conditions |
Intercept |
1.286 |
0.028 |
46.49 |
0 |
1.232 |
1.341 |
| Age |
0.243 |
0.003 |
87.35 |
0 |
0.238 |
0.248 |
| Insured |
0.034 |
0.003 |
11.28 |
0 |
0.028 |
0.039 |
| Minimum Wage |
0 |
0.003 |
0.145 |
0.885 |
-0.006 |
0.007 |
| Hispanic |
0.025 |
0.019 |
1.306 |
0.191 |
-0.013 |
0.063 |
| Black |
0.029 |
0.021 |
3.199 |
0.002 |
0.012 |
0.069 |
| Black* Minimum Wage |
-0.01 |
0.021 |
-4.071 |
0.016 |
-0.051 |
-0.005 |
| Hispanic* Minimum Wage |
-0.022 |
0.019 |
-1.13 |
0.258 |
-0.059 |
0.016 |
| High Income |
-0.045 |
0.003 |
-13.91 |
0 |
-0.052 |
-0.039 |
| Low Income |
0.011 |
0.003 |
3.639 |
0 |
0.005 |
0.017 |
| Employed |
Intercept |
1.582 |
0.018 |
89.88 |
0 |
1.547 |
1.616 |
| Education ≥ HS |
0.101 |
0.003 |
33.44 |
0 |
0.095 |
0.107 |
| Chronic Conditions |
-0.014 |
0.003 |
-4.542 |
0 |
-0.02 |
-0.008 |
| Age |
-0.087 |
0.003 |
-28.86 |
0 |
-0.093 |
-0.081 |
| Black |
-0.045 |
0.003 |
-15.48 |
0 |
-0.051 |
-0.04 |
| Hispanic |
-0.035 |
0.003 |
-11.46 |
0 |
-0.041 |
-0.029 |
| Insured |
Intercept |
2.306 |
0.013 |
171.1 |
0 |
2.28 |
2.332 |
| Age |
0.075 |
0.003 |
25.54 |
0 |
0.069 |
0.081 |
| Employed |
-0.029 |
0.003 |
-10.22 |
0 |
-0.035 |
-0.024 |
| Married |
0.018 |
0.003 |
5.653 |
0 |
0.012 |
0.024 |
| High Income |
0.23 |
0.003 |
73.08 |
0 |
0.224 |
0.237 |
| Low Income |
-0.032 |
0.003 |
-10.41 |
0 |
-0.038 |
-0.026 |
| Health |
Intercept |
2.927 |
0.011 |
258.5 |
0 |
2.905 |
2.95 |
| Age |
-0.098 |
0.003 |
-32.74 |
0 |
-0.104 |
-0.092 |
| Chronic Conditions |
-0.123 |
0.003 |
-41.13 |
0 |
-0.128 |
-0.117 |
| Note: Indicates statistically significant α=0.05 |
Table 5: SEM estimation heart attack diagnosis, minimum wage, health, and insurance
| Chi-Square |
55095.3 |
P-Value |
0 |
| Root mean square error of approximation (RMSEA) |
0.111 |
P-value RMSEA ≤ 0.05 |
0 |
| |
|
Estimate |
Std Err |
t-Stat |
P-Value |
CIlower |
CIupper |
| Heart Attack |
Intercept |
-0.169 |
0.028 |
-6.095 |
0 |
-0.223 |
-0.115 |
| Age |
0.126 |
0.003 |
43.181 |
0 |
0.121 |
0.132 |
| Insured |
0.004 |
0.003 |
1.296 |
0.195 |
-0.002 |
0.01 |
| Minimum Wage |
-0.001 |
0.003 |
-0.365 |
0.715 |
-0.008 |
0.005 |
| Hispanic |
-0.017 |
0.02 |
-0.868 |
0.386 |
-0.055 |
0.021 |
| Black |
0.053 |
0.021 |
2.52 |
0.012 |
0.012 |
0.095 |
| Black* Minimum Wage |
-0.047 |
0.021 |
-2.267 |
0.023 |
-0.088 |
-0.036 |
| Hispanic* Minimum Wage |
0.003 |
0.02 |
0.147 |
0.883 |
-0.035 |
0.041 |
| High Income |
-0.083 |
0.003 |
-24.956 |
0 |
-0.089 |
-0.076 |
| Low Income |
0.053 |
0.003 |
16.882 |
0 |
0.047 |
0.059 |
| Employed |
Intercept |
1.564 |
0.017 |
91.683 |
0 |
1.531 |
1.597 |
| Education ≥ HS |
0.095 |
0.003 |
31.651 |
0 |
0.089 |
0.101 |
| Heart Attack |
-0.095 |
0.003 |
-32.325 |
0 |
-0.1 |
-0.089 |
| Age |
-0.079 |
0.003 |
-26.88 |
0 |
-0.085 |
-0.073 |
| Black |
-0.045 |
0.003 |
-15.49 |
0 |
-0.051 |
-0.039 |
| Hispanic |
-0.036 |
0.003 |
-11.629 |
0 |
-0.042 |
-0.03 |
| Insured |
Intercept |
2.306 |
0.013 |
171.083 |
0 |
2.28 |
2.333 |
| Age |
0.075 |
0.003 |
25.531 |
0 |
0.069 |
0.081 |
| Employed |
-0.029 |
0.003 |
-10.209 |
0 |
-0.035 |
-0.024 |
| Married |
0.018 |
0.003 |
5.654 |
0 |
0.012 |
0.024 |
| High Income |
0.23 |
0.003 |
73.071 |
0 |
0.224 |
0.237 |
| Low Income |
-0.032 |
0.003 |
-10.425 |
0 |
-0.038 |
-0.026 |
| Health |
Intercept |
2.721 |
0.011 |
250.876 |
0 |
2.7 |
2.742 |
| Age |
-0.107 |
0.003 |
-36.963 |
0 |
-0.113 |
-0.101 |
| Heart Attack |
-0.168 |
0.003 |
-58.535 |
0 |
-0.174 |
-0.163 |
| Note: Indicates statistically significant α=0.05 |
Table 6: SEM estimation heart disease diagnosis, minimum wage, health, and insurance
| Chi-Square |
54633.2 |
P-Value |
0 |
| Root mean square error of approximation (RMSEA) |
0.111 |
P-value RMSEA ≤ 0.05 |
0 |
| |
|
Estimate |
Std Err |
t-Stat |
P-Value |
CIlower |
CIupper |
| Heart Disease |
Intercept |
-0.226 |
0.028 |
-8.135 |
0 |
-0.28 |
-0.171 |
| Age |
0.127 |
0.003 |
43.477 |
0 |
0.122 |
0.133 |
| Insured |
0.012 |
0.003 |
3.935 |
0 |
0.006 |
0.018 |
| Minimum Wage |
-0.001 |
0.003 |
-0.321 |
0.748 |
-0.008 |
0.006 |
| Hispanic |
0.093 |
0.02 |
4.725 |
0 |
0.054 |
0.131 |
| Black |
-0.022 |
0.021 |
-1.027 |
0.304 |
-0.063 |
0.02 |
| Black* Minimum Wage |
-0.016 |
0.021 |
-4.742 |
0.046 |
-0.058 |
-0.014 |
| Hispanic* Minimum Wage |
-0.099 |
0.02 |
-0.506 |
0.712 |
-0.137 |
-0.061 |
| High Income |
-0.068 |
0.003 |
-20.449 |
0 |
-0.074 |
-0.061 |
| Low Income |
0.049 |
0.003 |
15.602 |
0 |
0.043 |
0.056 |
| Employed |
Intercept |
1.553 |
0.017 |
90.982 |
0 |
1.519 |
1.586 |
| Education ≥ HS |
0.098 |
0.003 |
32.438 |
0 |
0.092 |
0.103 |
| Heart Disease |
-0.092 |
0.003 |
-31.447 |
0 |
-0.098 |
-0.086 |
| Age |
-0.079 |
0.003 |
-26.857 |
0 |
-0.085 |
-0.073 |
| Black |
-0.045 |
0.003 |
-15.574 |
0 |
-0.051 |
-0.04 |
| Hispanic |
-0.035 |
0.003 |
-11.319 |
0 |
-0.041 |
-0.029 |
| Insured |
Intercept |
2.305 |
0.013 |
170.964 |
0 |
2.278 |
2.331 |
| Age |
0.075 |
0.003 |
25.562 |
0 |
0.069 |
0.081 |
| Employed |
-0.029 |
0.003 |
-9.936 |
0 |
-0.034 |
-0.023 |
| Married |
0.018 |
0.003 |
5.652 |
0 |
0.012 |
0.024 |
| High Income |
0.23 |
0.003 |
73.016 |
0 |
0.224 |
0.236 |
| Low Income |
-0.032 |
0.003 |
-10.359 |
0 |
-0.038 |
-0.026 |
| Health |
Intercept |
2.72 |
0.011 |
250.463 |
0 |
2.699 |
2.742 |
| Age |
-0.108 |
0.003 |
-37.147 |
0 |
-0.113 |
-0.102 |
| Heart Disease |
-0.16 |
0.003 |
-55.4 |
0 |
-0.165 |
-0.154 |
| Note: Indicates statistically significant α=0.05 |
Table 7: SEM estimation stroke diagnosis, minimum wage, health, and insurance
| Chi-Square |
34855 |
P-Value |
0 |
| Root mean square error of approximation (RMSEA) |
0.11 |
P-value RMSEA ≤ 0.05 |
0 |
| |
|
Estimate |
Std Err |
t-Stat |
P-Value |
CIlower |
CIupper |
| Stroke |
Intercept |
-0.146 |
0.028 |
-5.246 |
0 |
-0.2 |
-0.091 |
| Age |
0.108 |
0.003 |
36.848 |
0 |
0.103 |
0.114 |
| Insured |
0.019 |
0.003 |
6.375 |
0 |
0.013 |
0.025 |
| Minimum Wage |
-0.004 |
0.003 |
-1.059 |
0.29 |
-0.01 |
0.003 |
| Hispanic |
-0.027 |
0.02 |
-1.378 |
0.168 |
-0.065 |
0.011 |
| Black |
0.008 |
0.021 |
3.733 |
0.047 |
0.003 |
0.049 |
| Black* Minimum Wage |
-0.015 |
0.021 |
-7.154 |
0.047 |
-0.056 |
-0.006 |
| Hispanic* Minimum Wage |
0.011 |
0.02 |
0.584 |
0.559 |
-0.027 |
0.05 |
| High Income |
-0.089 |
0.003 |
-26.798 |
0 |
-0.095 |
-0.082 |
| Low Income |
0.05 |
0.003 |
15.721 |
0 |
0.044 |
0.056 |
| Employed |
Intercept |
1.56 |
0.017 |
91.599 |
0 |
1.527 |
1.593 |
| Education ≥ HS |
0.096 |
0.003 |
32.059 |
0 |
0.09 |
0.102 |
| Stroke |
-0.107 |
0.003 |
-36.793 |
0 |
-0.113 |
-0.101 |
| Age |
-0.079 |
0.003 |
-27.048 |
0 |
-0.085 |
-0.074 |
| Black |
-0.042 |
0.003 |
-14.401 |
0 |
-0.048 |
-0.036 |
| Hispanic |
-0.035 |
0.003 |
-11.61 |
0 |
-0.041 |
-0.029 |
| Insured |
Intercept |
2.303 |
0.013 |
170.794 |
0 |
2.277 |
2.33 |
| Age |
0.075 |
0.003 |
25.599 |
0 |
0.069 |
0.081 |
| Employed |
-0.027 |
0.003 |
-9.546 |
0 |
-0.033 |
-0.022 |
| Married |
0.018 |
0.003 |
5.65 |
0 |
0.012 |
0.024 |
| High Income |
0.23 |
0.003 |
72.931 |
0 |
0.224 |
0.236 |
| Low Income |
-0.032 |
0.003 |
-10.276 |
0 |
-0.038 |
-0.026 |
| Health |
Intercept |
2.731 |
0.011 |
251.971 |
0 |
2.71 |
2.753 |
| Age |
-0.111 |
0.003 |
-38.457 |
0 |
-0.117 |
-0.105 |
| Stroke |
-0.155 |
0.003 |
-53.888 |
0 |
-0.161 |
-0.15 |
| Note: Indicates statistically significant α=0.05 |
Table 8: SEM estimation obesity diagnosis, minimum wage, health, and insurance
| Chi-Square |
53651.6 |
P-Value |
0 |
| Root mean square error of approximation (RMSEA) |
0.144 |
P-value RMSEA ≤ 0.05 |
0 |
| |
|
Estimate |
Std Err |
t-Stat |
P-Value |
CIlower |
CIupper |
| Obesity |
Intercept |
0.706 |
0.028 |
25.35 |
0 |
0.651 |
0.761 |
| Age |
0.162 |
0.003 |
55.808 |
0 |
0.156 |
0.168 |
| Insured |
0.024 |
0.003 |
7.977 |
0 |
0.018 |
0.03 |
| Minimum Wage |
-0.001 |
0.003 |
-0.361 |
0.718 |
-0.008 |
0.005 |
| Hispanic |
0.04 |
0.02 |
2.034 |
0.042 |
0.001 |
0.078 |
| Black |
0.067 |
0.021 |
3.223 |
0.001 |
0.026 |
0.108 |
| Black* Minimum Wage |
-0.004 |
0.021 |
-2.128 |
0.038 |
-0.045 |
-0.002 |
| Hispanic* Minimum Wage |
-0.002 |
0.019 |
-0.121 |
0.904 |
-0.041 |
0.036 |
| High Income |
-0.003 |
0.003 |
-0.766 |
0.444 |
-0.009 |
0.004 |
| Low Income |
-0.018 |
0.003 |
-5.725 |
0 |
-0.024 |
-0.012 |
| Employed |
Intercept |
1.535 |
0.017 |
88.939 |
0 |
1.501 |
1.569 |
| Education ≥ HS |
0.1 |
0.003 |
33.186 |
0 |
0.094 |
0.106 |
| Obesity |
0.043 |
0.003 |
14.485 |
0 |
0.037 |
0.049 |
| Age |
-0.098 |
0.003 |
-32.915 |
0 |
-0.104 |
-0.092 |
| Black |
-0.049 |
0.003 |
-16.595 |
0 |
-0.054 |
-0.043 |
| Hispanic |
-0.037 |
0.003 |
-12.017 |
0 |
-0.043 |
-0.031 |
| Insured |
Intercept |
2.309 |
0.013 |
171.34 |
0 |
2.282 |
2.335 |
| Age |
0.075 |
0.003 |
25.478 |
0 |
0.069 |
0.081 |
| Employed |
-0.031 |
0.003 |
-10.788 |
0 |
-0.037 |
-0.025 |
| Married |
0.018 |
0.003 |
5.655 |
0 |
0.012 |
0.024 |
| High Income |
0.231 |
0.003 |
73.197 |
0 |
0.225 |
0.237 |
| Low Income |
-0.033 |
0.003 |
-10.539 |
0 |
-0.039 |
-0.027 |
| Health |
Intercept |
2.809 |
0.011 |
254.079 |
0 |
2.788 |
2.831 |
| Age |
-0.118 |
0.003 |
-40.136 |
0 |
-0.124 |
-0.112 |
| Obesity |
-0.059 |
0.003 |
-20.053 |
0 |
-0.065 |
-0.054 |
| Note: Indicates statistically significant α=0.05 |
Table 9: SEM estimation diabetes diagnosis, minimum wage, health, and insurance
| Chi-Square |
33948 |
P-Value |
0 |
| Root mean square error of approximation (RMSEA) |
0.109 |
P-value RMSEA ≤ 0.05 |
0 |
| |
|
Estimate |
Std Err |
t-Stat |
P-Value |
CIlower |
CIupper |
| Diabetes |
Intercept |
-0.413 |
0.027 |
-15.241 |
0 |
-0.467 |
-0.36 |
| Age |
0.22 |
0.003 |
78.343 |
0 |
0.214 |
0.225 |
| Insured |
0.032 |
0.003 |
10.712 |
0 |
0.026 |
0.038 |
| Minimum Wage |
-0.003 |
0.003 |
-0.963 |
0.335 |
-0.01 |
0.003 |
| Hispanic |
-0.013 |
0.019 |
-0.697 |
0.486 |
-0.051 |
0.024 |
| Black |
0.047 |
0.021 |
2.276 |
0.023 |
0.006 |
0.087 |
| Black* Minimum Wage |
-0.002 |
0.021 |
-2.11 |
0.019 |
-0.038 |
-0.001 |
| Hispanic* Minimum Wage |
0.038 |
0.019 |
0.988 |
0.469 |
0.001 |
0.076 |
| High Income |
-0.103 |
0.003 |
-31.696 |
0 |
-0.109 |
-0.096 |
| Low Income |
0.043 |
0.003 |
13.958 |
0 |
0.037 |
0.049 |
| Employed |
Intercept |
1.53 |
0.017 |
89.554 |
0 |
1.497 |
1.564 |
| Education ≥ HS |
0.097 |
0.003 |
32.122 |
0 |
0.091 |
0.102 |
| Diabetes |
-0.11 |
0.003 |
-37.056 |
0 |
-0.116 |
-0.104 |
| Age |
-0.067 |
0.003 |
-22.217 |
0 |
-0.073 |
-0.061 |
| Black |
-0.039 |
0.003 |
-13.301 |
0 |
-0.045 |
-0.033 |
| Hispanic |
-0.031 |
0.003 |
-10.064 |
0 |
-0.037 |
-0.025 |
| Insured |
Intercept |
2.304 |
0.013 |
170.714 |
0 |
2.278 |
2.331 |
| Age |
0.075 |
0.003 |
25.563 |
0 |
0.069 |
0.081 |
| Employed |
-0.026 |
0.003 |
-9.063 |
0 |
-0.032 |
-0.02 |
| Married |
0.018 |
0.003 |
5.631 |
0 |
0.012 |
0.024 |
| High Income |
0.23 |
0.003 |
72.825 |
0 |
0.224 |
0.236 |
| Low Income |
-0.031 |
0.003 |
-10.173 |
0 |
-0.038 |
-0.025 |
| Health |
Intercept |
2.674 |
0.011 |
246.024 |
0 |
2.653 |
2.695 |
| Age |
-0.08 |
0.003 |
-27.395 |
0 |
-0.086 |
-0.074 |
| Diabetes |
-0.226 |
0.003 |
-79.246 |
0 |
-0.232 |
-0.221 |
| Note: Indicates statistically significant α=0.05 |
Discussion
The Federal minimum wage was established to serve as a floor below which wages for non-tipped workers could not fall. This ensured that workers would be paid a “fair wage for honest work” [43]. However, given inflationary pressures within the economy and a stagnant political system failing to increase wages since 2009, the federal minimal wage is not adequate to maintain a minimum standard of living [44]. Although the amount of the federal minimum wage has changed over the years by both political parties, the most recent change came in 2009, and today, the wage remains at $ 7.25 per hour. The laws that established the federal minimum wage gave states and localities the ability to establish a minimum wage that is above the federal wage. At this time, 29 states, D.C., and multiple localities have opted to increase minimum wage. Unfortunately, many states in the southern United States-such as Alabama, Georgia, Tennessee, Texas, and Louisiana-have opted for no increase to the minimum wage or have a minimum wage that is lower than the current federal wage. This is noteworthy because these states, located in what is often known as the Stroke Belt, Cancer Belt, or Diabetes Belt, experience worse health outcomes and health disparities compared to other parts of the country. Higher income overall has been associated with improved health outcomes [1-5]. Individuals with higher income typically have better access to high quality health care. In our study, we used the outcomes of (1) number of chronic conditions diagnosed and (2) age at fist chronic disease diagnosis to quantify the influence of minimum wage on chronic disease outcomes in Whites, Blacks, and Hispanics.
Findings from our study demonstrate, in a nationwide sample, when compared to Whites, Blacks are diagnosed with more chronic diseases and are diagnosed with chronic disease at an earlier age. This supports earlier findings [45]. Although Hispanic individuals were diagnosed with fewer chronic diseases compared to Whites and Blacks, the age at first diagnoses was lower than for Whites or Blacks [46,47]. At the intersection of chronic conditions, wage, and employment, Blacks and Hispanics reported lower levels of employment compared to Whites. This has also been consistently reported over time [48]. Employment Status of the Civilian Population by Race, Sex, and Age, 2022. Additionally, county level minimum wages were slightly lower for Blacks and Hispanics though this did not reach statistical significance. One reason to consider for this finding it the states that have high populations of Black and Hispanic individuals are also the states, typically in the South-Eastern United States, that maintain the federal minimum wage of $ 7.85. At the time of publication, most of these states did not have plans to increase minimum wage, therefore, in the future when more states enact higher minimum wages, additional exploration of this finding is warranted. Chronic disease, employment rate, insurance status, and good health were explored. While some findings were expected, such as a decline in good health as individual’s age, others were novel. These novel findings add to existing correlational literature. For example, although the rate of chronic disease increased with older age and for Blacks, finding suggest the rates of chronic disease declined when these individuals reside in counties with a higher minimum wage and had insurance. Furthermore, for both Blacks and Hispanics, the rates of chronic disease were even further reduced when living in a county with a higher minimum wage. Because an increase in both minimum wage and insurance coverage potentially reduces the gap in chronic disease diagnoses for Blacks and Hispanics, an increase in minimum wage should be considered in states with significant health disparities in minority populations. States in the southern United States, where minimum wage remains the lowest, should consider the connection between wages and chronic disease when making state level policy changes in minimum wage.
Results suggest that Blacks, Hispanics, and those with more diagnosed chronic diseases are less likely to be employed. Because in the United States insurance status is often tied to employment status, lower rates of employment potentially exclude some of the most vulnerable populations from acquiring insurance. This is especially problematic in states that did not pass the Affordable Care Act’s Medicaid expansion-the majority of which are located in the South-Eastern United States. Additionally, when the age at first diagnosis of a chronic disease is lower, the likelihood of employment decreases. For both Black and Hispanic populations, are 1st diagnosed with a chronic disease at a lower age when compared to Whites, the potential decrease in employment only serves to both further marginalize these vulnerable populations through decreased earnings and reduced opportunities for insurance coverage. Individuals who live an area with a higher minimum wage are more likely to diagnosed with a chronic disease later, and there is no difference in this later age at diagnosis between ethnic subgroups. Therefore, chronic diseases, access to healthcare, and health awareness are related and cannot be separated from earnings [47,49,50]. This also has mortality and productivity implications when you examine minimum wage heterogeneity across the US [51-53].
Limitations
Limitations should be considered when interpreting the results
of this study. For analysis, minimum wage data was used at the
county level and not at the census track level. This was a retrospective
secondary analysis; therefore, data was limited to what was available in each of the selected databases. The hourly
minimum wage in each county was used in this estimation.
However, this information does not capture all types of minimum
wage variations or all type of workers. For example, some
states set minimum wage levels for tipped, agricultural, seasonal,
or workers in particular industries whereas other states
may exempt them from minimum wage laws entirely. Only individual-
level and minimum wage data from 2019 was used for
the model estimation. Use of a single year of data limits the
scope of the results in several ways. The results only indicate
associations and cannot be used to infer causality. Additionally,
the role of various mediating and moderating factors cannot
be explicitly defined in a cross-sectional study. The study does
not account for other area-level factors that are relevant to
health, including community resources, economic conditions,
and local-area health infrastructure. Finally, because the data
is cross-sectional, we cannot analyse trends in health status,
minimum wage, insurance, and employment status over time.
Cross sectional data only allows us to characterize the association
between these characteristics and makes attribution of
causality impossible.
Conclusion
In conclusion, findings suggest Blacks and Hispanics, who live in
counties with a minimum wage that is higher than the federal
minimum wage, are diagnosed with their first chronic disease
later in life. Both employment status and insurance status influence
this finding. Further research that compares regions of
the country, such as those states in the Southeast with low minimum
wage and fewer health safety nets to states who have a
higher minimum wage and health safety nets, is needed. Policy
makers and labour advocates should consider health-related
justifications in their efforts to lobby for higher federal, state,
and local minimum wages and healthcare expansions.
Availability of Data and Materials
This study utilizes the Behavioural Risk Factor Surveillance System
(BRFSS). Centres for Disease Control and Prevention (CDC).
Behavioural Risk Factor Surveillance System Survey Questionnaire.
Atlanta, Georgia: U.S. Department of Health and Human
Services, Centres for Disease Control and Prevention, 2019.
Data can be found at https://www.cdc.gov/brfss/questionnaires/
index.htm
Funding
Lee Ann Johnson is an iTHRIV Scholar. The iTHRIV Scholars Program
is supported in part by the National Center for Advancing
Translational Sciences of the National Institutes of Health under
Award Numbers UL1TR003015 and KL2TR003016.
Authors Contribution
M.J. performed data work and empirical analyses. L.J. and M.J.
drafted the manuscript. L.J. contributed to the writing, interpretation,
and contextualization of findings. All authors reviewed
and edited the manuscript.
Acknowledgement
This manuscript utilized secondary data from Behavioural Risk
Factor Surveillance System (BRFSS) collected by the Centres for
Disease Control and Prevention (CDC). Data were used in accordance
with sections 308 (d) and 903 (c) of the Public Health
Service Act (42 U.S.C. 242m and 42 U.S.C. 299 a-1) and used
only for the purposes outlined therein. All respondents provide
acknowledgement of their consent to participate. This study
was conducted in accordance with the Declaration of Helsinki.
Conflict Of Interest
The authors have no competing interests to disclose.
References
- Backlund E, Sorlie PD, Johnson NJ (1996) The shape of the relationship between income and mortality in the united states. Evidence from the national longitudinal mortality study. Ann Epidemiol. 6(1):12-20.
[Crossref] [Google Scholar] [PubMed]
- Krieger N, Rehkopf DH, Chen JT, Waterman PD, Marcelli E, et al. (2008) The fall and rise of US inequities in premature mortality: 1960-2002. PLoS Med. 5(2):1-15.
[Crossref] [Google Scholar] [PubMed]
- Marmot M (2002) The influence of income on health: Views of an epidemiologist. Health Aff (Millwood). 21(2):31-46.
[Crossref] [Google Scholar] [PubMed]
- Muennig P, Franks P, Jia H, Lubetkin E, Gold MR (2005) The income-associated burden of disease in the United States. Soc Sci Med. 61(9):2018-2026.
[Crossref] [Google Scholar] [PubMed]
- Woolf SH, Braveman P (2011) Where health disparities begin: The role of social and economic determinants-and why current policies may make matters worse. Health Aff (Milwood). 30(10):1852-1859.
[Crossref] [Google Scholar] [PubMed]
- Andreyeva E, Ukert B (2018) The impact of the minimum wage on health. Int J Health Econ Manag. 18(4):337-375.
[Crossref] [Google Scholar] [PubMed]
- Du J, Leigh JP (2018) Effects of minimum wages on absence from work due to illness.
[Crossref] [Google Scholar]
- Leigh JP, De Vogli R (2016) Low wages as occupational health hazards. J Occup Environ Med. 58(5):444-447.
[Crossref] [Google Scholar] [PubMed]
- Paul Leigh J, Leigh WA, Du J (2019) Minimum wages and public health: A literature review. Prev Med. 118:122-134.
[Crossref] [Google Scholar] [PubMed]
- Van Dyke ME, Komro KA, Shah MP, Livingston MD, Kramer MR (2018) State-level minimum wage and heart disease death rates in the United States, 1980-2015: A novel application of marginal structural modeling. Prev Med. 112:97-103.
[Crossref] [Google Scholar] [PubMed]
- Dow WH, Godoy X, Lowenstein CA, Reich M (2019) Can economic policies reduce deaths of despair? working paper# 104-19. eScholarship. 1-41.
[Google Scholar]
- Lenhart O (2017) The impact of minimum wages on population health: Evidence from 24 OECD countries. Eur J Health Econ. 18(8):1031-1039.
[Crossref] [Google Scholar] [PubMed]
- Horn BP, Maclean JC, Strain MR (2017) Do minimum wage increases influence worker health? Econ Inq. 55(4):1-34.
[Crossref] [Google Scholar]
- Adams S, Blackburn M, Cotti C (2012) Minimum wages and alcohol-related traffic fatalities among teens. Rev Econ Stat. 828-840.
[Crossref] [Google Scholar]
- Hoke O, Cotti C (2016) Minimum wages and youth binge drinking. Empi Econ. 51(1):363-381.
[Crossref] [Google Scholar]
- Adams C, Meer J, Sloan C (2022) The minimum wage and search effort. Econ Lett. 212:110288.
[Crossref] [Google Scholar]
- Kronenberg C, Jacobs R, Zucchelli E (2017) The impact of the UK national minimum wage on mental health. SSM Popul Health. 3:749-755.
[Crossref] [Google Scholar] [PubMed]
- Reeves A, McKee M, Mackenbach J, Whitehead M, Stuckler D (2017) Introduction of a national minimum wage reduced depressive symptoms in low-wage workers: A quasi-natural experiment in the UK. Health Econ. 26(5):639-655.
[Crossref] [Google Scholar] [PubMed]
- Belman D, l Wolfson P, Nawakitphaitoon K (2015) Who is affected by the minimum wage? Ind Relat J. 55(1):187-187.
[Crossref] [Google Scholar]
- Pickett KE, Wilkinson RG (2015) Income inequality and health: A causal review. Soc Sci Med. 128:316-326.
[Crossref] [Google Scholar] [PubMed]
- Dube A, Lester TW, Reich M (2010) Minimum wage effects across state borders: Estimates using contiguous counties. Rev Econ Stat. 92(4):945-964.
[Crossref] [Google Scholar]
- Meer J, West J (2016) Effects of the minimum wage on employment dynamics. J Hum Resour. 51(2):500-522.
[Crossref] [Google Scholar]
- Neumark D, Wascher WL (2007) Minimum wages and employment. Foundations and Trends. 3(1-2):1-182.
[Crossref] [Google Scholar]
- Sabia JJ, Nielsen RB (2015) Minimum wages, poverty, and material hardship: New evidence from the SIPP. Rev Econ Househ. 13(1):95-134.
[Crossref] [Google Scholar]
- Erickson W, Smith AD (2009) User guide: A guide to disability statistics from the behavioral risk factors surveillance system. eCommons. 1-93.
[Google Scholar]
- Schneider KL, Clark MA, Rakowski W, Lapane KL (2012) Evaluating the impact of non-response bias in the behavioral risk factor surveillance system (BRFSS). J Epidemiol Community Health. 66(4):290-295.
[Crossref] [Google Scholar] [PubMed]
- Srebotnjak T, Mokdad AH, Murray CJ (2010) A novel framework for validating and applying standardized small area measurement strategies. Popul Health Metr. 8(1):1-13.
[Crossref] [Google Scholar] [PubMed]
- Deng G, Mao L (2018) Spatially explicit age segregation index and self-rated health of older adults in us cities. ISPRS Int J Geo Inf. 9(7):1-14.
[Crossref] [Google Scholar]
- Agborsangaya CB, Lau D, Lahtinen M, Cooke T, Johnson JA (2018) Health related quality of life and healthcare utilization in multimorbidity: Results of a cross-sectional survey. Qual Life Res. 22(4):791-799.
[Crossref] [Google Scholar] [PubMed]
- Buchmueller TC, Valletta RG (2017) Work, health, and insurance: A shifting landscape for employers and workers alike. Health Aff (Millwood). 36(2):214-221.
[Crossref] [Google Scholar] [PubMed]
- Dieker AC, IJzelenberg W, Proper KI, Burdorf A, Ket JCF, et al. (2019) The contribution of work and lifestyle factors to socioeconomic inequalities in self-rated health: A systematic review. Scand J Work Environ Health. 45(2):114-125.
[Crossref] [Google Scholar] [PubMed]
- Han KM, Ko YH, Yoon HK, Han C, Ham BJ, et al. (2018) Relationship of depression, chronic disease, self-rated health, and gender with health care utilization among community-living elderly. J Affect Disord. 241:402-410.
[Crossref] [Google Scholar] [PubMed]
- Marchiondo LA, Gonzales E, Williams LJ (2019) Trajectories of perceived workplace age discrimination and long-term associations with mental, self-rated, and occupational health. J Gerontol B Psychol Sci Soc Sci. 74(4):655-663.
[Crossref] [Google Scholar] [PubMed]
- Marsh HW, Morin, AJ, Parker PD, Kaur G (2014) Exploratory structural equation modeling: An integration of the best features of exploratory and confirmatory factor analysis. Annu Rev Clin Psychol. 10:85-110.
[Crossref] [Google Scholar] [PubMed]
- Stojanovski E, Mengersen K (2005) Bayesian structural equation models: A health application. 456-462.
[Google Scholar]
- Hill-Briggs F, Adler NE, Berkowitz SA, Chin MH, Gary-Webb TL, et al. (2020) Social determinants of health and diabetes: A scientific review. Diabetes Care. 44(1):258-279.
[Crossref] [Google Scholar] [PubMed]
- Victorino CC, Gauthier AH (2009) The social determinants of child health: Variations across health outcomes-a population-based cross-sectional analysis. BMC Pediatr. 9:53.
[Crossref] [Google Scholar] [PubMed]
- Coady D, Dizioli A (2018) Income inequality and education revisited: Persistence, endogeneity and heterogeneity. Int J Health Econ Manag. 50(25).1-351.
[Crossref] [Google Scholar]
- Feng C, Li L, Sadeghpour A (2020) A comparison of residual diagnosis tools for diagnosing regression models for count data. BMC Med Res Methodol. 20(1):175.
[Crossref] [Google Scholar] [PubMed]
- Maresova P, Javanmardi E, Barakovic S, Barakovic Husic J, Tomsone S, et al. (2019) Consequences of chronic diseases and other limitations associated with old age-A scoping review. BMC Public Health. 19(1):1431.
[Crossref] [Google Scholar] [PubMed]
- Pike J, Grosse JD (2018) Friction cost estimates of productivity costs in cost-of-illness studies in comparison with human capital estimates: A review. Appl Health Econ Health Policy. 16(6):765-778.
[Crossref] [Google Scholar] [PubMed]
- Quinones AR, Botoseneanu A, Markwardt S, Nagel CL, Newsom JT, et al. (2019) Racial/ethnic differences in multimorbidity development and chronic disease accumulation for middle-aged adults. PLoS One. 14(6):e0218462.
[Crossref] [Google Scholar] [PubMed]
- Boeri T (2012) Setting the minimum wage. Labour Econ. 19(3):281-290.
[Crossref] [Google Scholar]
- Friedman C, Rizzolo MC (2020) Fair-wages for people with disabilities: Barriers and facilitators. J Disabil Policy Stud. 31(3).
[Crossref] [Google Scholar]
- McGee D, Cooper R, Liao Y, Durazo-Arvizu R (1996) Patterns of comorbidity and mortality risk in blacks and whites. Ann Epidemiol. 6(5):381-385.
[Crossref] [Google Scholar] [PubMed]
- Clements JM, West BT, Yaker Z, Lauinger B, McCullers D, et al. (2020) Disparities in diabetes-related multiple chronic conditions and mortality: The influence of race. Diabetes Res Clin Pract. 159:984.
[Crossref] [Google Scholar] [PubMed]
- Quinones AR, Nagel CL, Newsom JT, Huguet N, Sheridan P, et al. (2017). Racial and ethnic differences in smoking changes after chronic disease diagnosis among middle-aged and older adults in the United States. BMC Geriatr. 17(1):48.
[Crossref] [Google Scholar] [PubMed]
- Table 7 (2022) Employment status of the civilian population by race, sex, and age. U.S. Bureau of Labor Statistics.
[Google Scholar]
- Neto JAC, Costa LA, Estevanin GM, Bignoto TC, Vieira CIR, et al. (2019) Functional health literacy in chronic cardiovascular patients. Cien Saude Colet. 24(3):1121-1132.
[Crossref] [Google Scholar] [PubMed]
- Lemos CF, Rodrigues MP, Veiga JRP (2015) Family income is associated with quality of life in patients with chronic kidney disease in the pre-dialysis phase: A cross sectional study. Health Qual Life Outcomes. 13(1):202.
[Crossref] [Google Scholar] [PubMed]
- Tsao TY, Konty KJ, Van Wye G, Barbot O, Hadler JL, et al. (2016). Estimating potential reductions in premature mortality in New York city from raising the minimum wage to $ 15. Am J Public Health. 106(6):1036-1041.
[Crossref] [Google Scholar] [PubMed]
- Blundell R, Griffith R, Levell P, Connell MO (2020) Could Covid-19 infect the consumer prices index? Fisc Stud. 41(2):357-361.
[Crossref] [Google Scholar]
- Hyattsville (2017) Health, United States, 2016: With chartbook on long-term trends in health. National Center for Health Statistics (US).
[Google Scholar] [PubMed]
Citation: Jacobs MM, Johnson LA (2024) Chronic Disease and Minimum Wage: Disparities in Diagnosis among Black and Hispanic Workers. Divers Equal Health Care. 21:01.
Copyright: © 2024 Jacobs MM, et al. This is an open-access article distributed under the terms of the Creative Commons Attribution License, which permits unrestricted use, distribution, and reproduction in any medium, provided the original author and source are credited.