Keywords
Cesarean section; Jordan; Neonatal; Mortality
Introduction
WHO) that the rate of cesarean section (CS) should not exceed 10% to 15% in any country [1]. In recent years, the rate of caesarean deliveries increased dramatically worldwide and many countries had exceeded the WHO recommended rate [2].
Many factors have been identified to be associated with CS across the world such as premature rupture of the amniotic membrane, cephalo-pelvic disproportion, fetal distress, multiple pregnancy, breech presentation, place of birth (private or public hospital), maternal preference, birth weight, parity, maternal height and antenatal care use [3-10]. The main indications for cesarean delivery are previous cesarean delivery, breech presentation, and fetal distress [11]. Although CS is a safe operation, when it is performed without medical need it puts mothers and their babies at risk of short- and long-term health problems. Most complications of CS, however, come from the cause which leads to CS. Factors that make some women more likely to have complications include: obesity, large infant size, prolonged labor, multiple pregnancy, and premature labor. In the absence of a clear medical indication, the excess risk associated with the operation itself must be considered. Short- and long-term maternal and infant problems associated with elective caesarean section are higher than those associated with vaginal birth [12-14].
In Jordan, a study conducted between 2002 and 2012 showed that the rate of CS increased from 18.2% in 2002 to 30.3% in 2012 with the most common reason for CS being “absence of a clear indication” [3]. In Jordan, as in many Arab countries, there is a preference for relatively large families. As CS limits the number of children a mother can give birth to, it becomes of paramount importance to perform such operation only when clear medical indications exist.
This study aimed to determine the rate of CS in Jordan and its causes, associated factors, and neonatal outcomes, using a huge sample size representing the different regions and health sectors in Jordan. This information is necessary for alerting health authorities and provides a baseline for future policies and strategies against this rapidly increasing problem.
Methods
Study design
The study is a part of a comprehensive national study of perinatal mortality which was conducted between 2011 and 2012 in Jordan. Details of the study design were described elsewhere [15]. In brief, a sample of 18 hospitals with maternity departments was selected to represent the three regions of Jordan (South, Middle, and North) and the different medical sectors (Ministry of Health, Royal Medical Services, Private sector, and University Hospitals). Sample selection was guided by the Technical Committee of the study that included experts from the Ministry of Health, General Department of Statistics, and a number of international agencies (UNICEF, WHO, and Health System Strengthening (HSS)). All deliveries with a gestational age ≥ 20 week that took place in any of the 18 hospitals during the study period (March 2011- April 2012) were invited to participate in the study. Consenting women were interviewed by the trained midwives in these hospitals using a structured questionnaire prepared for the purpose of this study. Additional information was also collected based on the physical examination by the midwife and the obstetrician at admission and at discharge. Data on the newborn were also collected by the pediatric nurses and the neonatologists in these hospitals. The study instrument included the interview questionnaire as well as data sheets to be completed by the midwife and the pediatric nurse under the supervision of the obstetrician and the neonatologist who were required to sign all data forms. The status of new borns (dead or alive) was ascertained 28 days after delivery. Midwives were required to call mothers by telephone for this purpose. If the new born has died in hospital before 28 days the cause of death was ascertained by the neonatologist. If death occurred at home, a verbal autopsy was performed to find out the cause of death. A total of 21,928 women delivering in these hospitals during the study period were included in the study with a response rate of about 99%. The study was approved by the Jordanian Institutional Review Board (IRB). An informed consent was obtained from all participating women. Every effort was made to protect the confidentiality and the identity of participants.
Data Collection
Extensive data were collected on each woman included in the study and her new born through interview and by abstraction of relevant data from medical records. Data obtained included socio-demographic variables, obstetric history, antenatal care, mode of delivery, complications of delivery, new born status (dead or alive), Apgar score, birth weight, birth injuries and complication etc. Data on cesarean delivery including cause, whether the CS was planned or emergency, and the occurrence of any complications were ascertained by the obstetrician. The study team consisted of 126 persons including hospital obstetricians and neonatologists, midwives, and pediatric nurses. A 2-day workshop was conducted to train all the study team and a 1- day pilot study was carried out in each of the participating hospitals.
Variable definitions
Stillbirth was defined as any fetus born without a heartbeat, breathing, and pulsation of umbilical cord or definite movement of voluntary muscles. The stillbirth rate was calculated as the number of stillbirths per 1,000 live births plus fetal deaths (stillbirths). Neonatal death was defined as a death of a live born infant within the first 28 days of life. Neonatal mortality rate (NNMR) was calculated as the number of deaths during the first 28 completed days of life per 1,000 live births. A baby who was born with a weight of less than 2,500 g was considered low birth weight baby. A premature baby was defined as a baby who was born before 37 completed weeks of pregnancy. The baby is scored for Apgar score at 1 and 5 minutes after birth. Apgar score was classified as: A score of 8-10 is considered normal, 4-7 is intermediate, 0-3 is poor and the infant requires immediate resuscitation.
Preeclampsia was defined according to International Society for the Study of Hypertension in Pregnancy (ISSHP). Obesity was defined according to body mass index (BMI) and it was calculated as pre-pregnancy women weight in Kg divided by height in meters square. A woman with BMI >30 kg/m2 was considered as obese.
Statistical Analysis
Data were analyzed using the Statistical Package for Social Sciences (SPSS IBM 20). The rate of CS, overall and by relevant variables were calculated. The differences in CS rates according to studied variables were tested using Chi-square test. Multivariate analysis using logistic regression was conducted to determine the factors associated with CS. The outcomes of cesarean delivery for the baby were obtained and compared with the rest of the deliveries in bivariate and multivariate models. The frequency of the different causes for CS was also obtained. CS were classified into emergency and planned and the frequency of each, overall and by relevant variables were obtained. A pvalue of less than 0.05 was considered statistically significant.
Results
Participants’ characteristics
This study included a total of 21,928 women. Their age ranged from 14 to 55 with a mean (SD) of 27.9 (6.0). Of all women, 28.1% gave birth in private hospitals, 48.8% in public hospitals, 19.2% in military hospitals, and 3.9% in teaching hospitals. About 2.9% of women gave birth to two or more fetuses. Only 13.1% of women were employed, 28.5% were overweight, 9.6% were obese, 5.0% had high blood pressure, 1.3% had preeclampsia, 1.2% had gestational diabetes, and 0.6% had pre-gestational diabetes. About 8.2% of women had a history of preterm or low birth weight delivery, and 5.3% had a history of neonatal death or stillbirth.
Rate of cesarean section
The overall rate of CS was 29.1% (13.2% for emergency CS and 15.9% for planned CS). Table 1 shows the mode of delivery according to socio-demographic characteristics. CS was significantly higher among women who were older than 35 years and in highly educated women (44.4%, 35.7%, respectively). The rate of CS was significantly lower in women delivering in south of Jordan (23.6%), compared to that in the middle and the north (31.7%, 30.8%, respectively). Planning of CS was significantly more common among Christian Jordanian women than that among Muslims (33.3% vs.16.6%) and among women who smoke compared to that among nonsmokers (20.7%, 16.5%, respectively). CS rate in Jordanian and non-Jordanian women was nearly the same (30.5% vs. 30.6%). CS rate was significantly higher among women who delivered in teaching and private hospitals (42.5%, 37.6%, respectively) compared to women who delivered in military and public hospitals (31.3%, 25.2%, respectively) (Figure 1). CS rate was significantly higher in employed women (39.6%), compared to the rate of CS in housewives (29.1%). It was obvious that the CS rate is higher when fathers are educated >14 years compared with poor educated fathers (36.2% vs. 26.6%).
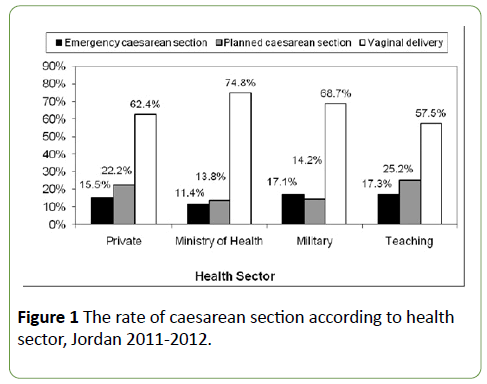
Figure 1:The rate of caesarean section according to health sector, Jordan 2011-2012.
| Variable |
Mode of delivery |
Total |
P-value |
Planned
N (%) |
Emergency
N (%) |
Vaginal
N (%) |
| Age (year) |
| <20 |
69 (5.4) |
171 (13.3) |
1046 (81.3) |
1286 |
0.000 |
| 20-35 |
2619 (15.6) |
2310 (13.7) |
11890 (70.7) |
16819 |
| >35 |
764 (29.4) |
388 (15.0) |
1443 (55.6) |
2595 |
| Occupation |
| Housewife |
2848 (15.9) |
2374 (13.2) |
12718 (70.9) |
17940 |
0.000 |
| Employee |
593 (21.9) |
480 (17.7) |
1636 (60.4) |
2709 |
| Region |
| North |
1166 (16.2) |
1056 (14.6) |
4997 (69.2) |
7219 |
0.000 |
| Middle |
1971 (17.5) |
1607 (14.3) |
7695 (68.3) |
11273 |
| South |
319 (14.4) |
206 (9.3) |
1696 (76.4) |
2221 |
| Religion |
| Muslim |
3439 (16.6) |
2862 (13.9) |
14361 (69.5) |
20662 |
0.000 |
| Christian |
17 (33.3) |
7 (13.7) |
27 (52.9) |
51 |
| Sector |
| Private |
1292 (22.2) |
901 (15.5) |
3633 (62.4) |
5826 |
0.000 |
| Public |
1395 (13.8) |
1147 (11.4) |
7560 (74.8) |
10102 |
| Military |
565 (14.2) |
681 (17.1) |
2730 (68.7) |
3976 |
| Teaching |
204 (25.2) |
140 (17.3) |
465 (57.5) |
809 |
| Nationality |
| Jordanian |
3221 (16.15) |
2728 (14.0) |
13536 (69.5) |
19485 |
0.007 |
| Others |
235 (19.1) |
141 (11.5) |
852 (69.4) |
1228 |
| Mother’s education |
| <12 |
964 (14.2) |
820 (12.1) |
4988 (73.7) |
772 |
0.000 |
| 12-14 |
1679 (17.8) |
1249 (13.2) |
6521 (69.0) |
9449 |
| >14 |
796 (18.0) |
783 (17.7) |
2842 (64.3) |
4421 |
| Father’s education |
| <12 |
1055 (14.4) |
893 (12.2) |
5389 (73.4) |
7337 |
0.000 |
| 12-14 |
1611 (17.1) |
1330 (14.1) |
6494 (68.8) |
9435 |
| >14 |
762 (19.9) |
625 (16.3) |
2446 (63.8) |
3833 |
| Smoking |
| Yes |
142 (20.7) |
104 (15.1) |
441 (64.2) |
687 |
0.000 |
| No |
3312 (16.5) |
2764 (13.8) |
13945 (69.7) |
20021 |
Table 1: Mode of delivery of Jordanian women according to socio-demographic, characteristics, 2011-2012.
Table 2 shows the mode of delivery in Jordanian women according to clinical, anthropometric, obstetric and other relevant characteristics. Women who had diabetes mellitus, preeclampsia, fever, anemia, hypertension, overweight and obesity and past history of stillbirth were more likely to deliver via CS. Breech or presentations other than cephalic, history of CS in previous deliveries, past history of early onset of labor, being transferred from other hospitals, and being hospitalized during the index pregnancy were significantly associated with higher rate of CS delivery. Breech presentation and other noncephalic presentations (such as transverse and cord presentation) were associated with a very high rate of CS (91.2% and 98.2%, respectively) as compared to cephalic presentation (26.4%). Mothers who had past history of CS had a high rate of CS (74.9%) as compared to mothers who didn’t have a past history of CS (20.3%). Mothers who were transferred from other hospitals had a very high rate of CS (61.2%) as compared to mothers who didn’t have a history of transfer from other hospitals (29.9%). Mothers with history of hospitalization during the current pregnancy had a very high rate of CS (47.2%) as compared to mothers without history of hospitalization (29.4%).
| Variable |
Mode of delivery |
Total
N (%) |
P-value |
Planned
N (%) |
Emergency
N (%) |
Vaginal
N (%) |
| Preeclampsia |
| Yes |
72 (25.9) |
101 (36.3) |
105 (37.8) |
278 |
0.000 |
| No |
3382 (16.6) |
2767 (13.5) |
14281 (69.9) |
20430 |
| Diabetes mellitus |
| No Diabetes |
3286 (16.2) |
2800 (13.8) |
14249 (70.1) |
20335 |
0.000 |
| Gestational diabetes |
105 (41.3) |
48 (18.9) |
101 (39.8) |
254 |
| Pre-gestational diabetes |
63 (52.9) |
20 (16.8) |
36 (30.3) |
119 |
| Anemia |
| Yes |
729 (20.4) |
494 (13.8) |
2350 (65.8) |
3573 |
0.000 |
| No |
2725 (15.9) |
2374 (13.9) |
12036 (70.2) |
17135 |
| High blood pressure |
| Yes |
254 (24.6) |
281 (27.2) |
499 (48.3) |
1034 |
0.000 |
| No |
3200 (16.3) |
2587 (13.1) |
13887 (70.6) |
19674 |
| Body mass index |
| Normal |
1524 (13.2) |
1488 (12.9) |
8528 (73.9) |
11540 |
0.000 |
| Overweight |
1071 (18.1) |
837 (14.2) |
4001 (67.7) |
5909 |
| Obesity |
527 (26.5) |
326 (16.4) |
1137 (57.1) |
1990 |
| History of stillbirth |
| No |
3121 (15.9) |
2727 (13.9) |
13743 (70.1) |
19591 |
0.000 |
| Yes |
332 (30.2) |
137 (12.5) |
630 (57.3) |
1099 |
| Antenatal visits |
| None |
22 (9.6) |
28 (12.3) |
178 (78.1) |
228 |
0.000 |
| 1-8 |
860 (14.1) |
719 (11.8) |
4520 (74.1) |
609 |
| >8 |
2530 (17.8) |
2093 (14.7) |
9610 (67.5) |
14233 |
| Birth weight |
| ≥2500 |
3033 (16.1) |
2462 (13.0) |
13378 (70.9) |
18873 |
0.000 |
| <2500 |
422 (23.0) |
405 (22.1) |
1004 (54.8) |
1831 |
| Apgar score |
| Poor (0-3) |
27 (22.7) |
48 (40.3) |
44 (37.0) |
119 |
0.000 |
| Intermediate (4-7) |
1747 (19.7) |
1610 (18.1) |
5515 (62.2) |
8872 |
| Normal (8-10) |
1573 (14.1) |
1132 (10.2) |
8420 (75.7) |
11125 |
| Fetus presentation |
| Cephalic |
2770 (14.3) |
2357 (12.1) |
14302 (73.6) |
19429 |
0.000 |
| Breech |
465 (52.4) |
345 (38.9) |
78 (8.8) |
888 |
| Other |
209 (55.0) |
164 (43.2) |
7 (1.8) |
380 |
| Gestational age |
| ≤31 |
64 (19.6) |
81 (24.8) |
181 (55.5) |
326 |
0.000 |
| 32-36 |
345 (27.9) |
268 (21.6) |
625 (50.5) |
1238 |
| ≥ 37 |
3046 (15.9) |
2518 (13.2) |
13576 (70.9) |
19140 |
| History of C-section |
| Yes |
2304 (59.6) |
592 (15.3) |
968 (25.1) |
3864 |
0.000 |
| No |
1149 (6.8) |
2272 (13.5) |
13405 (79.7) |
16826 |
| History of stillbirth |
| Yes |
332 (30.2) |
137 (12.5) |
630 (57.3) |
1099 |
0.000 |
| No |
3121 (15.9) |
2727 (13.9) |
13743 (70.1) |
19591 |
| History of early onset of labor |
| Spontaneous |
538 (3.8) |
1465 (10.3) |
12164 (85.9) |
14167 |
0.000 |
| Induced |
130 (4.1) |
910 (28.5) |
2155 (67.4) |
3195 |
| Planned C-section |
2730 (87.6) |
382 (12.3) |
3 (0.1) |
3115 |
Table 2: Mode of delivery of Jordanian women according to clinical, anthropometric, and obstetric characteristics, 2011-2012.
Multivariate analysis of factors associated with CS
Multivariate analysis (Table 3) showed many factors to be associated with CS. Health sector was significantly associated with the rate of CS. Compared to those who gave birth in private hospitals, women who gave birth in Ministry of Health hospitals (OR=0.4) and Military hospitals (OR=0.6) were less likely to deliver via CS. The rate of CS increased significantly with increased age. The odds of delivering via CS among women aged ≥ 30 years was 3.7 times that odds among women aged <20 years. Income of >350 vs. ≤ 350 JD, <12 years of education, increased gestational age at delivery, primiparity, previous CS (OR=23.8), baby’s male gender, overweight, obesity, pre-gestational and gestational diabetes, non-cephalic presentation, multiple pregnancy, preeclampsia, anemia, smoking, history of neonatal death/stillbirth, and hospitalization during current delivery were all associated with increased odds of CS in the multivariate analysis.
| Variable |
OR |
95% confidence interval |
P-value |
| Sector |
| Private |
1 |
- |
- |
- |
| Public |
0.4 |
0.4 |
0.5 |
0.000 |
| Military |
0.6 |
0.6 |
0.7 |
0.000 |
| Teaching |
0.8 |
0.7 |
1.0 |
0.057 |
| Age (year) |
| 14-19 |
1 |
- |
- |
- |
| 20-24 |
1.6 |
1.3 |
1.9 |
0.000 |
| 25-29 |
2.4 |
2.0 |
3.0 |
0.000 |
| = 30 |
3.7 |
3.0 |
4.7 |
0.000 |
| Gestational age |
| <28 |
1 |
- |
- |
- |
| 28-32 |
7.1 |
3.5 |
14.4 |
0.000 |
| 32-37 |
7.3 |
3.9 |
13.5 |
0.000 |
| >37 |
4.6 |
2.5 |
8.3 |
0.000 |
| Number of deliveries |
| 1 |
1.8 |
1.5 |
2.1 |
0.000 |
| 2 |
1.1 |
1.0 |
1.3 |
0.148 |
| = 3 |
1 |
- |
- |
- |
| Inter-delivery interval |
| First delivery |
7.5 |
6.3 |
8.8 |
0.000 |
| <2 years |
0.9 |
0.8 |
1.0 |
0.046 |
| >2 years |
1 |
- |
- |
- |
| Diabetes mellitus |
| No Diabetes |
1 |
- |
- |
- |
| Gestational diabetes |
3.1 |
2.2 |
4.4 |
0.000 |
| Pre-gestational diabetes |
2.8 |
1.7 |
4.9 |
0.000 |
| Presentation at delivery |
| Cephalic |
1 |
- |
- |
- |
| Breech |
52.0 |
39.7 |
68.2 |
0.000 |
| Other |
342.2 |
138.6 |
844.7 |
0.000 |
| Body mass index |
| Normal |
1 |
- |
- |
- |
| Overweight |
1.4 |
1.3 |
1.6 |
0.000 |
| Obesity |
1.9 |
1.6 |
2.2 |
0.000 |
| Mother’s education |
| <12 years |
1.2 |
1.0 |
1.4 |
0.016 |
| 12-14 |
1.1 |
1.0 |
1.2 |
0.159 |
| >14 |
1 |
- |
- |
- |
| Region |
| North |
1 |
- |
- |
- |
| Middle |
0.8 |
0.7 |
0.9 |
0.000 |
| South |
0.6 |
0.5 |
0.7 |
0.000 |
| Baby’s gender (Male vs. Female) |
1.1 |
1.1 |
1.2 |
0.001 |
| Number of fetuses (Multiple vs. Single) |
3.3 |
2.5 |
4.2 |
0.000 |
| Preeclampsia |
3.2 |
2.3 |
4.5 |
0.000 |
| Anemia |
1.3 |
1.1 |
1.4 |
0.000 |
| Income (JD) (>350 vs. ≤350) |
1.2 |
1.1 |
1.3 |
0.000 |
| Smoking |
1.4 |
1.2 |
1.8 |
0.002 |
| History of low delivery/preterm delivery |
0.8 |
0.7 |
0.9 |
0.003 |
| History of neonatal death/stillbirth |
1.3 |
1.0 |
1.5 |
0.018 |
| Previous cesarean section |
23.8 |
21.3 |
26.5 |
0.000 |
| Hospitalization during current delivery |
1.5 |
1.3 |
1.8 |
0.000 |
Table 3: Multivariate analysis of factors associated with cesarean section. Jordan 2011- 2012.
Reasons for planned and emergency CS
Table 4 shows the various reasons for planned CS according to health sector. The most frequent reason was scarred uterus (59.4%). The second most common reason was abnormal presentation like breech or presentations other than cephalic (7.9%). Other relatively common reasons included multiple pregnancy (6.8%), medical problems (6.2%), and mothers’ desire for CS (5.6%). The distribution of these reasons varied significantly according to sector. Table 5 shows the various reasons for emergency CS according to health sector. The most frequent reason was prolonged fetal distress (30.0%) followed by obstructed labor (24%), abnormal presentation (15.6%), and eclampsia or sudden severe high blood pressure or seizure (8.1%). The distribution of these reasons varied according to health sector.
| Variables |
Total
N (%) |
Sector |
Private
N (%) |
Public
N (%) |
Military
N (%) |
Teaching
N (%) |
| Scarred uterus |
2056 (59.5) |
770 (59.6) |
937 (67.2) |
254 (45.0) |
95 (46.6) |
| Abnormal presentation |
274 (7.9) |
81 (6.3) |
87 (6.2) |
94 (16.6) |
12 (5.9) |
| Multiple fetuses |
234 (6.8) |
58 (4.5) |
74 (5.3) |
77 (13.6) |
25 (12.3) |
Special medical
Condition |
215 (6.2) |
110 (8.5) |
77 (5.5) |
21 (3.7) |
7 (3.4) |
| Mother's desire |
192 (5.6) |
80 (6.2) |
35 (2.5) |
38 (6.7) |
39 (19.1) |
Placenta previa or
Placenta malposition |
76 (2.2) |
30 (2.3) |
24 (1.7) |
14 (2.5) |
8 (3.9) |
| Large fetus |
69 (2.0) |
26 (2.0) |
20 (1.4) |
22 (3.9) |
1 (0.5) |
| Precious fetus |
65 (1.9) |
26 (2.0) |
21 (1.5) |
16 (2.8) |
2 (1.0) |
| Post date |
46 (1.3) |
16 (1.2) |
27 (1.9) |
3 (0.5) |
0 (0.0) |
| Old primi |
25 (0.7) |
2 (0.2) |
22 (1.6) |
1 (0.2) |
0 (0.0) |
Cephalo-pelvic
disproportion |
25 (0.7) |
10 (0.8) |
13 (0.9) |
0 (0.0) |
2 (1.0) |
| Bad obstetric history |
17 (0.5) |
11 (0.9) |
3 (0.2) |
2 (0.4) |
1 (0.5) |
| Oligohydramnios |
17 (0.5) |
8 (0.6) |
5 (0.4) |
4 (0.7) |
0 (0.0) |
| Infection of vaginal tract |
11 (0.3) |
3 (0.2) |
7 (0.5) |
1 (0.2) |
0 (0.0) |
Anterior posterior
vaginal repair |
11 (0.3) |
5 (0.4) |
3 (0.2) |
1 (0.2) |
2 (1.0) |
| Congenital anomaly |
10 (0.3) |
3 (0.2) |
4 (0.3) |
1 (0.2) |
2 (1.0) |
| IUGR |
10 (0.3) |
5 (0.4) |
0 (0.0) |
5 (0.9) |
0 (0.0) |
| Others |
103 (3.0) |
48 (3.7) |
36 (2.6) |
11 (1.9) |
8 (3.9) |
| Total |
3456 (100.0) |
3456 (100) |
1395 (100) |
565 (100.0) |
204 (100.0) |
Table 4: Reported reasons for planned cesarean section in Jordanian women according to sector, 2011-2012.
| Variables |
Total
N (%) |
Sector |
Private
N (%) |
Public
N (%) |
Military
N (%) |
Teaching
N (%) |
| Prolonged fetal distress |
862 (30.0) |
246 (27.3) |
230 (20.1) |
335 (49.2) |
51 (36.4) |
| Obstructed labor |
700 (24.4) |
274 (30.4) |
231 (20.1) |
149 (21.9) |
46 (32.9) |
| Abnormal presentation |
447 (15.6) |
87 (9.7) |
253 (22.1) |
87 (12.8) |
20 (14.3) |
| Eclampsia or sudden sever high blood pressure or seizure |
231 (8.1) |
52 (5.8) |
142 (12.4) |
33 (4.8) |
4 (2.9) |
| Heavy persistent vaginal bleeding |
113 (3.9) |
30 (3.3) |
68 (5.9) |
15 (2.2) |
0 (0.0) |
| Cephalopelvic disproportion |
76 (2.6) |
17 (1.9) |
47 (4.1) |
11 (1.6) |
1 (0.7) |
| Mother exhaustion |
60 (2.1) |
17 (1.9) |
40 (3.5) |
3 (0.4) |
0 (0.0) |
| Cord prolapse |
44 (1.5) |
10 (1.1) |
14 (1.2) |
15 (2.2) |
5 (3.6) |
| Premature labor pain |
35 (1.2) |
22 (2.4) |
9 (0.8) |
4 (0.6) |
0 (0.0) |
| Failed vacuum or forceps delivery |
31 (1.1) |
8 (0.9) |
9 (0.8) |
10 (1.5) |
4 (2.9) |
| High floating fetal head |
29 (1.0) |
26 (2.9) |
3 (0.3) |
0 (0.0) |
0 (0.0) |
Abnormal intra uterine
fetal heart nonstress test |
15 (0.5) |
11 (1.2) |
2 (0.2) |
1 (0.1) |
1 (0.7) |
| Failed labor induction |
10 (0.3) |
0 (0.0) |
9 (0.8) |
0 (0.0) |
1 (0.7) |
| Rupture of uterus |
4 (0.1) |
4 (0.4) |
0 (0.0) |
0 (0.0) |
0 (0.0) |
| Other mother reasons |
148 (5.2) |
63 (7.0) |
70 (6.1) |
13 (1.9) |
2 (1.4) |
| Other fetal reasons |
64 (2.2) |
34 (3.8) |
20 (1.7) |
5 (0.7) |
5 (3.6) |
| Total |
2869 (100.0) |
901 (100.0) |
1147 (100.) |
681 (100.0) |
140 (100.0) |
Table 5: Reasons for emergency cesarean section in Jordanian women according to sector, 2011-2012.
Association between CS and neonatal mortality
The neonatal death rate was significantly higher (p=0.000) for planned CS (2.1%) and emergency CS (2.5%) as compared to vaginal delivery (0.9%). After adjusting for important predictors of neonatal mortality including gestational age, history of neonatal death/stillbirth, birth weight, and baby’s gender (Table 6), mode of delivery was significantly associated with neonatal mortality. The rate of neonatal mortality for babies born via CS was 1.3 times higher than for babies born by normal delivery.
| Variable |
OR |
95% confidence interval |
P-value |
| Mode of delivery (cesarean section vs. vaginal) |
1.3 |
1.0 |
1.7 |
0.041 |
| Gestational age (<37 vs. ≥ 37) |
7.2 |
5.1 |
10.2 |
0.000 |
| History of neonatal death/stillbirth (yes vs. no) |
1.8 |
1.2 |
2.7 |
0.004 |
| Birthweight (<2500 vs. ≥ 2500) |
11.3 |
7.8 |
16.2 |
0.000 |
| Baby’s gender (Male vs. Female) |
1.4 |
1.1 |
1.8 |
0.011 |
Table 6: Neonatal mortality by mode of delivery and other relevant variables using multivariate logistic regression, Jordan 2011-2012.
Discussion
This study demonstrated a markedly high rate of CS of 29.1% in Jordan. The observed rate of CS in this study was higher than the previously reported rate of 27.7% from the higher population Council maternal morbidity study in Jordan (2007-2008) [16], and the rate of 18.5% from the 2007 Jordan Population and Family Health Survey [17]. The figure becomes more striking when compared to the previously reported data from seven military hospitals across the country revealing a rate of only 8% for the period 1990-1992 which increased to 10.9% for the period 1999-2001 [18]. In fact, an increasing trend in cesarean deliveries has been observed almost everywhere during the past few decades. In Egypt, CS rate increased from 4.6% to 10% between 1992 and 2000 [19]. Ba’aqeel [20] reported that over the period between 1997 and 2006, CS delivery rate increased from 10.6% to 19.1% in Saudi Arabia.
The high rate of CS has well surpassed the recommendations of the WHO health experts who considered the ideal rate for CS to be between 10% and 15% [1]. The problem is serious in Jordan and most Arab countries which prefer relatively larger families. Limitation of the number of children a woman can give birth to due to repeated CS may expose her to family problems such as divorce or polygamy. It has been claimed that many reasons may have led to this high rate of CS. One reason is performing unnecessary CSs for training purposes by some residents. This is supported by the finding that the highest CS rate was in teaching hospitals (42.5%). However, the kind of women delivering in teaching hospitals may differ from women delivering in other hospitals which may explain such higher CS rates in teaching hospitals. Another reason for the high rate is financial since hospitals charge more money for CS than normal vaginal delivery. This is supported by a higher rate of CS in the private sector (37.6%) as compared to the public sector (25.2%). Similar findings were also reported from a national study of 57 out of 230 hospitals in Syria, where the CS rate was 12.7% in public hospitals compared to 22.9% in the private sector [21,22].
The study showed that increased age was significantly associated with CS. CS rate was higher among women who were older than 35 years (44.4%). Peipert and Bracken [23] observed that women whose age is >30 years had a 70% increase in risk for caesarean delivery compared with women <30. A lot of other studies showed that increased maternal age is associated with an increase in CS rate [24]. There is no satisfactory explanation for this linear association between age and CS rate. However, pelvic rigidity and over care for premium babies in this group might be behind this increase. Moreover, we found a significantly higher CS rate among highly educated women. Highly educated women tend to be older than low educated women, because usually they get married and pregnant at an older age. However, controlling for age in the present study did not remove the effect of education.
This study showed that women with preeclampsia had a significantly increased CS rate. Preeclampsia is known to be associated with intrauterine growth restriction, fetal distress and prematurity [25]. Because of that a lot of mothers with preeclampsia plan to deliver via CS. Similar findings were reported from another study [26]. Moreover, our study showed that CS rate was significantly higher in both mothers with gestational diabetes (60.2%) or pre-gestational diabetes (69.7%). It has been recently observed that women with diabetes have "impaired uterine contractility”. Obesity in the present study was associated with a higher rate of CS (42.9%). Similar findings were reported by others [27,28] and a linear relationship between BMI and cesarean delivery has been reported [29].
One study showed that obese women were 6 times more likely to have CS due to cephalo-pelvic disproportion or failure to progress than non-obese women [30]. In the present study, 45.3% of all cesareans were performed on emergency basis and 55.7% were planned. This finding is not consistent with other studies which showed that emergency CS far exceeds planned CS. [31,32]. Consistent with another study [33], the most common reasons for emergency CS in the current study were prolonged fetal distress, obstructed labor, and abnormal presentations such as breech or transverse presentations. The most frequent reason cited for planned CS was scarred uterus, which mostly reflects previous CS. Among the proposed factors contributing to the increase in cesarean is patient desire. Mother desire in the current study was one of the main reasons for planned CS accounting for 5.6% of all planned CS. The reason provided by participating women for preference of CS was simply to avoid pain of vaginal delivery. On the other hand, in a previous study of maternal morbidity in Jordan (2007-2008), mother desire accounted for less than 1% of cesarean deliveries [17].
The increase in cesarean delivery rates overtime has not been associated with improvements in neonatal outcomes [34]. In the present study, the neonatal death rate was significantly higher in planned CS and emergency CS, as compared to vaginal delivery. The current study and many other international studies support an increase in neonatal death in women undergoing CS. A possible explanation is that mothers undergoing CS, and newborns that are products of CS, may have serious medical conditions like preeclampsia, diabetes mellitus, scarred uterus, fetal distress, congenital anomalies, heart diseases, etc. In other words, it is very difficult to attribute the excess in neonatal mortality to CS as it may be resulting from the causes for which CS was performed. The present study is a national study utilizing a huge sample size (about 15% of all deliveries in a year) representing the different regions and health sectors in Jordan. The study assessed comprehensively all women during their admission and followed them prospectively to ascertain the status of their newborns and determine the causes of any deaths within 28 days after birth. The main limitation of this study is that the reasons for CS were provided by the obstetrician who is likely to provide legitimate reasons for performing CS. Provided reasons may not be the actual reasons; it is unlikely that an obstetrician would formally confess that he performed CS for illegitimate reasons such as training of residents, convenient timing, or financial reasons. Therefore, the reasons stated in this study are those reported by the obstetricians; studying the actual reasons needs a different design.
Conclusion
Future research is needed to explore the nonclinical causes of CS like attitudes, behaviors, and skills of obstetricians as well as the social, economic, and legal environment in the country. We need also to understand the preferences of women in this regard. As much of the offered causes for cesarean delivery in this study are to an extent subjective and dependent on the judgment of the physician, research may be directed to uncover the true causes for this alarming health problem. To maintain an acceptable caesarean section rate, a multidisciplinary quality assurance program should be established in all facilities in which delivery occurs. As most CSs are currently based on physician’s judgment, it may be extremely useful to develop and strictly implement national guidelines for performing CSs.
Acknowledgements
We would like to thank UNICEF for funding the study and for providing the needed administrative and technical help. John Snow Inc. (JSI) was the contracting body and worked closely with the local team to have this project successfully accomplished. We warmly acknowledge the Higher Population Council in Jordan for their great role in facilitating and coordinating this study and providing all necessary support. We would like also to thank our field researchers of neonatologists, pediatricians, and nurses for their marvelous effort in collecting the data. Finally, we thank all participating mothers for their cooperativeness, without which the study couldn’t have come to a successful conclusion.
References
- No authors listed (1985) Appropriate technology for birth. Lancet 2: 436-437.
- Gibbons L, Belizan J, Lauer J, Betran A, Merialdi M, et al. (2010) The global numbers and costs of additionally needed and unnecessary caesarean sections performed per year: Overuse as a barrier to universal coverage. World Health Report, Background paper. p. 30.
- Al-Rifai R (2014) Rising cesarean deliveries among apparently low-risk mothers at University teaching hospitals in Jordan: Analysis of population survey data, 2002-2012. Glob Health Sci Pract 2: 195-209.
- Panditrao S (2008) Intra-operative difficulties in repeat cesarean sections. J Obstet Gynecol India 58: 507-510.
- World Health Organization (2009) Monitoring emergency obstetric care: A handbook, Geneva, Switzerland.
- Adnan A, Abu O, Suleiman H, Abu A (2012) Frequency rate and indications of cesarean sections at Prince Zaid Bin Al-Hussein Hospital - Jordan. J Med Sci Clin Res 19: 82-86.
- Moges A, Ademe B, Akessa G (2015) Prevalence and Outcome of caesarean section in Attat Hospital, Gurage Zone, SNNPR, Ethiopia. Arch Med 7: 4.
- Paterson-Brown S (1998) Should doctors perform an elective caesarean section on request? Yes, as long as the woman is fully informed. BMJ 317: 462-463.
- Amu O, Rajendran S, Bolaji I (1998) Should doctors perform an elective caesarean section on request? Maternal choice should not determine method of delivery. BMJ 317: 463-465.
- Thomas J, Paranjothy S (2001) Royal College of Obstetricians and Gynaecologists: Clinical effectiveness Support Unit. The National Sentinel Caesareans Section Audit Report. London: RCOG Press, UK.
- Notzon F, Cnattingius S, Bergsjo P, Cole S, Taffel S, et al. (1994) CS delivery in the 1980s: International comparison by indication. Am J Obstet Gynecol 170: 495-504.
- Gilliam M (2006) Cesarean delivery on request: Reproductive consequences. Semin Perinatol 30: 257-260.
- Liu S, Liston RM, Joseph KS, Heaman M, Sauve R, et al. (2007) Maternal mortality and severe morbidity associated with low-risk planned cesarean delivery versus planned vaginal delivery at term. CMAJ 176: 455- 459.
- MacDorman M, Declercq E, Menacker F, Malloy MH (2008) Neonatal mortality for primary cesarean and vaginal births to low-risk women: Application of an “Intention-totreatâ€Â model. Birth 35: 3-8.
- Batieha AM, Khader YS, Berdzuli N, Chua-Oon C, Badran EF, et al. (2016) Level, causes and risk factors of neonatal mortality, in Jordan: Results of a national prospective study. Matern Child Health J 20: 1061-1071.
- The National Maternal Morbidity Study (2008) The Higher Population Council, Jordan.
- Department of Statistics (Jordan) and Macro International Inc. 2008. Jordan Population and Family Health Survey 2007. Calverton, Maryland, USA: Department of Statistics and Macro International Inc.
- Hindawi I, Meri Z (2004) The Jordanian cesarean section rate. Saudi Med J 25: 1631-1635.
- Khawaja M, Jurdi R, Kabakian-Khasholian T (2004) Rising trends in cesarean section rates in Egypt. Birth 31: 12-16.
- Baâ€Âââ€Å¾Â¢aqeel H (2009) Cesarean delivery rates in Saudi Arabia: A ten-year review. Ann Saudi Med 29: 179-183.
- Jurdi R, Khawaja M (2004) Caesarean section ratesin the Arab region: Across-national study. Health Policy and Plan 19: 101-110.
- Abdulsalam A, Bashour H, Cheikha S (2004) Routine care of normal deliveries as applied in Syrian maternity wards. J Arab Board Med Specializations 6: 134-140.
- Peipert J, Bracken M (1993) Maternal age: An independent risk factor for cesarean delivery. Obstet Gynecol 81: 200-205.
- Gareen I, Morgenstern H, Greenland S, Gifford D (2003) Explaining the association of maternal age with Cesarean delivery for nulliparous and parous women. J Clin Epidemiol 56: 1100-1110.
- American College of Obstetricians and Gynecologists (2000) Evaluation of cesarean delivery. Washington DC, USA.
- Mikki N, Abu-Rmeileh N, Wick L, Abu-Asab N, Hassan-Bitar S (2009) Caesarean delivery rates, determinants and indications in Makassed Hospital, Jerusalem 1993 and 2002. La Revue de Santé de la Méditerranéeorientale 15: 868-879.
- Savitz D, Stein C, Siega-Riz A, Herring A (2011) Gestational weight gain and birth outcome in relation to prepregnancy body mass index and ethnicity. Ann Epidemiol 21: 78- 85.
- Dietz P, Callaghan W, Morrow B, Cogswell M (2005) Population-based assessment of the risk of primary cesarean delivery due to excess pre-pregnancy weight among nulliparous women delivering term infants. Matern Child Health J 9: 237-244.
- Barau G, Robillard P, Hulsey T, Dedecker F, Laffite A, et al. (2006) Linear association between maternal body mass index and risk of cesarean section in term deliveries. BJOG 113: 1173-1177.
- Young T, Woodman B (2002) Factors that are associated with cesarean delivery in a large private practice: The importance of pre-pregnancy body mass index and weight gain. Am J Obstet Gynecol 187: 312-332.
- Naeem M, Khan M, Abbas S, Khan A, Adil M, et al. (2015) Rate and Indications of elective and emergency caesarean section; A study in a tertiary care hospital of Peshawar. J Ayub Med Coll Abbottabad 27: 151- 154.
- Olusanya B, Solanke O (2009) Maternal and neonatal factors associated with mode of delivery under a universal newborn hearing screening programme in Lagos, Nigeria. BMC Pregnancy Childbirth 9: 41.
- Aminu M, Utz B, Halim A, Broek N (2014) Reasons for performing a caesarean section in public hospitals in rural Bangladesh. BMC Preg Child 14: 130.
- Dresang L, Leeman L (2012) Cesarean delivery. Prim Care 39: 145-165.