Research Article - (2023) Volume 8, Issue 5
Cancer Detection Using Innovative Advanced Artificial Intelligence
David Herman1*,
Christy Hunter2 and
German Alfredo Sinuco Leon3
1CEO, AI Force Limited, Brighton, United Kingdom
2Department of Pharmaceutical Sciences, University of Lincoln, United Kingdom
3Department of Mathematics and Physics, University of Sussex, United Kingdom
*Correspondence:
David Herman,
CEO, AI Force Limited, Brighton,
United Kingdom,
Email:
Received: 03-Oct-2023, Manuscript No. IPJHCC-23-17848;
Editor assigned: 05-Oct-2023, Pre QC No. IPJHCC-23-17848 (PQ);
Reviewed: 19-Oct-2023, QC No. IPJHCC-23-17848;
Revised: 24-Oct-2023, Manuscript No. IPJHCC-23-17848 (R);
Published:
31-Oct-2023, DOI: 10.36846/2472-1654-8.5.8050
Abstract
This evidence report discusses an advanced artificial intelligence technology to detect cancer early, accurately
and inexpensively. Initial type is breast cancer; however this technology is not limited and can be applied to other
cancers.
This technology uses scans that are image files. Scans are from a patient who may have cancer. The image files
are then provided to this technology for analysis. The technology automatically generates a report indicating the
probability that the patient has cancer.
The report is intended to be reviewed by a medical specialist who may perform additional tests on the patient with a
high probability of having cancer. If, on the other hand, the report indicated a low probability of having cancer, scarce
resources may not need to be allocated as a high priority.
As an example, mammograms are required to use two independent radiologists to review the results. This technology
could be utilized without mandatory radiologists at this stage. These radiologists could be more effectively utilized
at a later stage to determine how far the cancer may have spread.
Sources of image files can be mammograms, finite needle aspirations, ultrasound scan as examples.
Artificial intelligence technology is first trained so it can recognize cancer reliably. Other artificial intelligence
technologies typically require thousands for training. And, results are not comparably reliable. The advanced
artificial intelligence technology discussed in this report trains with high reliable image files using bespoke pretraining
modules that are one of many factors to keep the training samples low and accurate. After training, this
technology utilizes additional bespoke advanced modules for further accuracy refinements.
Training summary:
• May be skipped entirely based on analysis of known scans.
• This relies on existing training using NCBI vetted cancer samples.
• Or, if training is required, very few training samples are needed. This is due to bespoke non AI modules.
Keywords
Attitude; Communication; Delivery of health care; Dentistry; Hearing loss; Oral health; Sign language
Background
Strategy of this Paper
Some sections in this paper may seem arbitrary. We intend to
introduce them in this section in order for them to make sense
to the reader (Figure 1).
Our technology achieves high accuracy requiring minimal
training samples using an innovative technology. The key
driving us is that our technology works with less training
samples, uses bespoke non-standard AI model processing
resulting in considerable accuracy. There are many layers to our
technology. One is to avoid training samples that are useless or
even reduce accuracy. Therefore, we apply bespoke algorithms
before training and, bespoke software, and also after testing,
which significantly contributes to the accuracy results. We also implement bespoke layers to account for medical images that
are different from detecting say cats and dogs.

Figure 1: Automatically generated report indicating probability of cancer
An elegant explanation explaining the difference between
algorithms and AI is presented by Cassie Kozyrkov is clear
and succinct and therefore we included partially unchanged
as a small section of this paper. Therefore, standard AI was a
good place for our technology to start years ago and therefore
we improved the standard AI training and prediction modes
achieving considerable accuracy.
K-Folding is used in other technologies. It is advocated as a
shortcut to large training. In the development of our approach,
we have tried K-Folding and found it to weaken the training and
result in less accuracy. We have purposely avoided it for reasons
that are explained. We have avoided presenting massive data,
proving that K-Folding should be avoided.
Transfer learning is a strategy that is advocated in other machine
learning strategies. This might be considered a shortcut and
theoretically make training easier. We disagree with this
approach and believe it will weaken training and proceed to
make errors affecting accuracy during testing. Transfer learning
is further tested during the paper that presents five external AI
models. It is proved in a multi model external paper approach
and therefore we agree with the external authors that it is a
strategy to be avoided. We include transfer learning is in detail
in a section of this paper. This should explain to the reader
what we are actually avoiding.
Introduction
We have developed a rapid AI based cancer screening system.
This application of AI can be utilized to save money, use more
economically accessible equipment with less clinician input,
achieve reduction in treatment plans and achieve reduction in
cancer recurrence rates through early diagnosis.
Breast cancer one of the fastest growing tumors, this means
that the faster it can be diagnosed, the greater the reduction in
morbidity and mortality.
Focusing on the fastest increasing and most fatal forms of
breast cancer supports this business’s advanced innovative
artificial intelligence technology. Accurately identifying cancer
screening promptly improves morbidity and mortality. In
addition, this increases chances of survival and preventing the
need for surgery and high-cost reconstruction. Data processed
by this technology can be images including but not limited to
medical sides.
This technology has demonstrated high accuracy (100%)
in differentiating healthy from cancerous cells on digitized
histopathology images. One reason is that the technology filters
out poor samples before artificial intelligence methodology is
applied.
This technology can be applied to detection of many cancers or,
for that matter, other medical diagnosis.
Breast cancer is the most common form of cancer in the United
Kingdom with 63,500 new cases diagnosed every year [1]. This
is the leading cause of death from cancer in women under
the age of 50 and in total is responsible for approximately
11,500 deaths per year. Healthcare institutions globally have
attempted to improve the speed and efficiency of cancer
detection through various techniques such as screening and
streamlined access to cancer diagnosis. However, despite this,
morbidity and mortality continue to rise. There are multiple
factors which affect the delay in diagnosis of breast cancer and
early treatment [2]. Olsen et al describes one such variable
as the patient interval [3]. This refers to patient factors and
although controversial, more research has been undertaken to
support the notion that behavioral and psychological factors
play a significant role in the early diagnosis of breast cancer [4].
A further significant delay is tissue diagnosis. In 2018 the
BBC reported that there is a national shortage of cellular
pathologists with only 3% of centres reporting adequate
staffing levels [5]. Elmore et al. identified that pathologists
were able to accurately diagnose breast cancer from biopsy
slides 75.3% of the time. Therefore, the access to pathologists
and the reported accuracy is unsatisfactory to the patient with
breast cancer.
In recent years, a branch of artificial intelligence known as
machine learning has become an increasingly popular tool for increasing the accuracy of cancer diagnosis [6]. Machine
learning identifies categories such as tissues with cancer that
the human brain is unlikely to find. Machine learning is already
being used in the diagnosis of cancer by interpreting digital
histopathology images obtained from tissue samples however
it has several drawbacks.
One such limitation is the need for vast training data sets.
Standard AI-ML models are data hungry during training.
We acknowledge that you can throw vast amounts of data
examples to traditional AI-ML models and eventually you will
get impressive results. This is not practical in real world settings
where access to this level of training data may not be possible.
In the following paper we will demonstrate high classification
accuracy without the requirement for large numbers of training
images using our proprietary enhanced artificial intelligence
(eAI) software [7].
Cancer screening enables early detection of disease and
optimizes treatment outcome for the patient. Improving
cancer screening is a valuable objective both altruistically but
also financially for healthcare institutions. Improving the speed
and accuracy of tissue diagnosis underpins any effort to impact
on cancer screening today.
Aims
We have an efficient and accurate cancer diagnostic tool. We
will demonstrate evidence of high accuracy using data from
internationally approved sources. This evidence will also show
how this level of accuracy can be achieved using much lower
numbers of data samples.
This technology uses data that can represent images (The
images can be medical slides. They do not need to be slides.
The data can be images; this means that this technology can be
applied to detection of many cancers or, for that matter, other
medical diagnosis).
As highlighted previously, images presented to human experts
can be difficult and unreliable to interpret accurately. Reading
images as tissue samples. Using today’s artificial intelligence
technology might result in somewhat higher than human
accuracy after training but only to a point and inconsistently.
eAI technology as described in this evidence-based paper
results in accuracy not less than 100% using minimal data for
training of the AI system to interpret images. As well as reliably.
This means that this technology can be applied to detection of
many cancers or, for that matter, other medical diagnosis.
Materials and Methods
eAI trains with images as shown below. These can be biopsy
slides or mammography or ultrasound. The images are
determined to be usable and discarded if not. It is not about
collecting as much as possible because poor quality images can
corrupt the training or testing processes.
Figure shows an example of data as images. Some are known to
have cancer. Some do not have cancer. Some are poor quality
and should be ignored. Human experts classify some images
incorrectly resulting in inaccurate diagnosis (Figure 2).

Figure 2: Digitized histopathology slides with a range of images some of which have cancer and some are healthy. Some are not usable due to high fat content
Dataset Sources
These were biopsy images scanned to 50 × 50 data files for eAI technology (this paper) as well as for 5 external A.I. studies. All
of these were obtained from the National Center for Biological
Information (NCBI).
The dataset consists of approximately 5000 50 × 50 pixel RGB
digital images of H&E-stained breast histopathology samples
that are labeled as either IDC or non-IDC. These NumPy arrays
are small patches that were extracted from digital images of
breast tissue samples. The breast tissue contains many cells
but only some of them are cancerous.
Training and Testing
Two distinct processes: Training (one off) and Testing
(unlimited).
Training
We use a source of data which comprises known samples
labeled as cancer or non-cancer (may be referred to as
healthy). However, prior to training, unusable samples are
removed. Furthermore good samples are put aside for testing
so we can use this separate sample set as trusted test data.
This separation ensures that testing cannot be over-fitted. We
point out that we also purposely avoid cross-validation. It can
be argued that cross-validation can help training by using small
sets to train and therefore speeds up the process. In addition,
cross-validation can thoroughly mix the data samples. But, that
training phase can use test data which can lead to over-fitting,
meaning that the training is tuned to the test data which is
should be avoided. Thus, the disadvantage of cross-validation
is that pollution of training data sets can easily occur producing
training weights guessing (predict) inaccurately during the
testing phase. The technology will throw away poor data
using a sophisticated process before training can take place.
Therefore, using entirely separate data samples completely
avoids this risk. Addressing the downside of avoiding cross validation means we must train many times to be sure that we
are training with adequately random samples and not samples
that coincidently happen to produce predictions that serve to
justify our claims.
In addition, we seek to minimise the amount of training data
while simultaneously producing high accuracy. We chose to
train with NCBI trusted worldwide data. A low quantity of
training slides producing high accuracy results. We point out
that we train with balanced cancer and non-cancer samples.
In summary, it is best to train with as few samples as possible.
Strategy: We re-trained many times with different random
(balanced) sets and ended up with close to the same quantity
consistently. A different lab will find some number maybe a few
hundred not necessarily 400 which is particular to our set.
K-Fold with Cross Validation: We also considered "K-Fold
Cross Validation" which we show can pollute the training set.
We sever a set to Test or Validate before any training has been
done. This guarantees a separate set that could not pollute the
training set.
Process: Sever a separate set, train, validate with 100%
accuracy "rinse repeat etc." If using another lab, same process,
find a new minimal. Note that 400 is not special. The goal is
simple-smallest that is 100% accurate only for this particular
data set from this lab.
K-Fold Cross Validation-explanation and why it is not used
(Figure 3).

Figure 3: K-Fold Cross Validation illustration for explanation
Testing
After one-off training, we can test unlimited times. We hope to
get (predictions) that accurately tell us whether these unknown
samples have cancer. A strategy shall be described in order to
make the result meaningful.
Consider providing unknown data samples. The technology will
throw away unsatisfactory data using a sophisticated process
before further testing predictions estimation can take place.
The authors anticipate that due to the nature of obtaining
biopsies, there will be occasions where the samples are
inadequate and prediction cannot be accurate. The eAI will
suggest obtaining new data (Mixed results can skew the
predictions in a particular classification because the test
samples come from one patient).
It is understood that a particular patient can have cancer in one
place but not in another place. It is expected that the samples
will come from a location that is suspected to have cancer.
Therefore, random samples are not useful.
We suggest several options to avoid this problem. Scans from
areas pointed at by ultrasound. Mammograms scans can
show suspicious images. Swelling can be evident to a doctor.
Therefore, non-biopsy procedure can be used if needed.
Conversely, minimal biopsy FNA procedure can produce
images. Several samples are presented to the technology for
analysis and classification as to having cancer or not.
Understanding the above can yield a strategy of multi-passes.
However, realistically single pass will often provide high
accuracy diagnostic (100%). The technology will report on the
confidence and therefore suggest the next steps.
Results and Discussion
The results as evidence are described. This includes training and testing using several technologies. A forest plot shows the comparative results with a clear data point. This is high accuracy and low training samples as shown. There are five external studies and one internal study described in this paper. Sections show confusion matrices [7,8]. In addition, sections describe external AI technology and advanced AI technology contributing to the significant result differentiation.
Forest Plot
A Forest Plot is used to present data efficiently for comparison. This is extracted from several Confusion Matrices shown later (Figure 4).

Figure 4: Forest Plot illustration. (Study-1,2,3,4,5 from external source [9]; Best source [10] )
Training should be executed with minimal slides that produce high accuracy. This is realistic because attaining sides from patients is uncomfortable and takes time. We arbitrarily chose to train with NCBI trusted worldwide data. 400 as the smallest quantity of training slides producing 100% correct predictions. Must train with balanced cancer and non-cancer samples. Best to train with as few slides as possible.
Consider that we could have biopsy slides. These slides are from someone who may have cancer or not. Consider that a software tool is used to guess whether these slides are from someone who has cancer or does not have cancer. If the guess is not always correct, then it does not matter how accurate the tool is less than 100%. A patient does not want to be told that they might have cancer, but not sure. Being sure of a diagnosis is essential.
For the software to function, the AI technology needs to be trained. Training is accomplished with slides that are known to come from people who have cancer and from people who do not have cancer. Training with many slides, we might expect high accuracy predictions.
The situation above is to be avoided as summarized:
• Training with many known slides is unrealistic.
• Guessing resulting in any inaccuracy is unacceptable.
The forest plot studies would normally show horizontal lines meant to indicate 95% confidence intervals. These are not reliable in this document because the data is unavailable and, as discussed, data with accuracy less than 100% is unacceptable.
Regarding studies labeled study, training data is from many slides as shown to the left of the red line. To the left indicates too many training slides and is unrealistic. As shown, the study labeled Best uses an acceptable 400 slides to train. Each study is shown next.
The red vertical line is the smallest quantity of slides producing 100% accurate predictions.
Forest Plot Conclusion
For comparison, the study labeled Best uses the technology described in this document (Figures 5-11).
Confusion Matrices below are Consolidated to a Single Forest Plot

Figure 5: Study Best; Confusion matrix of advanced technology is described in this paper. Trained with somewhat arbitrary 400 slides. With a proven accuracy of 100% as indicated with â??0â?ÂÂ, no FALSE predictions

Figure 6: Study-1; External data-set. Ridgenet using AlexNet, GoogLeNet, ResNet-50, VGG-19 using transfer learning, 1,000 features1`

Figure 7: Study-2; External data-set. Ridgenet using AlexNet, GoogLeNet, ResNet-50, VGG-19 using transfer learning, 2,000 features

Figure 8: Study-3; External dataset. Ridgenet using AlexNet, GoogLeNet, ResNet-50, VGG-19 using transfer learning, 3,000 features

Figure 9: Study-4; External dataset. Ridgenet using AlexNet, GoogLeNet, ResNet-50, VGG-19 using transfer learning, 4,000 features

Figure 10: Study-5; External dataset. Ridgenet using AlexNet, GoogLeNet, ResNet-50, VGG-19 using transfer learning, 5,000 features
How to Understand the Data above using an Example that is not the Technology of this Paper

Figure 11: Example showing that how to reading the numbers
How to Read the Numbers
Correct Predictions: The samples 15,266 and 39,455 are for correct predictions using a large number of samples needed to achieve correct predictions. This is unachievable and unrealistic.
However, the technology discussed in this paper uses far fewer samples to achieve correct predictions. Fewer samples are more realistic and achievable. This makes training easier.
Incorrect Predictions: 491 false positives and 292 false negatives showing poor accuracy.
However, the technology discussed in this paper has 0 incorrect predictions. This proves the claim of "100%".
Important: Goal is to achieve no negatives rather than try to achieve maximum correct.
Transfer Learning
Analysis of External Artificial Intelligence Accuracy (not eAI).
Studies 1,2,3,4,5 have claimed to show accuracy that appears high.
Transfer learning is necessary using Ridgenet using AlexNet, GoogLeNet, ResNet-50, VGG-19.
Comments: There are large and unrealistic quantity of samples used to train as opposed to eAI. The accuracy may seem high, but is still below eAI performance, and finally to following regarding their reliance of transfer learning which is not usable as discussed.
Summary
Transfer learning is rigorously studied.
This requires a manual process that needs "Fine-Tuning" for each and every Training session. This is unrealistic and is unusable. Our eAI cancer technology is entirely automated and not requiring fine-tuning. This makes it easier for a medically trained specialist and makes the tool safer for the patient.
The following is directly quoted for readers desiring details.
With the recent advances in deep convolutional neural networks (CNNs), there is a growing interest in applying this technology to medical image analysis. Specifically, in the field of cardiac Magnetic Resonance Imaging (MRI), deep CNNs are applied to the left ventricle (LV), right ventricle (RV), and myocardial segmentation for automatic quantification of ejection fraction and myocardial mass.
The segmentation step is typically preceded by the identification of a short axis slice range, which may require a manual procedure, as a stack of short axis cardiac MR images tends to include slices out of the LV coverage.
Results
Model training and validation: Figure 3 compares the training history of 5-fold cross-validation (CV) for each network in the fixed feature extraction setting. We plotted the history for the fixed learning rate of 10-4 to compare the convergence of each model. The VGG16 model showed an exceptionally fast convergence speed, followed by MobileNetV1.
InceptionResNetV2 and Xception showed noticeably slow convergence patterns. The Inception and ResNet models as well as MobileNetV2 showed a high degree of overfitting. We observed a high variance of loss and accuracy metrics across different folds. Among the 3 baseline models trained from scratch, CBR-LargeT achieved a very low loss on the training set, likely due to a relatively larger number of trainable parameters. The two smaller baseline models (i.e., CBR-Small and CBR-Tiny) did not exhibit patterns of a high degree of overfitting in the validation loss, although the loss curves showed a large degree of fluctuation with respect to epochs.
Dataset: In the present study, we used publicly available data from the left ventricular (LV) cardiac MRI segmentation challenge. The data consisted of cardiac cine image series of short axis and long axis orientations from 200 subjects, where there were 20-30 dynamic frames per slice and 10-16 slices per subject. Out of 20-30 dynamic frames, we only considered two frames: One end-systolic frame and one end-diastolic frame. The stacks of short axis slices from one group of 100 subjects were considered for training/validation, and the stacks of short axis slices from the other group of 100 subjects were considered for testing.
Data labeling: To label the images, we developed a custom user interface, implemented using the Matplotlib42 library for Python, for image slice labeling in a diastolic and a systolic frame for all subjects. The interface loads all the cardiac short axis image location information along with corresponding patient identification numbers. For labeling, the user interacts with the layout to classify each short axis slice into one of the following three categories:
• Out-of-apical (OAP)
• Apical-to-basal (IN)
• Out-of-basal (OBS)
OAP was defined as the slice that shows no appearance of the LV blood pool. IN was defined as the slice that shows clear appearances of the myocardium and LV blood pool. OBS was defined as the slice above the most basal slice, which is characterized by a small crescent of basal lateral myocardium and no discernible LV blood pool. The labeling results are saved upon closing the interface. They are saved in an internal metadata file, which is reloaded when the user resumes the manual labeling task.
Image preprocessing and augmentation: The sample size of the IN class is significantly larger than the OAP and OBS classes. To overcome the class imbalance issue, we oversampled the slices corresponding to the OAP and OBS classes by a factor of 6. We used a simple augmentation scheme, which applied random rotations between −45° and 45° for each image [9]. The classification task involves the examination of the myocardium, which is positioned around the center of the images. To reduce unwanted features in the image data, we cropped the outer 40% of both the vertical and horizontal axes of each image. The image cropping retained the myocardial region of interest in all of the images. To prevent data leakage, the augmentation was applied after the data split for the cross-validation. For the evaluation, we applied the same procedure of cropping to the input images.
Model training and validation: We considered nine wellestablished CNN architectures for transfer learning. The networks considered in our study, including their capacities, the number of penultimate features, and the ImageNet accuracy scores. We applied transfer learning to cardiac MR images in the fixed feature extraction and fine-tuning settings. For the fixed feature extraction setting, we used the penultimate features from the convolutional base of the nine CNN models as an input to a custom deep neural network (DNN) classifier. For the finetuning setting, we considered only a subset of convolutional layers, following the suggestion of a layer-wise fine-tuning scheme proposed in Tajbakhsh et al. We also trained three baseline models from scratch for comparison. We adopted models from the CBR (convolution, batch-normalization, ReLU activation) family of CNN architectures introduced in Raghu et al. which follows conventional design of CNN architectures. We considered the CBR-LargeT, CBR-Small, and CBR-Tiny models, which are small in network, size (approximately 1/3 to 1/60 of the size of standard deep CNN architectures used for ImageNet classification).
All pre-trained CNN models take natural images, with three color channels, as input, but our study deals with grayscale MRI images. For compatibility, we simply duplicated the grayscale channel to synthesize RGB images. This has the same effect as averaging out the color channels of the convolutional kernels in the first convolutional layer of each network. In the fixed feature extraction setting, we appended our custom DNN classifier to the existing base networks and froze the base convolutional layers during training. We removed the existing fully connected classifier layers and replaced them with a DNN classifier. The DNN classifier consisted of a dense layer with 256 nodes and ReLU activation, a dropout layer with a dropout rate of 0.5, and a dense layer with 3 nodes and Softmax activation. The final layer has three output nodes that correspond to the three classes in our classification task: OAP, IN, OBS. We used pre-trained weights provided by the Keras Applications library.
We used a similar approach for the fine-tuning setting, where we unfroze only those layers considered for further training. We applied fine-tuning to all nine base architectures, using the final models obtained from the fixed feature extraction stage. We selected the layers for fine-tuning based on the individual designs of the base architectures. All architectures are comprised of a series of unique convolutional blocks. We considered the last convolutional block of each network for fine-tuning. The diagrams of the last convolutional blocks for the nine neural networks are shown in the Supplementary Material.
Model development was performed on a single GPU (NVIDIA Quadro P5000, 16 GB memory). To train the network, we used mini-batch gradient descent optimization with a batch size of 32, a decay of 10-6, and Nesterov momentum of 0.9. For hyperparameter optimization, we considered three learning rates. Learning rates were 10-2, 10-3, and 10-4 for the fixed feature extraction setting, while they were 10-3, 10-4, and 10-5 for the fine-tuning setting. For our baseline CBR models, we considered learning rates of 10-2, 10-3, and 10-4.
For a given learning rate, we performed a 5-fold cross-validation and divided the training/validation set into 5 distinct subsets, each containing image slices from 20 patients. For each fold, one subset was used for validation and the remaining four were used for training. Hence, a total of 5 models were trained and validated to evaluate the performance of a single parameter choice. We trained each model for 50 epochs and selected an appropriate epoch number based on manual inspection of the average validation accuracy curve. After setting the epoch number and learning rate, we trained a final model on the entire training/validation set. We used this process in both the fixed feature extraction and fine-tuning settings for the deep CNN models, as well as in the training of the baseline CBR models.
Evaluation: A total of 21 final models were evaluated: 9 models obtained by training a custom DNN classifier on top of base CNNs used for the fixed feature extraction setting, and 9 models obtained through the fine-tuning, and 3 baseline models trained from scratch. Performance was evaluated against a test dataset of 100 patients that was held out during the model development. The total number of test images per class. To evaluate multi-class classification performance, we used the following metrics: F1 score, accuracy, micro-averaged AUC score, and soft accuracy. We defined soft accuracy as an alternative measure of accuracy, where each prediction is considered correct if it matches the class of the current slice or either of the adjacent slices. We introduced this metric to account for the inherent inter-observer variability in slicerange classification. Given a continuous set of short axis MRI slices, the task of determining N slice ranges is equivalent to determining N-1 boundaries. During the slice classification, we noticed that misidentifying these boundaries by one slice often yields acceptable results. Manual inspection of incorrect model predictions revealed that most errors fell into the boundary cases.
Standard Artificial Intelligence Solution
Images on the left of the diagram are cleansed before training. Omitting unusable images that would reduce accuracy of trained data (Figure 12).

Figure 12: Neural network. The input nodes are images. The output, shown as selection indicating â??cancerâ? or â??not cancerâ? (sometimes referred to as healthy)
This reduces training size to instead of arbitrarily increasing samples for no apparent reason.
The AI-ML model is defined in the algorithm-nominally using any: Python (preferable by authors), R, Rust, Julia, or PyTorch.
During one-time training, this neural model utilizes backpropagation. The well-known recursive calculation is a standard method to determine weights.
The weights are used after one-off training which is classifications. Then, "prediction" is used to provide the outputs "cancer" or "not cancer" (which is sometimes referred to as "healthy" where the understanding is that the patient may have other health related issues). Unlimited predictions can be performed.
The training phase uses back propagation in general as follows.
For the training phase, the neural model is given known inputs as images in order to adjust the weights accordingly.
The calculations are simplified as follows. Note confidentiality due to modifying backpropagation processing:
(AI) ML Model
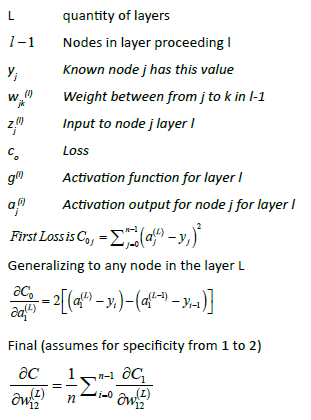
The model drives the core AI-ML engine. The model defines various parameters: Loss, optimiser, metrics, activation, convolution, pooling, cross entropy (Table 1).
(AI) ML Training Goal
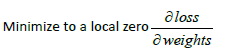
When the back propagation has backed to the input nodes or the data from scanned images then the weights are adjusted to a local zero.
Rights to left, backward, as shown in the illustration output to input.
The process is repeated for all nodes where the iterations are termed epochs.
Upon completion, of this one-time training phase the model can be used to "predict" the selection based on the data from image slides without the model knowing the correct selection.
Table 1: (AI) ML Model
|
Convolution
|
|
Dimensions (1D, 2D, 3D)
Kernel Matrix (3 × 3 or 5 × 5 typically)
Stride
|
|
|
Loss
Probabilistic losses
BinaryCrossentropy class
CategoricalCrossentropy class
SparseCategoricalCrossentropy class
Poisson class
binary_crossentropy function
categorical_crossentropy function
sparse_categorical_crossentropy function
poisson function
KLDivergence class
kl_divergence function
Regression losses
MeanSquaredError class
|
MeanAbsoluteError class
MeanAbsolutePercentageError class
MeanSquaredLogarithmicError class
CosineSimilarity class
mean_squared_error function
mean_absolute_error function
mean_absolute_percentage_error function
mean_squared_logarithmic_error function
cosine_similarity function
Huber class
huber function
LogCosh class
log_cosh function
|
|
Hinge losses for "maximum-margin" classification
Hinge class
SquaredHinge class
CategoricalHinge class
hinge function
squared_hinge function
categorical_hinge function
|
Activation
ReLU layer
Softmax layer
LeakyReLU layer
PReLU layer
ELU layer
ThresholdedReLU layer
|
Enhanced Artificial Intelligence-eAI
The enhancements topologically are shown in the context of the standard A.I. model. The well-known, standard model is not critical. Hidden layers utilize convolution neural networks (CNN) (Figure 13).

Figure 13: Neural network with advanced artificial intelligence enhancements indicated by patterned box representing proprietary internal software
As described, training is by severing these sample sets. This enables the training phase. This eliminates the risk of overfitting. The severed samples are known outputs only for these training phases. After training, the prediction-test phase uses the adjusted weights. Advanced AI enhancements include processing for the high accuracy prediction phase. Prediction results are measured by using the severed samples.
The severed fully unknown samples show 100% accuracy. Many retests agree by using randomized samples with different slices. The severed samples are recalculated. Varying sizes are used to test for repeatability.
The testing phase includes standard well-known standard training and prediction topologies (Appendix). The prior charts indicate the measurements of less than 100% compared to genuinely 100% accurate utilizing the advanced enhancements. Compared to standard topology results are in the range of 78% to 84% accuracies (Figure 14).
Neural Model Components

Figure 14: Neural model illustration with details
Conclusion
Cancer screening enables early detection of disease and
optimizes treatment outcome for the patient. In addition to
humanitarian altruism bias, there are significant business
incentives in using AI technology for screening. Early treatments
save money, use cheaper equipment, fewer specialist doctors,
shorter treatment periods and reduced recurrence rates.
This translates to significant savings for both the NHS and the
taxpayer. Breast cancer one of the fastest growing tumors,
this means that the faster it can be diagnosed, the greater the
reduction in morbidity and mortality.
Addressing the fastest growing and most lethal forms of breast
cancer is the need justifying this business’s advanced innovative
artificial intelligence technology. Accurately diagnosing cancer
screening as early as improves morbidity and mortality
possibly enables early treatment enabling increase in chances
of survival and avoiding the need for surgery and high-cost
reconstruction.
This technology directly reflects the intentional laid out scan
differentiate the NHS Five Year Plan and Long-Term Plan by
addressing the delays in cancer diagnosis (reference to 5-year
plan) huge lists of patients and define those who conclusively have cancer.
Data processed by this technology can represent images
including but not limited to medical sides.
This technology has demonstrated high accuracy in
differentiating healthy from cancerous cells on digitized
histopathology images. This level of accuracy has not been
matched. In addition, our solution is fast and inexpensive. This
technology can be applied to detection of many cancers or, for
that matter, other medical diagnosis.
Potential user can test the technology without relying on
this evidence paper. We invite potential users to test this
technology. A potential user submits several image files. Under
some conditions, no retraining is required.
Some images would be labeled for our feedback. Some would
only be known by the potential user and not us. We send
back to the potential user the best prediction of the unknown
images for them to inspect. This method is easy to implement,
and the potential user can clearly judge that the technology
works. It is controlled by the potential user. It relies on their
potential user’s own data.
Acknowledgement
We wish to thank each participant that took part in this
project. We also give our gratitude to Dr. Tiffany Panko, Jenna
Stewardson, and Deaf Healthcare and Biomedical Sciences
Hub for their support of this project. In addition, we appreciate
the ASL interpreters that helped transcribe our interviews: Kat
Womack, Emily Young, and Sydney Roy.
Conflict Of Interest
There are no conflicts of interest.
References
- Breast Cancer Screening (PDQ®) (2023) Health professional version. National Library of Medicine
- Heath J, Paulishak M, Kasales C, Schubart J, Kass R (2019) Reasons symptomatic breast cancer patients delay seeking medical care. J Unexplored Med Data. 4:3.
[Crossref] [Google Scholar]
- Pathologists shortage 'delaying cancer diagnosis'.
- Machine learning in cancer diagnostics (2019) EBioMedicine. 45:1-2.
[Crossref].
- Togacar M, Ergen B, Comert Z (2020) Application of breast cancer diagnosis based on a combination of convolutional neural networks, ridge regression and linear discriminant analysis using invasive breast cancer images processed with autoencoders. Medical Hypotheses. 135:109503.
[Crossref] [Google Scholar]
- Yeong J, Thike AA, Tan PH, Iqbal J (2017) Identifying progression predictors of breast ductal carcinoma in situ. J Clin Pathol. 70(2):102-108.
[Crossref] [Google Scholar]
- Ho N, Kim YC (2021) Evaluation of transfer learning in deep convolutional neural network models for cardiac short axis slice classification. Sci Rep. 11(1):839.
[Crossref] [Google Scholar]
- Weller D, Vedsted P, Rubin G, Walter FM, Emery J, et al. (2012) The Aarhus statement: Improving design and reporting of studies on early cancer diagnosis. Br J Cancer. 106(7):1262-1267.
[Crossref] [Google Scholar]
- Olesen F, Hansen RP, Vedsted P (2009) Delay in diagnosis: The experience in Denmark. Br J Cancer. 101(Suppl 2):S5-S8.
[Crossref] [Google Scholar]
Citation: Herman D, Hunter C, Leon GAS (2023) Cancer Detection Using Innovative Advanced Artificial Intelligence. J Healthc Commun. 8:8050.
Copyright: © 2023 Herman D, et al. This is an open-access article distributed under the terms of the Creative Commons Attribution License, which permits unrestricted use, distribution, and reproduction in any medium, provided the original author and source are credited.