Keywords
Differentially expressed genes; Functional enrichment analysis; Proteinprotein interactions; Biomarker; tMLL; Acute myeloid leukemia
Abbreviations
ACTR2: Actin Related Protein 2 Homolog; AML: Acute Myeloid Leukemia; ARPC3: Actin Related Protein 2/3 Complex subunit 3; ARPC5: Actin Related Protein 2/3 Complex subunit 5; BCR: BCR activator of RhoGEF and GTPase ; BP: Biological Process; CC: Cell Component; CTTN: Cortactin; CXCR4: C-X-C motif chemokine Receptor 4; DAVID: Database for Annotation, Visualization and Integrated Discovery; DEGs: Differentially Expressed Genes; GEO: Gene Expression Omnibus; GO: Gene Ontology; HOXB: Homeobox B; ISN: Insulin Signaling Network; KEGG: Kyoto Encyclopedia of Genes and Genomes; MCODE: Molecular Complex Detection; MF: Molecular Function; MLL: Mixed-Lineage Leukemia gene; MRC2: Mannose Receptor C, type 2; mTOR: Mammalian Target protein Rapamycin; PM: Plasma Membrane; PPI: Protein-Protein Interaction; PTD: Partial Tandem Duplication; RUNX2: RUNX family transcription factor 2; STRING: Search Tool for the Retrieval of Interacting Genes/Proteins.
Introduction
Acute Myeloid Leukemia (AML) belongs to a class of highly heterogeneous hematologic malignancies, involving the abnormal proliferation of protocells in peripheral blood and bone marrow. The majority of AML patients bear abnormal chromosomal karyotypes. Cytogenetic abnormalities such as chromosomal translocations involving the mixed-lineage leukemia gene (MLL) are associated with a poor prognosis for AML patients [1]. A small subset of AML patients develops treatment-induced secondary leukemias, in which the MLL gene may be rearranged to generate Partial Tandem Duplication (PTD), amplification, or fused to a partner gene through a chromosomal translocation (tMLL) [2]. MLL was shown to be involved in more than 100 repeated translocations, mainly implicating nine translocation partners (AF4, AF9, ENL, AF10, AF6, ELL, AF1P, AF17 and SEPT6), accounting for almost 90% of total MLL rearrangements. It was reported that 15%-20% of all pediatric AML cases were caused by chromosome 11q23 translocations [3]. Moreover, acute leukemias harboring MLL translocations accounted for 10% of all acute leukemias in humans [4]. The presence of an MLL rearrangement is predictive of early relapse and an extremely poor prognosis in relation to many other types of leukemia [5-8].
Armstrong SA and his colleagues demonstrated that MLL translocations are associated with a distinct gene expression profile, distinguishable from typical AML [9]. It was reported that the gene expression characteristics common to MLL rearranged in AML patients can identify abnormal genes related to MLL translocation specificity [10]. Based on gene expression profiling, tMLL was shown to be a distinct subtype of AML. It was demonstrated that MLL fusion genes were different in MLL-PTD that displayed molecular heterogeneity, and a clear expression signature was identified for cases with MLL chimeric fusion genes, irrespective of lineage. However, no significantly distinct clustering was determined for the MLL-PTD and tMLL subtypes of AML [11]. Given these findings, we performed bioinformatics analysis to explore whether there were any Differentially Expressed Genes (DEGs) between the two subsets of AML described, rather than defining separate expression signatures for tMLL and MLL-PTD.
With the development and the pervasive application of microarray technology, gene expression profiling analyses have become extremely valuable in biological research. Huge data sets can be generated, capable of providing abundant high-throughput data for gene mining. Bioinformatics analysis represents a powerful tool for the comprehensive analysis of cancer-associated genes. In this study, we aimed to identify DEGs by comparing MLL-PTD and tMLL data from the GEO database. Functional and pathway enrichment analyses were applied to explain the main characteristics. By analyzing the Protein-Protein Interaction (PPI) network, hub genes were identified and the underlying signaling pathways were explored. Our data could potentially contribute to the identification of novel prognostic factors and inform new treatment options for AML patients bearing MLL translocation.
Methods
Gene expression profile data
The gene expression profile dataset (GSE15013) was downloaded from the Gene Expression Omnibus database (https://www.ncbi.nlm.nih.gov/geo/). The gene expression profile was based on the GPL570 platform (Affymetrix Human Genome U133 Plus 2.0 Array, Agilent Technologies, Santa Clara, CA, USA). The GSE15013 dataset contained a total of 25 samples, including 10 taken from AML patients with tMLL, and 15 taken from AML patients with MLL-PTD. These samples were divided into two groups in order to select for DEGs using GEO2R online software.
Data processing
GEO2R (https://www.ncbi.nlm.nih.gov/geo/geo2r/) performs comparisons between original submitter-supplied processed data tables, using the GEO query and limma R packages from the Bioconductor project, to identify DEGs across experimental conditions. In this study, GEO2R was used to analyze the DEGs in the comparison between tMLL and MLL-PTD samples. P-value<0.01 and |logFC|≥1 were set as threshold conditions for DEG selection.
GO ontology and KEGG pathway enrichment analysis
The Database for Annotation, Visualization and Integrated Discovery (DAVID, Version 6.8, https://david.ncifcrf.gov/) is a public online tool for functional annotation and enrichment analysis, used to reveal biological functions of large lists of genes. In order to determine the function of the DEGs we had identified, Gene Ontology (GO) and the Kyoto Encyclopedia of Genes and Genomes (KEGG) pathway enrichment analysis features of the DAVID tool were used. P-values<0.05 were considered as statistically significant.
PPI network generation and module analysis
Protein-Protein Interaction (PPI) networks for the identified DEGs were generated using the Search Tool for the Retrieval of Interacting Genes/Proteins (STRING, https://string-db.org/). STRING is a biological database and web resource of known and predicted protein–protein interactions, which can help to systematically deconvolute cellular processes. Herein, an interaction score of >0.7 (high confidence) was considered as a cut-off standard. The PPI network was visualized using Cytoscape (Version 3.5.0, https://www.cytoscape.org/), an open source bioinformatics platform for visualizing molecular interaction networks, and using in combination with gene expression profiles and other type of data, and re-checked the nodes in PPI network by several algorithms on CytoHubba. Hub genes were ranked by twelve different algorithms on CytoHubba. We screened out the top 32 genes with a high degree of connectivity by MCC and labeled them hub genes. To analyze the potential module relationships within the PPI network, we mapped the PPI network onto Cytoscape and used Cytoscape’s Molecular Complex Detection (MCODE) application. The MCODE analysis was used to screen out modules from the PPI network with a degree cutoff=2, node score cutoff=0.2, k-score=2 and max. depth=100. GO ontology and KEGG pathway analyses were also made to inform module discoveries.
Results
Identification of DEGs
GEO2R analysis showed that a total of 885 DEGs were extracted from the GSE15013 dataset, comprising 330 upregulated and 555 downregulated genes. The top ten most significantly upregulated DEGs were MECOM, SENP6, AK2, F12, KCTD15, XAGE1B/// XAGE1E, APOC4-APOC2///APOC4///APOC2, PYGM, LOC401068 and ADGRG6, while the top ten most significantly downregulated DEGs were DST, KMT2A, NPR3, LCA5, LINC00982, FNBP1L, CDH4, NPR3, NFIX and TNFRSF21 (Table 1).
| |
ID |
Gene Symbol |
Log FC |
P-Value |
| Upregulated |
226420_at |
MECOM |
5.904 |
1.51E-07 |
| 214790_at |
SENP6 |
1.7 |
1.81E-06 |
| 212173_at |
AK2 |
1.277 |
8.17E-06 |
| 205774_at |
F12 |
1.632 |
1.11E-05 |
| 222664_at |
KCTD15 |
2.786 |
1.28E-05 |
| 220057_at |
XAGE1B///XAGE1E |
4.801 |
2.04E-05 |
| 204561_x_at |
APOC4-APOC2///APOC4///APOC2 |
4.647 |
2.69E-05 |
| 205577_at |
PYGM |
2.162 |
2.81E-05 |
| 1557754_at |
LOC401068 |
2.49 |
2.95E-05 |
| 233887_at |
ADGRG6 |
3.679 |
3.52E-05 |
| Downregulated |
204455_at |
DST |
-2.884 |
3.80E-07 |
| 226981_at |
KMT2A |
-1.405 |
4.86E-07 |
| 219789_at |
NPR3 |
-4.09 |
5.11E-07 |
| 229953_x_at |
LCA5 |
-3.696 |
5.42E-07 |
| 236360_at |
LINC00982 |
-2.594 |
6.08E-07 |
| 215017_s_at |
FNBP1L |
-2.828 |
7.41E-07 |
| 206866_at |
CDH4 |
-3.064 |
1.14E-06 |
| 219054_at |
NPR3 |
-3.49 |
2.04E-06 |
| 227400_at |
NFIX |
-2.655 |
2.60E-06 |
| 218856_at |
TNFRSF21 |
-2.732 |
3.33E-06 |
Abbreviations: DEGs: Differentially Expressed Genes; AML: Acute Myeloid Leukemia; tMLL: Mixed-Lineage Leukemia gene with translocation; MLL-PTD: Mixed-Lineage Leukemia gene with a Partial Tandem Duplication; FC: Fold Change; MECOM: MDS1 and EVI1 complex locus; SENP6: SUMO specific peptidase 6; AK2: Adenylate Kinase 2; F12: coagulation factor XII; KCTD15: potassium channel tetramerization domain containing 15; XAGE1B///XAGE1E: X antigen family member 1B///X antigen family member 1E; APOC4-APOC2///APOC4///APOC2: APOC4-APOC2 readthrough (NMD candidate) ///apolipoprotein C4/// apolipoprotein C2; PYGM: glycogen phosphorylase, muscle associated; LOC401068: uncharacterized LOC401068; ADGRG6: Adhesion G protein-coupled receptor G6; DST: Dystonin; KMT2A: lysine methyltransferase 2A; NPR3: Natriuretic Peptide Receptor 3; LCA5: LCA5, lebercilin; LINC00982: Long Intergenic Non-protein Coding RNA 982; FNBP1L: Formin Binding Protein 1 like; CDH4: Cadherin 4; NPR3: Natriuretic Peptide Receptor 3; NFIX: Nuclear Factor IX; TNFRSF21: TNF receptor superfamily member 21.
Table 1: The most significantly upregulated and downregulated DEGs in tMLL-bearing AML samples (top ten are shown for each type of DEGs, tMLL versus MLL-PTD, p-value<0.01).
GO function and KEGG pathway enrichment analysis
The GO Biological Process (BP) function of the DAVID tool revealed that the upregulated DEGs were significantly enriched in calcium ion transmembrane transport, cilium assembly and osteoblast differentiation processes. The downregulated DEGs were mainly involved in hematopoiesis, cell proliferation, apoptosis, angiogenesis, phosphorylation of adhesion proteins, signal transduction, bone formation and gene expression regulation processes. For the GO Cell Component (CC) analysis, the upregulated DEGs were significantly enriched in cytoskeleton components, while the downregulated DEGs were distributed throughout the cell. The analysis of Molecular Function (MF) revealed that, the upregulated DEGs were significantly enriched in genes with roles in cell energy, metabolism maintenance, and calcium ion binding, while the downregulated DEGs were involved in collagen binding, calcium ion binding, metal ion binding and transcriptional activity. Data from GO functional enrichment analyses of upregulated and downregulated DEGs are shown in (Tables 2 and 3), respectively.
| Category |
Term |
Count |
P-Value |
| BP |
|
| GO:0070588~calcium ion transmembrane transport |
8 |
0.000702436 |
| GO:0042384~cilium assembly |
6 |
0.019114071 |
| GO:0001649~osteoblast differentiation |
5 |
0.040364225 |
| CC |
|
| GO:0002102~podosome |
4 |
0.002693786 |
| GO:0005905~clathrin-coated pit |
5 |
0.003948801 |
| GO:0030478~actin cap |
2 |
0.046153863 |
| MF |
|
| GO:0005262~calcium channel activity |
5 |
0.01125974 |
| GO:0005509~calcium ion binding |
16 |
0.034628231 |
| GO:0030246~carbohydrate binding |
7 |
0.036097492 |
| GO:0004522~ribonuclease A activity |
2 |
0.048843496 |
Abbreviations: GO: Gene Ontology; DEGs: Differentially Expressed Genes; BP: Biological Process; CC: Cell Component; MF: Molecular Function.
Table 2: GO functional enrichment analysis of upregulated DEGs (p-value<0.05).
| Category |
Term |
Count |
p-value |
| BP |
|
| GO:0048704~embryonic skeletal system morphogenesis |
8 |
0.000010698 |
| GO:0008283~cell proliferation |
20 |
0.000153053 |
| GO:0030198~extracellular matrix organization |
14 |
0.000165077 |
| GO:0045944~positive regulation of transcription from RNA polymerase II promoter |
36 |
0.000659188 |
| GO:0001525~angiogenesis |
13 |
0.001835319 |
| CC |
|
| GO:0005887~integral component of plasma membrane |
56 |
0.000020763 |
| GO:0005886~plasma membrane |
116 |
0.00002489 |
| GO:0009986~cell surface |
27 |
0.000030858 |
| GO:0045211~postsynaptic membrane |
12 |
0.003224684 |
| GO:0070062~extracellular exosome |
74 |
0.007621354 |
| MF |
|
| GO:0005518~collagen binding |
6 |
0.007546994 |
| GO:0005509~calcium ion binding |
25 |
0.012526355 |
| GO:0046872~metal ion binding |
57 |
0.016719123 |
| GO:0003700~transcription factor activity, sequence-specific DNA binding |
30 |
0.023490364 |
| GO:0001077~transcriptional activator activity, RNA polymerase II core promoter proximal region sequence-specific binding |
11 |
0.023632956 |
Abbreviations: GO: Gene Ontology; DEGs: Differentially Expressed Genes; BP: Biological Process; CC: Cell Component; MF: Molecular Function.
Table 3: GO functional enrichment analysis of downregulated DEGs (top five are shown for each category, p-value<0.05).
Additionally, KEGG pathway enrichment analysis showed that the upregulated DEGs were mainly associated with the insulin signaling pathway. The down regulated DEGs however, were enriched in twelve pathways, such as those involved in hematopoietic cell lineage development and PI3K-Akt signaling (Table 4).
| Category |
Term |
Description |
Count |
P-Value |
| Upregulated |
|
| hsa04910 |
Insulin signaling pathway |
5 |
0.049250182 |
| Downregulated |
|
| hsa04640 |
Hematopoietic cell lineage |
9 |
0.000780907 |
| hsa05200 |
Pathways in cancer |
18 |
0.007980125 |
| hsa04512 |
ECM-receptor interaction |
7 |
0.01420232 |
| hsa04974 |
Protein digestion and absorption |
7 |
0.014962551 |
| hsa04810 |
Regulation of actin cytoskeleton |
11 |
0.021577969 |
| hsa04151 |
PI3K-Akt signaling pathway |
15 |
0.025592846 |
| hsa05100 |
Bacterial invasion of epithelial cells |
6 |
0.032323678 |
| hsa05205 |
Proteoglycans in cancer |
10 |
0.039012569 |
| hsa04666 |
Fc gamma R-mediated phagocytosis |
6 |
0.042460154 |
| hsa04727 |
GABAergic synapse |
6 |
0.04431619 |
| hsa04510 |
Focal adhesion |
10 |
0.045668072 |
| hsa04144 |
Endocytosis |
11 |
0.048546008 |
Abbreviations: KEGG: Kyoto Encyclopedia of Genes and Genomes; DEGs: Differentially Expressed Genes.
Table 4: KEGG pathways enrichment analysis of DEGs (p-value<0.05).
PPI network generation and Hub gene identification
Using STRING analysis, a total of 520 PPI relationships between identified DEG products were obtained (Figure 1). A threshold degree >15 for the default filter was set to identify key genes. Using Cytoscape to visualize the PPI network analysis, 32 hub genes were selected, including ACTR2, ARPC3, ARPC5, CTTN, FNBP1L and APP (Figure 2).
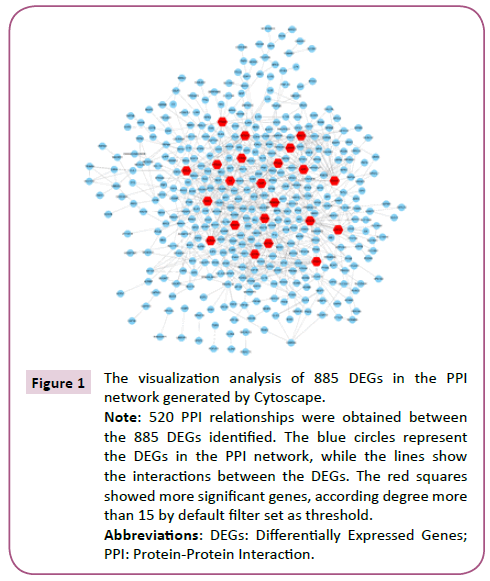
Figure 1: The visualization analysis of 885 DEGs in the PPI network generated by Cytoscape.
Note: 520 PPI relationships were obtained between the 885 DEGs identified. The blue circles represent the DEGs in the PPI network, while the lines show the interactions between the DEGs. The red squares showed more significant genes, according degree more than 15 by default filter set as threshold.
Abbreviations: DEGs: Differentially Expressed Genes; PPI: Protein-Protein Interaction.
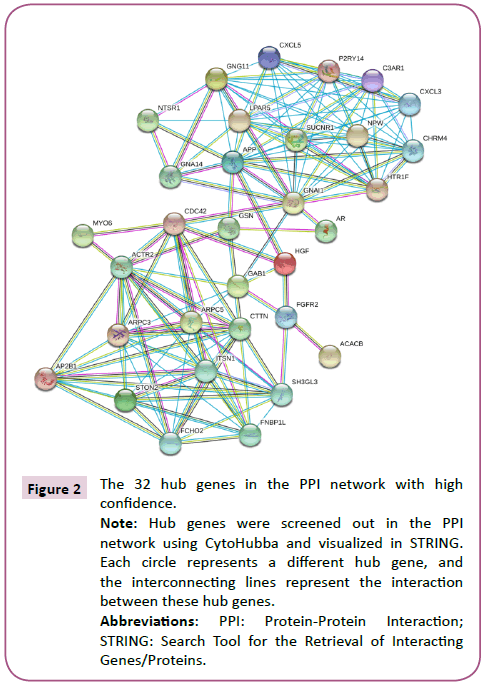
Figure 2: The 32 hub genes in the PPI network with high confidence.
Note: Hub genes were screened out in the PPI network using CytoHubba and visualized in STRING. Each circle represents a different hub gene, and the interconnecting lines represent the interaction between these hub genes.
Abbreviations: PPI: Protein-Protein Interaction; STRING: Search Tool for the Retrieval of Interacting Genes/Proteins.
Module analysis
In order to detect significant modules in the PPI network, we used the MCODE plug-in. The top two significant modules in MCODE with a score of ≥ 10 and nodes ≥ 10 were selected from the PPI network, including Module A (MCODE score=13.00 with 13 nodes) and Module B (MCODE score=12.11 with 19 nodes) (Figure 3). Biological process enrichment analysis performed using DAVID software revealed that Module A was involved mainly in endocytosis, the ephrin receptor signaling pathway, positive regulation of actin filament polymerization and, the cell projection morphogenesis process. Meanwhile, Module B was largely associated with signal transduction, cellular communication, and cellular response to stimuli, inflammatory responses, platelet activation and the coagulation process (Figure 4). KEGG pathway enrichment analysis showed that these two modules were for the most part connected with bacterial invasion of epithelial cells, endocytosis, and calcium and chemokine signaling pathways (Figure 5).
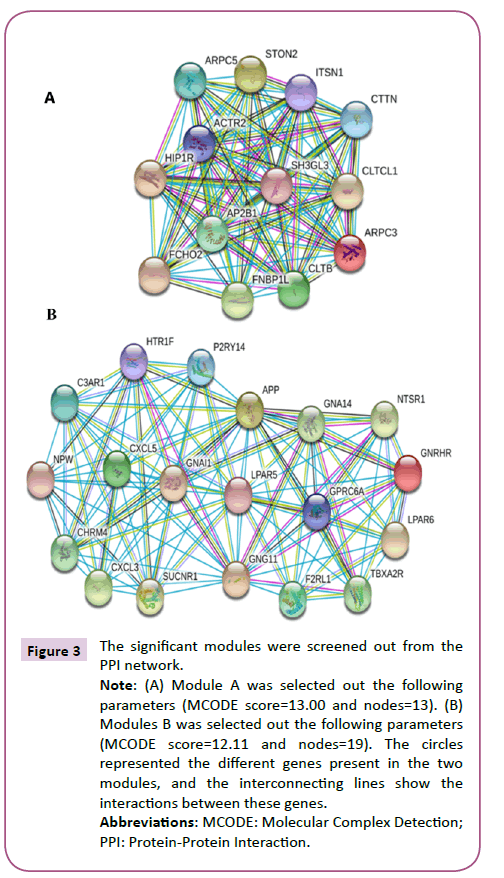
Figure 3: The significant modules were screened out from the PPI network.
Note: (A) Module A was selected out the following parameters (MCODE score=13.00 and nodes=13). (B) Modules B was selected out the following parameters (MCODE score=12.11 and nodes=19). The circles represented the different genes present in the two modules, and the interconnecting lines show the interactions between these genes.
Abbreviations: MCODE: Molecular Complex Detection; PPI: Protein-Protein Interaction.
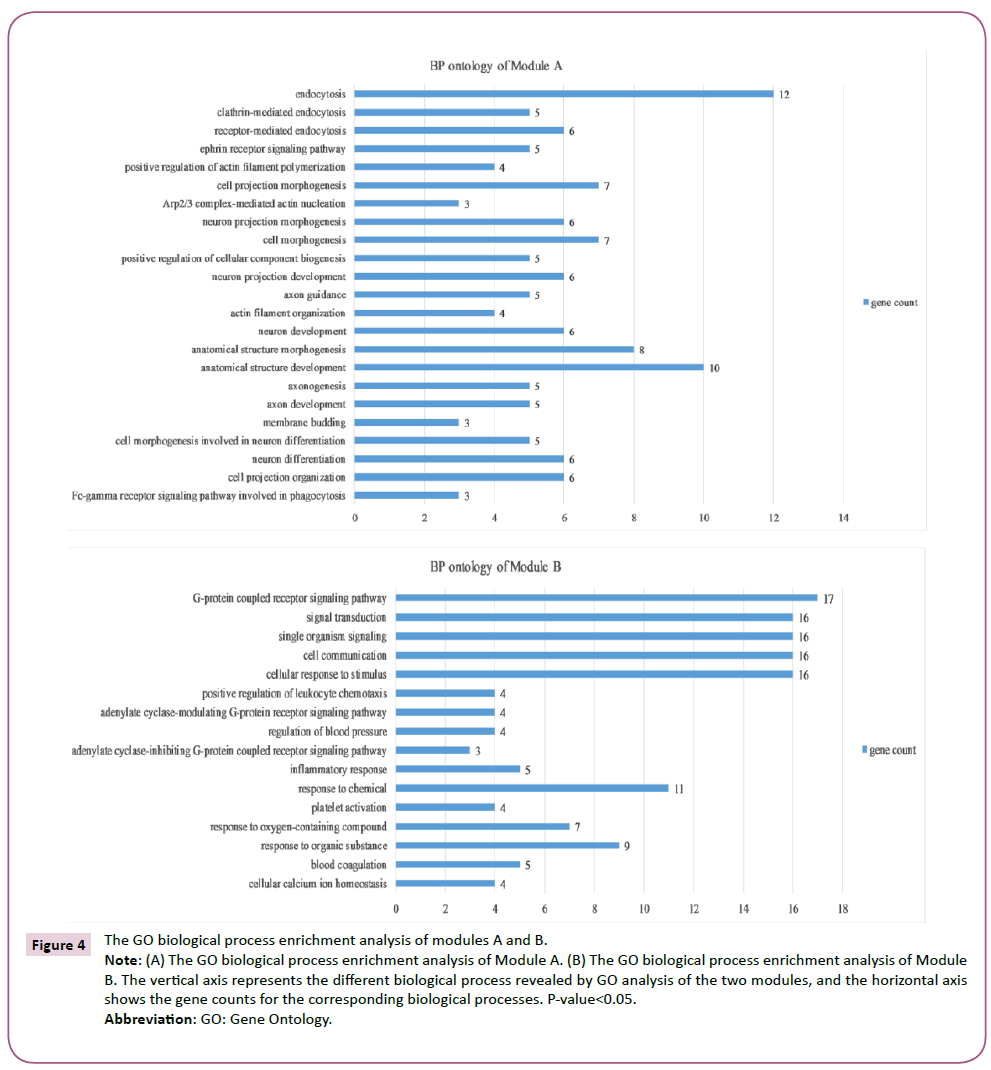
Figure 4: The GO biological process enrichment analysis of modules A and B.
Note: (A) The GO biological process enrichment analysis of Module A. (B) The GO biological process enrichment analysis of Module B. The vertical axis represents the different biological process revealed by GO analysis of the two modules, and the horizontal axis shows the gene counts for the corresponding biological processes. P-value<0.05.
Abbreviation: GO: Gene Ontology.
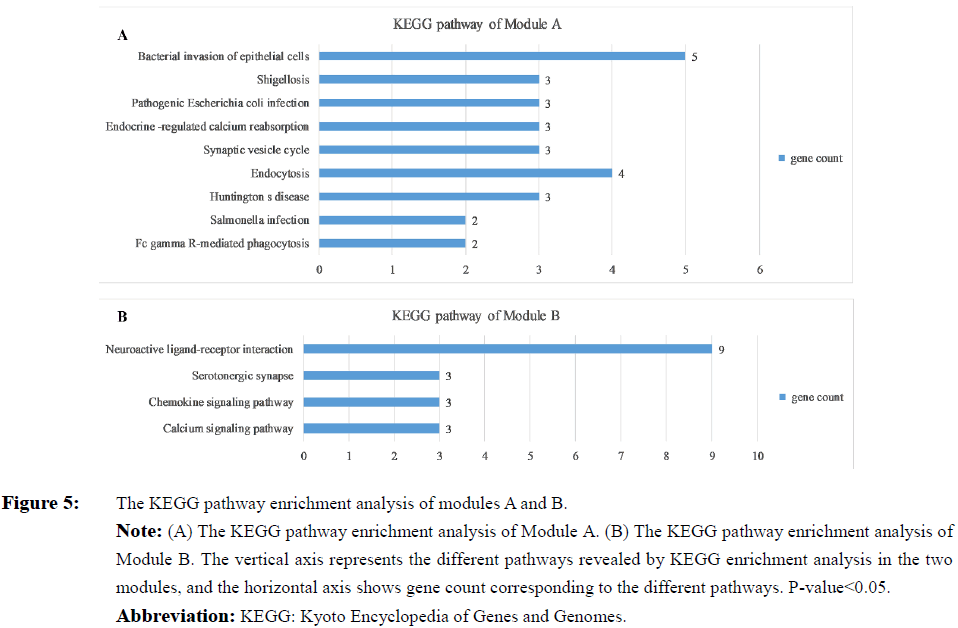
Figure 5: The KEGG pathway enrichment analysis of modules A and B.
Note: (A) The KEGG pathway enrichment analysis of Module A. (B) The KEGG pathway enrichment analysis of Module B. The vertical axis represents the different pathways revealed by KEGG enrichment analysis in the two modules, and the horizontal axis shows gene count corresponding to the different pathways. P value<0.05.
Abbreviation: KEGG: Kyoto Encyclopedia of Genes and Genomes.
Discussion
In recent years, there has been an increased emphasis on individualized and targeted therapy for Acute Myeloid Leukemia (AML) patients. However, the potential for chromosoma mutation and recombination processes (such as demonstrated by 11q23, t (6;9), and other genetic abnormalities) has meant that, the prognosis for AML patients remains poor and existing treatments still lack efficacy [12]. Even with the arrival of improved treatment options such as allogeneic hematopoietic stem cell transplantation, the translocation of the mixed-lineage leukemia (tMLL) gene presents a huge challenge in the treatment of leukemia. AML patients harboring tMLL typically receive a relatively poor prognosis and are at an elevated risk of early relapse. It is therefore important to explore the mechanisms of tMLL in AML for the development of novel therapeutic strategies. Recently, gene expression profiling analysis has been widely used to reveal abnormal gene expression patterns related to AML, with the aim of identifying novel diagnostic and therapeutic targets.
In this study, 15 MLL-PTD and 10 tMLL-AML patient samples were selected from the GEO dataset of GSE15013. As a result, 885 DEG genes were identified, including 330 upregulated and 550 downregulated genes. To further understand the characters of these DEGs, we conducted GO functional and KEGG pathway analyses.
The functional enrichment analysis showed that the upregulated and downregulated DEGs were enriched in different roles in cell life processes. Among the genes in upregulated DEGs functional enrichment, mannose receptor C, type 2 (MRC2) is related to collagen turnover and cancer prognosis, and have been confirmed it played a vital role in Foxp3+ regulatory T cells in local dysfunctional immune environment [13]. Kuo YH and his colleagues discovered back in 2009 that RUNX2 could be induced acute myeloid leukemia in cooperation with Cbfβ-SMMHC in mice [14]. Subsequently, Schnerch et al. [15] reported RUNX2 was upregulated during leukemogenesis in an AML patient with an inherent RUNX2 haploinsufficiency and cleidocranial dysplasia. These insightful research findings along with microarray data point to an important role for RUNX2 in the development and progression of AML. Nevertheless, among the genes in downregulated DEGs functional enrichment, HOXB gene seemed to play an important role in biological processes. HOX homeobox genes play a role in both the early stem cell function as well as in later stages of hematopoietic differentiation, and that perturbations of HOX genes expression can be leukemogenic [16,17]. It has been presented those four HOXB genes (HOXB2, B3, B5 and B6) expression values were significantly differ between MLL-PTD and tMLL cases [2]. It is reasonable to believe that HOXB genes play a crucial biological role in AML and may be a potential biomarker for prognosis and therapeutic target.
Our analyses revealed that the majority of the key genes were down-regulated. Actin related protein 2 homolog (ACTR2), actin related protein 2/3 complex subunit 3 (ARPC3) and actin related protein 2/3 complex subunit 5 (ARPC5) are known to be the major constituents of the ARP2/3 complex, which is located at the cell surface and is essential for the regulation of cell shape and motility through lamellipodial actin assembly and protrusion [18]. The ARP2/3 complex is important for cell migration both in normal and malignant tumor cells [19,20]. In addition, alternatively spliced transcript variants of ARPC3 have been identified. It was reported that ARPC3 is linked to adipogenesis and lipid accumulation when bound to the ARPC3 promoterassociated CpG site [21]. ARPC5 has been shown to be involved in cell migration and invasion in head and neck squamous cell carcinoma [22]. Furthermore, ARPC5 may affect the proliferation of myeloma cells via the mammalian target protein rapamycin (mTOR) C1 signaling pathway [23]. Numerous studies have shown that another hub gene, cortactin (CTTN), may regulate the actin cytoskeleton and thus participat in cellular movement, adhesion, polarization, contraction and other related processes [24-26]. CTTN is overexpressed in breast cancer [27], hepatocellular carcinoma [28], gastric carcinoma [29] and head and neck squamous cell carcinomas [30]. The aberrant regulation of this gene also contributes to tumor cell invasion and metastasis and may serve as a prognostic factor and potential therapeutic target. In addition, a CTTN polymorphism may significantly increase cancer susceptibility. Some studies have indicated that the CTTN g.-9101C>T polymorphism may influence lymph node-positive colorectal and gastric cancer [31,32]. In Chronic Lymphocytic Leukemia (CLL) cells, CTTN is a checkpoint molecule at the intersection of BCR activator of RhoGEF and GTPase (BCR) and C-X-C motif chemokine receptor 4 (CXCR4) signaling pathways, thereby regulating malignant cell migration and the progression of leukemia [33]. Considering that the aforementioned genes may impact on the migration, invasion or proliferation of tumor cells, we hypothesize that these genes may also be involved in the tumorigenesis and metabolism of AML bearing MLL translocations. Further experiments will be necessary to explore this relationship in more detail.
Another important gene APP, which encodes the amyloid precursor protein, was identified among the hub genes. APP is located on 21q21.3 and is involved the pathogenesis of Alzheimer's disease and Down’s syndrome [34]. APP is mainly expressed in the brain but can also be expressed in non-neuronal tissues. An increasing number of studies have reported that APP may be involved in the growth of various cell types under physiological and pathological conditions. It has been demonstrated that APP overexpression in oral squamous cell carcinoma [35], pancreatic cancer [36], thyroid cancers [37], prostate cancer [38], and AML harboring complex karyotypes or t (8;21) [39,40], promoted cancer cells to proliferate and metastasize, negatively effecting disease prognosis. Furthermore, APP may cooperate with c-KIT mutation/overexpression in the regulation of cell apoptosis in AML1-ETO-positive leukemia via the PI3K/Akt signaling pathway, implying that APP could be considered as a new biomarker for targeted therapy [41]. Although APP is closely related to the tumorigenesis of leukemia, its specific function and mechanism of action have not yet been completely determined in tMLL bearing AML, and further experiments will need to be performed.
Pathway analysis may provide more accurate information about genetic biological functions relationship than GO analysis. Here, we found that the KEGG pathway of upregulated DEGs was enriched in genes belonging to the insulin signaling pathway, and the downregulated DEGs were concentrated in 12 pathways, one of which was the PI3K/Akt signaling pathway. Recent studies have demonstrated that the PI3K/Akt signaling pathway is frequently activated in AML patients and plays an important role in the proliferation, survival and drug resistance of human AML cell lines [42]. In addition, metabolic targeting of the PI3K/Akt/mTOR signaling pathway has been extensively studied as an anticancer strategy [43]. Clinical studies of metabolic intervention in AML patients with isocitrate dehydrogenase mutations have shown promising results [44]. The insulin signaling pathway is involved in a series of diseases, including cancer. The well-characterized Insulin Signaling Network (ISN) [45] comprises proteins with crucial roles in cell proliferation and death, linked with a cell population model and applied to data of a cell line of AML treated with a mammalian target of rapamycin inhibitor with antitumor activity [46]. Currently, it is unclear whether the PI3K/Akt and insulin signaling pathways are involved in AML patients bearing tMLL. Further studies are needed to explore the roles of the DEGs associated with these signaling pathways.
In order to further our understanding of DEG function in tMLLbearing AML, two modules were determined by MCODE. Through functional enrichment, these modules were shown to be largely involved in the bacterial invasion of epithelial cells, endocytosis and calcium as well as chemokine signaling pathways. Endocytosis is defined as the process of macromolecule uptake across the Plasma Membrane (PM) and is involved in both the terminations of receptor signal transduction [47] and initiation of certain signaling cascades [48]. The interplay between signal transduction and endocytosis affects cancer progression, as the changes in survival, proliferation, and migration signals are critical for metastasis. Numerous publications document relationship between "defective" endocytosis and cancerassociated mutations, translocations, or altered expression levels of genes implicated in cancer-linked endocytosis mechanism [49]. Moreover, changes in the nature of both the calcium and the chemokine signaling pathways may be a contributing factor to the onset of many human diseases. We speculate that these mechanisms may exist in AML bearing MLL translocations, thus affecting the treatment and clinical prognosis of AML patients.
Conclusion
In summary, our study showcases preliminary research into the mechanisms involved in AML bearing MLL translocations. A total of 885 DEGs and 32 hub genes were selected by bioinformatics analysis. Of these, the key genes, ACTR2, ARPC3, ARPC5, CTTN and APP may be implicated in tumor progression and could potentially represent promising prognostic biomarkers and therapeutic targets for tMLL-AML patients. However, further experimental evidence is required to build on our promising data.
Acknowledgement
This study was support by the National Natural Science Foundation of China (No. 81371879).
Author Contributions
Yongjin Tang and Donghong Lin raise the conception and design the program. Yongjin Tang and Jinyuan Zheng download and proceed the data, while Xiaomeng Fu and Yang Chen visualize the data. Yongjin Tang write the original draft and all authors revises the article.
References
- Meyer C, Burmeister T, Gröger D, Tsaur G, Fechina L, et al. (2018) The MLL recombinome of acute leukemias in 2017. Leukemia 32: 273-284.
- Liu HC, Shih LY, May Chen MJ, Wang CC, et al. (2011) Expression of HOXB genes is significantly different in acute myeloid leukemia with a partialtandem duplication of MLL vs. a MLL translocation: A cross-laboratory study. Cancer Genet 204: 252-259.
- Meyer C, Kowarz E, Hofmann J, Renneville A, Zuna J, et al. (2009) New insights to the MLL recombinome of acute leukemias. Leukemia 23: 1490-1499.
- Krivtsov AV, Armstrong SA (2007) MLL translocations, histone modifications and leukaemia stem-cell development. Nat Rev Cancer 7: 823-833.
- Marschalek R (2010) Mixed lineage leukemia: Roles in human malignancies and potential therapy. FEBS J 277: 1822-1831.
- Harrison CJ, Hills RK, Moorman AV, Grimwade DJ, Hann I, et al. (2010) Cytogenetics of childhood acute myeloid leukemia: United kingdom medical research council treatment trials AML 10 and 12. J Clin Oncol 28: 2674-2681.
- Balgobind BV, Raimondi SC, Harbott J, Zimmermann M, Alonzo TA, et al. (2009) Novel prognostic subgroups in childhood 11q23/MLL-rearranged acute myeloid leukemia: results of an international retrospective study. Blood 114: 2489-2496.
- Muntean AG, Hess JL (2012) The pathogenesis of mixed-lineage leukemia. Annu Rev Pathol 7: 283-301.
- Armstrong SA, Staunton JE, Silverman LB, Pieters R, den Boer ML, et al. (2002) MLL translocations specify a distinct gene expression profile that distinguishes a unique leukemia. Nat Genet 30: 41-47.
- Zangrando A, Dell'orto MC, Te Kronnie G, Basso G (2009) MLL rearrangements in pediatric acute lymphoblastic and myeloblastic leukemias: MLL specific and lineage specific signatures. BMC Med Genomics 2: 36.
- Ross ME, Mahfouz R, Onciu M, Liu HC, Zhou X, et al. (2004) Gene expression profiling of pediatric acute myelogenous leukemia. Blood 104: 3679-3687.
- Khaled S, Al Malki M, Marcucci G (2016) Acute Myeloid Leukemia: Biologic, prognostic, and therapeutic insights. Oncology (Williston Park) 30: 318-329.
- Wei C, Mei J, Tang L, Liu Y, Li D, et al (2016) 1-methyl-tryptophan attenuates regulatory T cells differentiation due to the inhibition of estrogen-IDO1-MRC2 axis in endometriosis. Cell Death Dis 7: e2489.
- Kuo YH, Zaidi SK, Gornostaeva S, Komori T, Stein GS, et al. (2009) RUNX2 induces acute myeloid leukemia in cooperation with Cbfbeta-SMMHC in mice. Blood 113: 3323-3332.
- Schnerch D, Lausch E, Becker H, Felthaus J, Pfeifer D, et al (2014) Up-regulation of RUNX2 in acute myeloid leukemia in a patient with an inherent RUNX2haploinsufficiency and cleidocranial dysplasia. Leuk Lymphoma 55: 1930-1932.
- Lawrence HJ, Sauvageau G, Humphries RK, Largman C (1996) The role of HOX homeobox genes in normal and leukemic hematopoiesis. Stem Cells 14: 281-291.
- Magli MC, Largman C, Lawrence HJ (1997) Effects of HOX homeobox genes in blood cell differentiation. J Cell Physiol 173: 168-177.
- Pollard TD (2007) Regulation of actin filament assembly by Arp2/3 complex and formins. Annu Rev Biophys Biomol Struct 36: 451-477.
- Suraneni P, Rubinstein B, Unruh JR, Durnin M, Hanein D, et al. (2012) The Arp2/3 complex is required for lamellipodia extension and directional fibroblast cell migration. J Cell Biol 197: 239-251.
- Rauhala HE, Teppo S, Niemelä S, Kallioniemi A (2013) Silencing of the ARP2/3 complex disturbs pancreatic cancer cell migration. Anticancer Res 33: 45-52.
- de Toro-Martín J, Guénard F, Tchernof A, Deshaies Y, Pérusse L, et al. (2016) A CpG-SNP located within the ARPC3 gene promoter is associated with hypertriglyceridemia in severely obese patients. Ann Nutr Metab 68: 203-212.
- Kinoshita T, Nohata N, Watanabe-Takano H, Yoshino H, Hidaka H, et al. (2012) Actin-related protein 2/3 complex subunit 5 (ARPC5) contributes to cell migration and invasion and is directly regulated by tumor-suppressive microRNA-133a in head and neck squamous cell carcinoma. Int J Oncol 40: 1770-1778.
- Xiong T, Luo Z (2018) The expression of actin-related protein 2/3 complex subunit 5 (ARPC5) expression in multiple myeloma and its prognostic significance. Med Sci Monit 24: 6340-6348.
- Bougnères L, Girardin SE, Weed SA, Karginov AV, Olivo-Marin JC, et al. (2004) Cortactin and crk cooperate to trigger actin polymerization during shigella invasion of epithelial cells. J Cell Biol 166: 225-235.
- Daly RJ (2004) Cortactin signalling and dynamic actin networks. Biochem J 382: 13-25.
- Van Rossum AG, Moolenaar WH, Schuuring E (2006) Cortactin affects cell migration by regulating intercellular adhesion and cell spreading. Exp Cell Res 312: 1658-1670.
- Dedes KJ, Lopez-Garcia MA, Geyer FC, Lambros MB, Savage K, et al. (2010) Cortactin gene amplification and expression in breast cancer: a chromogenic in situ hybridisation and immunohistochemical study. Breast Cancer Res Treat 124: 653-666.
- Zhao G, Huang ZM, Kong YL, Wen DQ, Li Y, et al. (2013) Cortactin is a sensitive biomarker relative to the poor prognosis of human hepatocellular carcinoma. World J Surg Oncol 11: 74.
- Xie HL, Li ZY, Gan RL, Li XJ, Zhang QL, et al. (2010) Differential gene and protein expression in primary gastric carcinomas and their lymph node metastases as revealed by combined cDNA microarray and tissue microarray analysis. J Dig Dis 11: 167-175.
- Fantozzi I, Grall D, Cagnol S, Stanchi F, Sudaka A, et al. (2008) Overexpression of cortactin in head and neck squamous cell carcinomas can be uncoupled from augmented EGF receptor expression. Acta Oncol 47: 1502-1512.
- Lee SY, Kang DB, Park WC, Lee JK, Chae SC (2012) Association of CTTN polymorphisms with the risk of colorectal cancer. J Korean Surg Soc 82: 156-164.
- Kim DY, Lee JH, Kim KY, Kang DB, Park WC, et al. (2015) Association between genetic polymorphisms in cortactin and susceptibility to gastric cancer. Ann Surg Treat Res 89: 74-80.
- Martini V, Gattazzo C, Frezzato F, Trimarco V, Pizzi M, et al. (2017) Cortactin, a lyn substrate, is a checkpoint molecule at the intersection of BCR and CXCR4 signaling pathway in chronic lymphocytic leukaemia cells. Br J Haematol 178: 81-93.
- Yoshikai S, Sasaki H, Doh-ura K, Furuya H, Sakaki Y (1990) Genomic organization of the human amyloid beta-protein precursor gene. Gene 87: 257-263.
- Ko SY, Lin SC, Chang KW, Wong YK, Liu CJ, et al. (2004) Increased expression of amyloid precursor protein in oral squamous cell carcinoma. Int J Cancer 111: 727-732.
- Hansel DE, Rahman A, Wehner S, Herzog V, Yeo CJ, et al. (2003) Increased expression and processing of the alzheimer amyloid precursor protein in pancreatic cancer may influence cellular proliferation. Cancer Res 63: 7032-7037.
- Krause K, Karger S, Sheu SY, Aigner T, Kursawe R, et al. (2008) Evidence for a role of the amyloid precursor protein in thyroid carcinogenesis. J Endocrinol 198: 291-299.
- Takayama K, Tsutsumi S, Suzuki T, Horie-Inoue K, Ikeda K, et al. (2009) Amyloid precursor protein is a primary androgen target gene that promotes prostate cancer growth. Cancer Res 69: 137-142.
- Baldus CD, Liyanarachchi S, Mrózek K, Auer H, Tanner SM, et al. (2004) Acute myeloid leukemia with complex karyotypes and abnormal chromosome 21: amplification discloses overexpression of APP, ETS2, and ERG genes. Proc Natl Acad Sci USA 101: 3915-3920.
- Yu G, Yin C, Jiang L, Xu D, Zheng Z, et al. (2018) Amyloid precursor protein has clinical and prognostic significance in AML1-ETO-positive acute myeloid leukemia. Oncol Lett 15: 917-925.
- Yu G, Yin C, Jiang L, Zheng Z, Wang Z, et al. (2016) Amyloid precursor protein cooperates with c-kit mutation/overexpression to regulate cell apoptosis in AML1-ETO-positive leukemia via the PI3K/AKT signaling pathway. Oncol Rep 36: 1626-1632.
- Martelli AM, Nyåkern M, Tabellini G, Bortul R, Tazzari PL, Evangelisti C, Cocco L (2006) Phosphoinositide 3-kinase/Akt signaling pathway and its therapeutical implications for human acute myeloid leukemia. Leukemia 20:911-928.
- Hauge M, Bruserud O, Hatfield KJ (2016) Targeting of cell metabolism in human acute myeloid leukemia--more than targeting of isocitrate dehydrogenase mutations and PI3K/AKT/mTOR signaling. Eur J Haematol 96: 211-221.
- Ward PS, Patel J, Wise DR, Abdel-Wahab O, Bennett BD, et al. (2010) The common feature of leukemia-associated IDH1 and IDH2 mutations is a neomorphic enzyme activity converting alpha-ketoglutarate to 2-hydroxyglutarate. Cancer Cell 17: 225-234.
- Thong FS, Dugani CB, Klip A (2005) Turning signals on and off: GLUT4 traffic in the insulin-signaling highway. Physiology (Bethesda) 20: 271-284.
- Bertuzzi A, Conte F, Mingrone G, Papa F, Salinari S, et al. (2016) Insulin signaling in insulin resistance states and cancer: a modeling analysis. PLoS One 11: e0154415.
- Grandal MV, Madshus IH (2008) Epidermal growth factor receptor and cancer: control of oncogenic signaling by endocytosis. J Cell Mol Med 12: 1527-1534.
- Platta HW, Stenmark H (2011) Endocytosis and signaling. Curr Opin Cell Biol 23: 393-403.
- Schmid SL (2017) Reciprocal regulation of signaling and endocytosis: implications for the evolving cancer cell. J Cell Biol 216: 2623-2632.