Keywords
Inclusion, Diversity; Dental education
Introduction
It is essential that colleges and universities measure their campus climates. How a campus is perceived and experienced by students, faculty, and staff impacts satisfaction, recruitment, retention, performance and productivity. As defined, campus climate “is characterized by the current attitudes, behaviors and standards of students, faculty and staff concerning the level of respect for individual needs, abilities and potential [1].” The ideal campus climate is welcoming and inclusive, “grounded in mutual respect, nurtured by dialogue, and evidenced by a pattern of civil interaction [2].”
Hart and Fellabaum conducted a qualitative analysis of 118 campus climate studies looking for common practices. They found that there was little consensus on the definition of campus climate, staff were often excluded from the studies and most only collected the demographics of race/ethnicity or gender. They recommended broadening these assessments to include all campus participants and many other demographic variables (sexual orientation, religion, social class, gender identity, etc). They also recommended that study findings be as transparent as possible to the campus community and that climate research be an iterative and ongoing effort [3].
The University of Michigan School of Dentistry conducted a campus climate assessment using interviews etc [4]. They found the environment fostered learning and personal growth, but many reported experiencing/witnessing micro-aggression or bullying. They recommended training for cultural sensitivity and interpersonal skills, leadership and team-building efforts and increasing the diversity of personnel and students
Texas A&M University (A&M) has been assessing campus climate since 2009, and recommends that all its colleges do likewise. The Commission on Dental Accreditation (CODA) now mandates dental schools assess their campus climates for diversity and inclusion [5]. At the A&M College of Dentistry (COD), the dental students experience a four-year cultural competence curriculum that has been assessed for several years now; however, the faculty and staff have not been included in climate assessments. Thus, in spring 2017, COD conducted an online campus climate assessment to measure the faculty, staff and student perspectives on diversity, inclusion and other factors for both improvement and accountability purposes.
Methods
Three very similar surveys were developed to assess the College climate, one each for faculty, staff and students. The A&M templates were used for this study. The institutional Review Board determined that the project was not human research (IRB2017- 0728). These surveys were validated by the COD Inclusion- Diversity-Equity-Access (IDEA) committee, comprised of faculty, staff and students, and then each was pilot-tested.
Instruments
The following demographics were included on all three surveys: gender, race/ethnicity, religion, sexual orientation, citizenship, age, years at college, and if they viewed themselves as members of a historically underrepresented group [3]. The topics addressed were the diversity/inclusiveness of the college/department leaders and colleagues, workload, inappropriate workplace behaviors, health and job satisfaction. There were a series of survey questions for each of these topics arranged into scales with ordinal response options. There was one open-ended question: “What else do you want us to know about the climate at the College of Dentistry.”
Data analysis
IBM SPSS version 23 software was used for data analysis. Measures of central tendency were calculated with percentages and means. Chi square analyses with Bonferroni corrections were used to identify groups that might be experiencing a less than ideal climate at the College. The respondent demographics were used to test for group differences in terms of the four outcome survey questions:
1. How would you rate your physical health?
2. How would you rate your emotional well-being?
3. All in all, I am satisfied with my job.
4. Overall, I like working here.
Results
The response rates were as follows: faculty 52% (145/277), students 51% (305/595) and staff 50% (176/351). To identify any outstanding problems, a target of 10% or more of each group being “dissatisfied/disagreeing” was chosen as an indication for further investigation and possible improvements. This target represents 15 or more faculty members, 18 or more staff members and 31 or more students.
Demographics
COD students and college personnel are diverse in terms of race/ethnicity and religion. (Table 1). Respondents could indicate more than one option. Note that 6.8% of the faculty, 32.6% of the staff and 24.2% of the students responding were underrepresented minorities (Latina/Hispanic, African- American and Native American/Hawaiian). The college is quite diverse with regard to religion (Table 2). A fairly large group of faculty and staff (about 20%) preferred not to respond about religion.
| |
Faculty |
Staff |
Students |
| |
N |
% |
N |
% |
N |
% |
| White |
88 |
59.9 |
81 |
44.8 |
155 |
46.7 |
| Asian |
24 |
16.3 |
14 |
7.7 |
68 |
20.5 |
| Latina/o or Hispanic |
5 |
3.4 |
33 |
18.2 |
60 |
18.1 |
| African-American/Black |
5 |
3.4 |
24 |
13.3 |
13 |
3.9 |
| Middle Eastern/Arab |
4 |
2.7 |
0 |
0.0 |
12 |
3.6 |
| Native American or Alaskan Native |
0 |
0.0 |
2 |
1.1 |
7 |
2.1 |
| Native Hawaiian or Other Pacific Islander |
0 |
0.0 |
0 |
0.0 |
1 |
0.3 |
| I prefer not to respond |
21 |
14.3 |
23 |
12.7 |
14 |
4.2 |
| Not listed |
0 |
0.0 |
4 |
2.2 |
2 |
0.6 |
| Total Responses |
147 |
100 |
181 |
100 |
332 |
100 |
*Respondents could check multiple options
Table 1: Race/ethnicity of respondents by group.*
| |
Faculty |
Staff |
Students |
| N |
% |
N |
% |
N |
% |
| Protestant |
62 |
42.8 |
76 |
43.2 |
119 |
39.0 |
| Catholic |
23 |
15.9 |
30 |
17.0 |
76 |
24.9 |
| Atheist |
7 |
4.8 |
2 |
1.1 |
14 |
4.59 |
| Jewish |
6 |
4.1 |
2 |
1.1 |
1 |
0.32 |
| Hindu |
4 |
2.8 |
3 |
1.7 |
11 |
3.6 |
| Agnostic |
3 |
2 |
6 |
3.4 |
12 |
3.9 |
| Buddhist |
3 |
2 |
1 |
0.57 |
8 |
2.6 |
| Islamic |
2 |
1.4 |
1 |
0.57 |
14 |
4.6 |
| Mormon |
1 |
0.70 |
2 |
1.1 |
11 |
3.7 |
| Baha’i |
0 |
0.0 |
0 |
0.0 |
2 |
0.66 |
| Sikh |
0 |
0.0 |
0 |
0.0 |
2 |
0.66 |
| Eastern Orthodox |
0 |
0.0 |
0 |
0.0 |
2 |
0.66 |
| None |
1 |
0.70 |
16 |
9.1 |
11 |
3.6 |
| Other |
0 |
0.0 |
1 |
0.57 |
0 |
0.0 |
| I prefer not to respond. |
33 |
22.8 |
36 |
20.5 |
22 |
7.21 |
| Total Responses |
145 |
100.0 |
176 |
99.91 |
305 |
100.0 |
Table 2: Religion or spiritual belief of respondents by group.
Respondents were also asked if they believed themselves to be a member of a historically underrepresented group at the college, which could include age, gender, religious preference, sexual orientation, citizenship, and race/ethnicity (Table 3). Clearly, 25%-35% at the college, students being the latter group, view themselves as part of an underrepresented group. This creates a larger group of underrepresented minorities (URMs) than just the category of race/ethnicity.
| |
Faculty |
Staff |
Students |
| |
N |
% |
N |
% |
N |
% |
| Yes |
37 |
26.1 |
45 |
25.6 |
107 |
35.0 |
| No |
91 |
64.1 |
94 |
53.4 |
180 |
59.0 |
| I prefer not to respond |
14 |
9.9 |
37 |
21.0 |
18 |
6.0 |
| Total Responses |
142 |
100.0 |
176 |
100.0 |
305 |
100.0 |
(Examples were included but not limited to: age, gender, religious preference, sexual orientation, citizenship, race/ethnicity, etc.)
Table 3: If respondents view themselves as a member of a historically underrepresented group by group.
Diversity climate
The three groups assessed the diversity climate at the college (Table 4). While students and faculty reported some borderline concerns with their peers and departments, a consistent proportion of staff members (9-14%) disagreed that diversity was valued by College leaders, supervisors and colleagues. Note that the student survey did not have department questions.
| |
Faculty
% disagree/strongly disagree (N) |
Staff
% disagree/strongly disagree (N) |
Students
% disagree/strongly disagree (N) |
| At COD, top leaders are committed to diversity |
5% (8) |
9% (17) |
7% (20) |
| Within COD, diverse perspectives are valued at COD |
7% (11) |
12% (21) |
7% (22) |
| Within COD, people are valued regardless of their backgrounds Department leaders are |
7% (11) 7% (10) |
14% (25)
(by supervisors)
14% (25)
(by coworkers) 11% (19) |
9% (29)
(by leaders)
11% (34)
(by peers) NA |
| committed to diversity |
|
|
|
| Within departments, diverse perspectives are valued |
10% (15) |
12% (21) |
8% (23)
“in my classes” |
| Within departments, supervisors value everyone regardless of their backgrounds |
10% (14) |
14% (25) |
NA |
| Within departments, coworkers value everyone regardless of their backgrounds |
6% (9) |
14% (25) |
NA |
| In my classes, people from different backgrounds get along well |
NA |
NA |
7% (21) |
*Bolded results are where 10% or more disagreed/strongly disagreedÂ
Table 4: Frequency of disagreement that diversity is valued at COD by group. *
Too much work and stress
Ten percent or more of the faculty, staff and students report having more work than they can do well and being stressed. 10-12% of all three groups report having too much work to do several times a day and 11-23% one or two times a day (Figure 1). 18-29% report being “very stressed” or “extremely stressed,” students reporting the most and faculty the least (Figure 2).
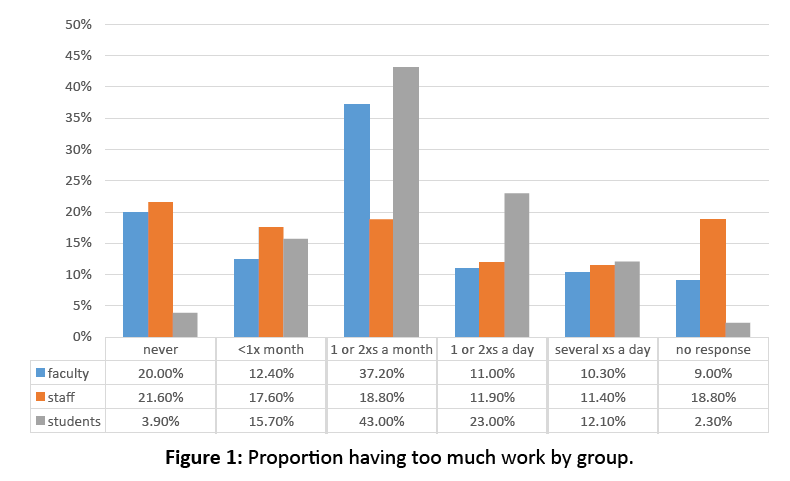
Figure 1: Proportion having too much work by group.
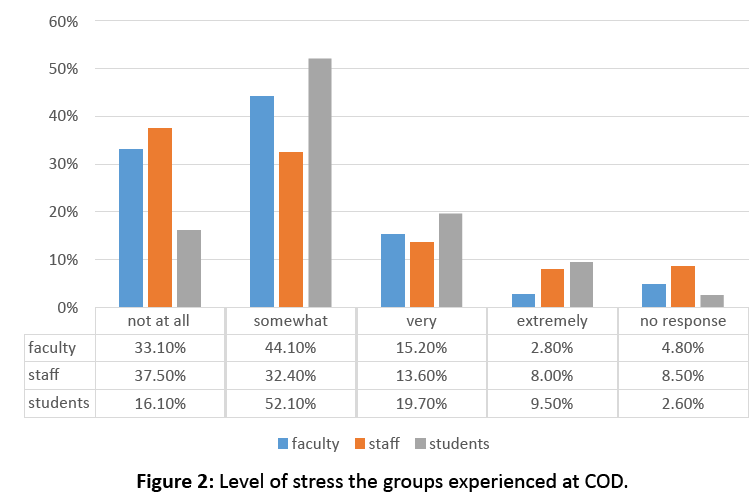
Figure 2: Level of stress the groups experienced at COD.
Interactions with others at the college
Four questions were asked about the quality of interactions with fellow faculty, staff and students. More than 90% of the faculty and students “agreed” or were “neutral” with all the positively worded statements. However, 10% or more of the staff “disagreed/strongly disagreed” with the following statements about their colleagues:
• Provide constructive criticism regarding each other’s work (12%, n=21)
• Create a cooperative and supportive environment (11%, n=19)
• Work to foster harmony (10%, n=18)
Experiencing and observing inappropriate behaviors
All three groups reported that they did not frequently hear (“weekly” or “more than once a month”) insensitive or disparaging comments about women and racial/ethnic minorities. However, given a long list of possible factors that might elicit inappropriate behaviors (social class, citizenship, age, disability, religion, etc.), faculty and students reported that only the inappropriate expression of political beliefs was frequently observed/experienced (5-10 times or more) (Table 5).
| |
Faculty Observing |
Students Experiencing |
Students Observing |
| |
N |
% |
N |
% |
N |
% |
| Never |
79 |
54.5% |
198 |
65% |
157 |
51% |
| Once |
5 |
3.4% |
27 |
9% |
14 |
5% |
| 2-4 times |
27 |
18.6% |
36 |
12% |
65 |
21% |
| 5-10 times |
10 |
6.9% |
18 |
5.9% |
19 |
6.2% |
| 10+ times |
12 |
8.3% |
13 |
4.3% |
33 |
10.8% |
| I prefer not to respond |
12 |
8.3% |
13 |
4% |
17 |
6% |
| Total Responses |
145 |
100% |
305 |
100% |
305 |
100% |
*Bolded results are where 10% or more reported the behavior as occurring 5-10 times/10+ times (combined)
Table 5: Frequency of experiencing & observing inappropriate behaviors and/or comments about political beliefs.*
Incivility and ostracism
Given a list of uncivil (rude) and ostracizing behaviors, only the staff reported them occurring with 10% or more frequency in their departments (Tables 6 and 7). They identified not being paid attention, having their judgment doubted, being excluded and people talking about them behind their back as “often” or “very often”.
| Where someone: |
Never
(5) |
Rarely
(4) |
Occasionally
(3) |
Often
(2) |
Very often
(1) |
I prefer not to respond |
Total Responses |
Mean |
| Put you down or was condescending to you? |
9152% |
27 |
25 |
9 |
8 |
16 |
176 |
4.15 |
| 52% |
15% |
14% |
5% |
5% |
9% |
|
|
| Paid little attention to your statement or showed little interest in your opinion? |
81 46% |
27 |
30 |
8 |
10 |
20 |
176 |
4.03 |
| 46% |
15% |
17% |
5% |
6% |
11% |
|
|
| Made demeaning or derogatory remarks about you? |
111
11163% |
18 |
18 |
5 |
5 |
19 |
176 |
4.43 |
| 63% |
10% |
10% |
3% |
3% |
11% |
|
|
| Doubted your judgment on a matter over which you have responsibility? |
84 48% |
30 |
22 |
13 |
9 |
18 |
176 |
4.06 |
| 48% |
17% |
13% |
7% |
5% |
10% |
|
|
| Made jokes at your expense? |
118
67% |
23 |
9 |
6 |
4 |
16 |
176 |
4.53 |
| 67% |
13% |
5% |
3% |
2% |
9% |
|
|
| Interrupted or spoke over you? |
84
48% |
27 |
22 |
14 |
12 |
17 |
176 |
3.99 |
| 48% |
15% |
13% |
8% |
7% |
10% |
|
|
| Talked about you behind your back? |
86
49% |
17 |
20 |
11 |
17 |
25 |
176 |
3.95 |
| 49% |
10% |
11% |
6% |
10% |
14% |
|
|
*Bolded results are where the combined categories of every often total 18 (10%) or more.
Table 6: Frequency of staff experiencing incivility in departments/units (n=176).*
| In general, others in my department/unit |
Never (5) |
Rarely (4) |
Occasionally (3) |
Often (2) |
Very often I often
(1) |
I prefer not to respond |
Total Responses |
Mean |
| Exclude me |
101
57% |
21
12% |
16
9% |
6
3% |
16
9% |
16
9% |
176 |
4.16 |
| Give me the cold shoulder |
105
60% |
22
13% |
17
10% |
5
3% |
10
6% |
17
10% |
176 |
4.30 |
| Ignore me during conversation |
107
61% |
26
15% |
13
7% |
5
3% |
8
5% |
17
10% |
176 |
4.38 |
| Ignore me |
110
63% |
22
13% |
12
7% |
3
2% |
11
6% |
18
10% |
176 |
4.37 |
| Keep me out of the-loop on information that is important |
81
46% |
22
13% |
33
19% |
9
5% |
14
8% |
17
10% |
176 |
3.92 |
| Treat me as if I am invisible |
113
64% |
18
10% |
12
7% |
4
2% |
11
6% |
18
10% |
176 |
4.38 |
* Bolded results are where the combined categories of every often total 18 (10%) or more.
Table 7: Frequency of staff experiencing ostracism (n=176).*
Race and gender-based behaviors
Given a list of inappropriate gender-based and race-based behaviors, none of the groups reported any of them as “often or very often” with frequencies of 10% or more.
Outcomes - Health, emotional well-being & job/program satisfaction
The majority (60% or more) of all three groups reported their physical health as either “excellent” or “good.” There were some group differences however (Figure 3).
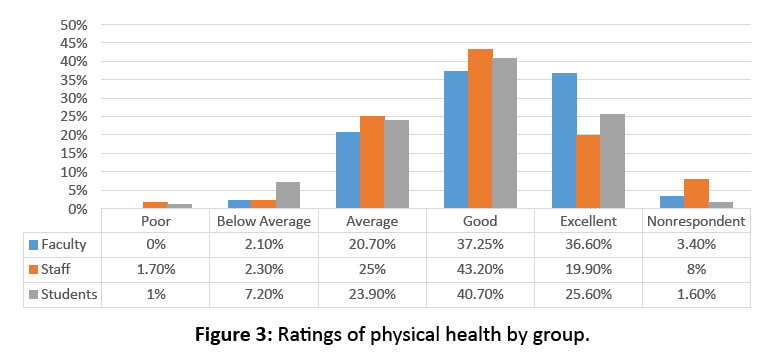
Figure 3: Ratings of physical health by group.
• Among the faculty, Hispanics (n=5, p=0.024) and Asians (n=23, p=0.038) reported significantly lower health ratings.
• Among the students, Hispanics rating of overall health was lower than all other groups and closely approached statistical significance (p=0.054). Specifically, 54.2% of Hispanics/Latino students (n=59) reported their health as “good/excellent” compared to 70.5% for all other groups (n=241).
• Among the staff, Native Americans/Alaskan Natives reported a lower rating of physical health (n<10, p=<0.001).
The majority (66% or more) of all three groups reported their emotional well-being as "excellent" or "good" (Figure 4). Among the staff, those indicating their race/ethnicity as “not listed” reported a significantly lower rating of emotional well-being (n=7, p=0.027).
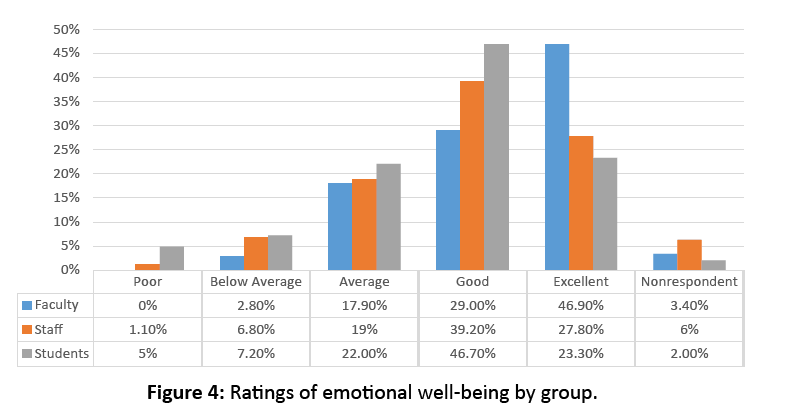
Figure 4: Ratings of emotional well-being by group.
The great majority of faculty and staff reported being satisfied with their job (faculty 84%; staff 78%) and liking to work at the College (faculty 89%; staff 83%) (Figures 5 and 6). The majority of students reported being satisfied with their educational program (85%) and were glad they attended the College (86%).
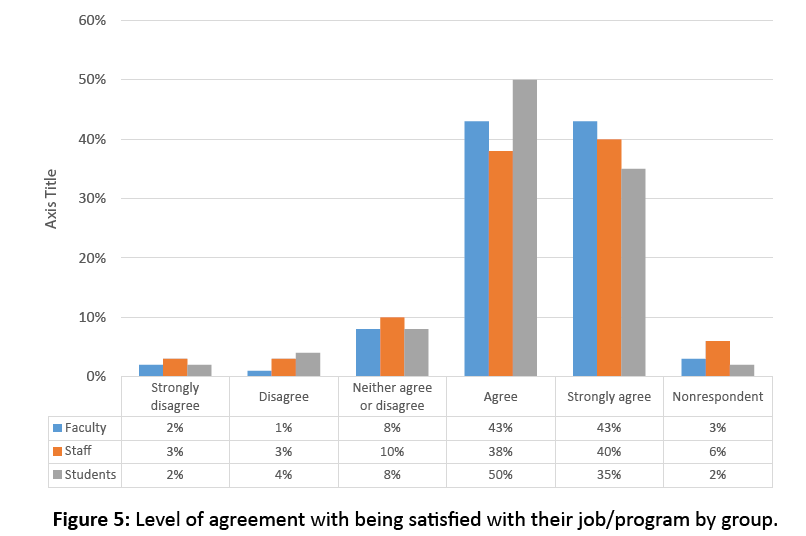
Figure 5: Level of agreement with being satisfied with their job/program by group.
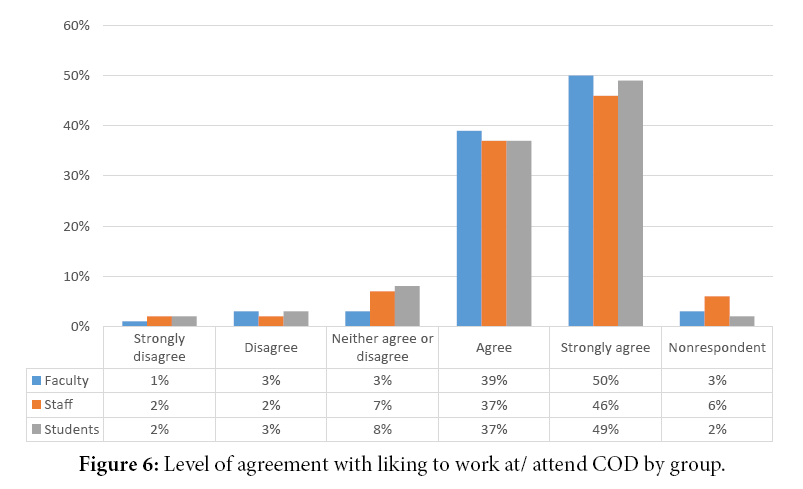
Figure 6: Level of agreement with liking to work at/ attend COD by group.
Regarding group differences in the demographic variables related to job satisfaction and liking to work at the college:
• There were no differences among faculty for either outcome variable.
• For staff job satisfaction, there was a lower level (p=0.026) for non-heterosexual respondents (n=28; homosexual, “I prefer not to respond” and “not listed”). Hispanics (n=32, p=0.002) and those reporting their race/ethnicity as “not listed” (n=8, p=0.001) reported a lower rating of job satisfaction, as well as those selfidentifying as historically underrepresented minorities (n=42, p=0.019).
• For staff “liking to work” at COD, those whose race/ ethnicity was “prefer not to respond” (n=16) reported less agreement with the statement (p=0.011), as well as those self-identifying as historically underrepresented minorities (n=43, p=0.048).
• For students, the race/ethnicity “prefer not to reply” group (n=12) agreed less that they were glad they attended the college (p ≤ 0.001) as well as the gender “prefer not to reply” group (n=6, p ≤ 0.013).
Comments
Many comments were made in response to the open-ended question, “Is there anything else you would like to tell us about the climate at the College of Dentistry?” A qualitative analysis was conducted, and six themes were identified (Table 8). The primary theme for faculty and students was the current climate was inclusive and positive. The primary theme for staff was the current climate was not inclusive, and they experienced inappropriate behaviors. Political biases and a non- inclusive culture were the second and third most common themes for faculty and students (tied with non-inclusive culture for students). For staff, the second and third most common themes were the current climate was inclusive and political biases. Students had a fourth theme of gender bias favoring men.
| Themes/N |
Faculty N/Quotes |
Staff N/Quotes |
Student N/Quotes |
| Non-inclusive Culture/ Inappropriate behaviours (N=54) |
N=10
“A disclosure of being an atheist or agnostic for some reason sows seeds of distrust in others' minds despite this being a professional environment.” |
N=30
“I've heard disparaging, and stereotyping, remarks regarding people, religious jokes regarding and have been called stupid and uneducated regarding my own beliefs.” |
N=14
“To be honest it seems somewhat segregated (here). I guess people just prefer to talk to classmates that they can relate with. I just expected professional school to break that trend.” |
Positive/Inclusive Climate
(N=53) |
N=18
“I believe we have a harmonious environment in which people get along well with each other and respect one another.” |
N=10
“The climate on this campus is warm and inviting--a true family atmosphere.” |
N=25
“I feel like I'm home here. Everyone is so friendly and I enjoy being here! I made a great choice in coming here!” |
| Political Biases (N=34) |
N=13
“Recent election made some people feel angry and they persist in expressing their views.” |
N=7
“A person is always sharing their political beliefs even when it’s not necessary.” |
N=14
“This year has provided tense dialogue about politics that has been outside of the norm in the 8 years I have been at this institution.” |
| Gender Biases (N=12) |
|
|
N=12
“I had a professor tell me ‘good job... for A GIRL!!!!’ and he laughed it off.” |
Promotion Based on Race/Loss of Quality
(N=10) |
N=3
“Diversity can help...and hurt. Sometimes diversity is held higher than the quality of applicants. This poses problems within a crowded curriculum.” |
|
N=7
“There is a sense that diversity gets preferential treatment.”
“I see many students getting passed along, when they should be held back to improve performance and clinical skills.” |
| No Room for Advancement (N=9) |
N=7
“It is difficult to move up in position. The higher administrators stay 'in place' for many years.” |
N=2
“There are no opportunities here for continuing education, promotion or personal growth |
|
Table 8: Qualitative themes for comments with quotes that illustrative the themes.
Discussion
A&M COD is a leader among US dental schools for diversifying its student body. It is the most diversified US dental school in terms of URM student population except for the historically black dental colleges. The proportion of URMs at COD is 40% for the first year class and 34% for the entire dental student body [6].
For the last 20 years, the college has continuously had federal grants for dental pipeline programs that feed URMs into dental schools. COD faculty and staff have had cultural competence training at multiple retreats. Despite this history, these surveys reveal that there is room for improvement in the COD cultural climate.
The climate surveys demonstrate that the majority of faculty, staff and students experience a positive climate where diversity is valued, that is collegial and does not include sexism, racism, inappropriate workplace behaviors, incivility and ostracism. Earlier surveys of the students support this perspective. However, a proportion of the staff members (10-20%) are dissatisfied with how they are treated by College leaders, supervisors and colleagues. Faculty and students reported that expression of political beliefs was too frequently experienced as unpleasant.
While the majority of faculty, staff and students reported good physical health and emotional well-being and being satisfied with their jobs/program, some sub-groups reported significantly lower levels. They were generally from URM populations- by racial/ethnic grouping, self-reported as historically underrepresented, non-heterosexuals and those who did not report their race/ethnicity.
Although the overall picture of the college climate revealed by these surveys is positive, improvement is needed for all three groups, especially the staff. Thus, the Director of Diversity and the IDEA Committee have developed the college’s new Diversity and Inclusion Plan (approved September 22, 2017). The plan delineates the goals and related initiatives, mostly new, in the areas of accountability, climate and equity (Table 9).
| Accountability Goal Cultivate and monitor an organizational structure and institutional environment that is accountable for diversity and inclusive. |
Climate Goal Promote a campus climate that welcomes and encourages all individuals and engages the varying backgrounds and characteristics of our community. |
Equity Goal Demonstrate a commitment to equity in the recruitment and retention of employees, volunteers, and students and the inclusive character of our College. |
| Modify college documents as needed to include language promoting diversity & inclusion. |
Implement required cultural competence training for faculty & staff. Maintain student training. |
Continue student recruitment & retention measures. Implement new recruitment & retention measures to increase the diversity of faculty. |
| Modify annual department reporting process (scorecard) to include recruitment & retention efforts. |
Develop a schedule of programs to promote diversity such as interactive discussions, workshops and speakers series. |
Create professional development programs and advancement opportunities for staff. |
| Add a line item in the college budget for diversity & inclusion efforts. |
Regularly assess climate, student attitudes and patient satisfaction about diversity & inclusion. |
Recruit URM faculty to participate in development programs through the Dean’s office and the HRSA Center of Excellence grant. |
| Develop metrics to assess the success of all initiatives. |
Implement a diversity awareness campaign that will reach employees, students and patients. |
Develop a rewards program to recognize the accomplishments of employees in the area of diversity & inclusion. |
| Create an Advisory Council on Diversity & Inclusion with corporate and civic community members. |
|
|
Table 9: Strategies for achieving the goals of the new diversity and inclusion plan.
Regarding accountability initiatives in the plan, the annual scorecard process, where departments report annual goals, targets and results, will be modified to include efforts to recruit and retain URM personnel and rates of success among URM students. The new budget line for diversity and inclusion will include (1) measures to advance recruitment and retention of diverse faculty, staff and students; (2) release time for employees and students to participate in trainings, workshops, and other diversity enterprises; and (3) funding for participation in diversity regional/national meetings. Finally, an Advisory Council on Diversity and Inclusion, including corporate and/or civic representatives from the community, will be created to review the success of the initiatives and provide recommendations for further action.
Climate initiatives will focus on training as it has been shown to improve cultural competence [7]. The current cultural competence training for dental students will be continued [8]. However, for faculty and staff, the plan requires them to participate in online training biennially and in face-to-face small groups every five years. Finally, a diversity awareness campaign will be initiated including a campus- wide contest to develop a diversity logo and tagline and a related website that explains the campus’ diversity efforts. Signage that visibly supports these efforts will be posted throughout the campus to demonstrate the college commitment to college members, patients and other visitors.
Equity initiatives focus on the recruitment and retention of diverse personnel and student populations. While the student and staff populations are already diverse, the college needs a more diverse faculty; past assessment of students support this [9]. Professional development programs will be created for staff, and faculty will be encouraged to participate in those already available. Finally, a formal program for recognizing the accomplishments of employees in the area of diversity and inclusion will be created, and faculty accomplishments in this area will be linked to promotion and tenure.
The climate surveys revealed findings beyond those related to diversity and inclusion. It is worrisome that so many report being very stressed and over-worked, as this could affect their health and emotional well-being, particularly those who indicated a lower level of health- Hispanics, Asians and Native Americans. A new wellness program for staff that allows them to exercise for thirty minutes a day three times per week may help with this. Another issue is the discontent of the staff. The required cultural competence training for all should improve how all groups interact with each other. One of the activities scheduled in the Diversity Plan is a “difficult conversations” exercise, conducted in small groups, which results in problems getting openly discussed.
One limitation of the study is the group (about 5-6%) who did not report their demographics- race/ethnicity, religion and their historically URM status. We suspect they were afraid they could be identified. Another limitation is the college is more diverse than the survey demographics indicate. Actually, 14% of faculty (versus 7%), 40% of staff (versus 33%) and 34% of students (versus 25%) are URMs. More would be known more about the climate if all these respondents had fully participated.
Conclusion
This was the most comprehensive assessment of the COD climate to date. The student perception of the college climate was previously assessed, but not the faculty and staff. This 2017 campus culture assessment revealed that the majority of college personnel and students believed the climate was inclusive and that diversity was valued. However, some problems were identified that will hopefully be remedied by the initiatives spelled out in the new Diversity & Inclusion Plan. These include the creation of an advisory council with corporate and civic community members, extensive online and face-to-face training for COD personnel, and departmental annual reporting of recruitment/ retention efforts. A diversity awareness campaign will be implemented to announce that the college has a welcoming and an inclusive environment. Climate surveys and other assessments will be conducted regularly to determine if these efforts are improving the climate for diversity and inclusion.
References
- https://diversity.tamu.edu/Campus-Climate last accessed 10.24.2017
- https://climatestudy.ku.edu/ last accessed 10.24.2017
- Hart J, Fellabaum J (2008) Analyzing campus climate studies: seeking to define and understand. J Divers High Educ. 1:222-234.
- Murdoch-Kinch CA, Duff RE, Ramaswamy V (2017) Climate study of the learning environment for faculty, staff and students at a US dental school: foundation for culture change. J Dent Educ. 8:1153-1163.
- https://www.ada.org/en/coda/current-accreditation-standards last accessed 10.24.2017
- Mc Cann A (2017) Texas A&M University College of Dentistry fact book.
- Classe RA, McCann AL, Campbell PR (2017) The impact of community rotations on the competence of dental hygiene students in Texas. JDH. 91: 22-30.
- Holyfield LJ, Miller BH (2013) A tool for assessing cultural competence training in dental education. J Dent Educ. 77:990-997.
- McCann AL, Lacy ES, Miller BH (2014) Under-represented minority students’ experiences at Baylor College of Dentistry: perceptions of cultural climate and reasons for choosing to attend. J Dent Educ. 78:411-422.