Research Article - (2024) Volume 9, Issue 1
Arsenic speciation and contamination in cereals from Chhattisgarh, India
Madhuri Khute1,
Saroj Sharma1,
Khageshwar Singh Patel2*,
Piyush Kant Pandey2,
Jasmina Allen3,
Warren Corns3,
Nelina Georgieva4,
Elena Bozhanina4,
Borislav Blazhev4,
Simge Varol5,
Pablo Martin-Ramos6 and
Yanbei Zhu7
1Department of Chemistry, Government Nagarjuna Post Graduate College of Science, India
2Department of Applied Sciences, Amity University, India
3PS Analytical Ltd, United Kingdom
4Central Laboratory for Chemical Testing and Control, Bulgaria
5Department of Geology, Suleyman Demirel University, Turkey
6Agricultural and Forestry Engineering Department, ETSIIAA, Universidad de Valladolid, Spain
7National Institute of Advanced Industrial Science and Technology (AIST), Japan
*Correspondence:
Khageshwar Singh Patel,
Department of Applied Sciences, Amity University,
India,
Email:
Received: 04-Jan-2024, Manuscript No. ipjhmct-24-18816;
Editor assigned: 08-Jan-2024, Pre QC No. ipjhmct-24-18816 (PQ);
Reviewed: 22-Jan-2024, QC No. ipjhmct-24-18816;
Revised: 29-Jan-2024, Manuscript No. ipjhmct-24-18816 (R);
Published:
05-Feb-2024, DOI: 10.21767/2473-6457.24.1.01
Abstract
Cereals serve as a major food source for humans and animals. This investigation explored the presence of arsenic species in cereal crops grown in the contaminated area of Ambagarh Chouki (Chhattisgarh, India). Rice, wheat and maize, along with husk, straw and soil samples, were analyzed using hydride generation–atomic fluorescence spectrometry (HG–AFS), and inductively coupled plasma-mass spectrometry (ICP-MS). Significant inorganic arsenic (iAs) contamination was found in rice, wheat, and maize plants, with the highest levels in roots, followed by husk, straw, and grain. Inorganic arsenic content in rice grain ranged from 229.9 mg kg−1 to 684.7 mg kg−1, while in wheat and maize it ranged from 84.6 mg kg−1 to 218.5 mg kg−1 and from 20.0 mg kg−1 to 26.2 mg kg−1, respectively. All cases exhibited a hazard quotient exceeding 1. Organic arsenic, specifically monomethyl arsenic (MMAs) and dimethyl arsenic (DMAs), were detected in rice plants. The findings address speciation, enrichment, sources, transfer factors, and health risk assessment. Overall, this study emphasizes the detrimental health effects of consuming cereals grown in this region, necessitating intervention by the Indian Government.
Keywords
Arsenic speciation; Grain; Health risk assessment; Pollution; Toxicity
Introduction
Exposure to arsenic and heavy metals from contaminated
drinking water and food sources is a major concern, prompting
extensive research in this field [1-3]. Among these contaminants,
the presence of arsenic in grains has garnered global attention
due to its varying concentrations both within and across
countries [4-7]. The toxicity of arsenic is intricately linked to
their speciation patterns, which exhibit differences among
different species [8]. Rice, in particular, is highly vulnerable to
arsenic contamination, primarily due to its aquatic nature [9].
In the Ambagarh Chouki area of Chhattisgarh, India, the issue
of arsenic contamination has become particularly prominent
[10,11]. This study aims to investigate the contamination levels
and sources of arsenic species in various organs (grain, husk,
straw, and root) of cereal crops, including rice, wheat, and
maize, cultivated in the contaminated soil of this region. By
examining these aspects, we can gain valuable insights into the extent and distribution of contamination, as well as understand
the potential risks associated with consuming crops from this
area.
Materials and Methods
Study Area
The study was carried out in different agricultural areas in Ambagarh Chouki (20.78209°N 80.74117°E) region of India. The climate is hot tropical with maximum temperature (≈47°C) in month of May. The average annual precipitation in the region is about <1200 mm, and most of the precipitation occurs between June and September. The major predominant rocks that occur are Dongargarh granite and rhyolite, which contain quartz, feldspar, ferromagnesium and iron oxide [12]. The most common soil groups occurred in the study area are the Bhata (Entisol), Matasi (Inceptisol), Dorsa (Alfisol) and Kanhar (Vertisol) [13].
Samples
During March-April 2021, a total of 24 locations in Ambagarh Chouki were chosen to collect grain samples (18 rice, 3 wheats and 3 maize), as shown in Figure 1. Additionally, 6 soil, 6 straw, 3 husk and 6 root samples were obtained. The husk was manually separated from the grain. The husk, straw, and root samples were washed three times using deionized water. All samples were sundried for one week, heated overnight at 50°C in a hot air oven, and finally crushed into powdered form, removing particles sized ≤ 0.1 mm. The processed samples were subsequently refrigerated at -4°C until analysis.

Figure 1: Left: Area of study. Right: Sampling points in Ambagarh Chouki, CG, India
Analysis
Two analytical techniques, namely hydride generation-atomic fluorescence spectrometry (HG-AFS), and inductively coupled plasma-mass spectrometry (ICP-MS), were used for the analysis of arsenic in soil, husk, straw and grain samples.
Quantification of Total As and As Speciation Analysis in Soil
Soil samples from 6 locations were selected to analyze total As and and As speciation, using the HG-AFS and LC-HG-AFS, respectively (Table 1). Analyses of total arsenic were conducted with a Millennium Excalibur (PS Analytical, Orpington, Kent, UK). An aliquot of soil sample (0.2 g) was digested with 10 mL of aqua regia (3:1 ratio of HCl to HNO3) for 2 hours at 120°C in a 50 mL polypropylene tube. After cooling down, the solution was diluted with deionized water to 50 mL, it was filtered using a Whatman 541 filter paper and further diluted to fit the calibration range. The samples were then analyzed with the HG-AFS system using 0.7% NaBH4 (m/v) in 0.1M NaOH as the reductant against the reagent blank, namely 25% HCl (v/v)+2% KI (m/v) + 10% ascorbic acid (m/v). Calibration standards of 0.10 ng mL-1 were prepared in the reagent blank, as shown in Figure 2. The mean value of three replicate measurements is reported. For the arsenic speciation analysis, an aliquot of soil sample (0.2 g) was weighed into a 50 mL clean polypropylene vial, followed by the addition of 5 mL of 0.5 M phosphoric acid. Samples were then capped and heated at 60°C overnight on a hot block and then shaken for 3 hours at room temperature, followed by centrifuging for 20 minutes. The supernatants were filtered by a 0.2 μm polytetrafluoroethylene (PTFE) syringe filter and transferred into a clean vial. These solutions were then further diluted in 20 mM phosphate buffer mobile phase and analyzed using HPLC-HG-AFS, where HPLC stands for highperformance liquid chromatography. A mixed standard with 10 μg L-1 of As(III) and As(V) was also prepared and extracted using the same method as the samples to ensure no species.
Table 1: Arsenic content in soil samples from Ambagarh Chouki (Chhattisgarh, India)
| Sample |
Location |
pH |
Total As (mg.kg-1) |
As(V) (mg.kg-1) |
Extraction efficiency (%) |
| LGC 6138 |
- |
- |
24.121 ± 0.060 |
23.33 |
97.2 |
| S1 |
Koudikasa |
7.5 |
51.425 ± 0.223 |
40.26 |
78.3 |
| S2 |
Muletitola |
7.4 |
21.405 ± 0.274 |
17.11 |
79.9 |
| S3 |
Sonsai tola |
7.5 |
36.732 ± 0.401 |
30.314 |
82.5 |
| S4 |
Koudikasa |
7.5 |
42.762 ± 0.412 |
35.086 |
82.1 |
| S5 |
Koudikasa |
7.3 |
61.949 ± 1.400 |
47.504 |
76.7 |
| S6 |
Joratarai |
7.5 |
37.079 ± 0.370 |
28.351 |
76.5 |
| S=Soil sample, LGC 6138=Soil reference sample |

Figure 2: Calibration curve for the determination of total As
Quantification of Inorganic Arsenic and Arsenic Species in Grain
An aliquot of powdered plant sample (0.2 g) was taken into a 50 mL polypropylene tube and mixed with 10 mL solution of 1% 0.1 N HNO3 and 3% H2O2 (v/v), heated by placing in hot water (90°C) for 2 hours. The cold solution was centrifugated, and the supernatant liquid (2 mL) was filtered through a 0.45 μm syringe into a polypropylene vial for injection into an Agilent 8900 × ICP-MS/MS equipped with Thermo Surveyor. The carrier gas, plasma gas, and auxiliary gas in the ICP-MS flowed at rates of 1.05 L min-1, 15 L min-1 and 0.90 L min-1, respectively. Mass resolution, integration time, and isotope conditions were as follows: 0.6 amu-0.8 amu, 0.6 seconds-0.8 seconds, and Q1- 75/Q2-91 m/z, respectively. The Agilent speciation column was operated at the flow rate, temperature, and pressure conditions of 0.9 mL min-1, 35°C, and 75 bar by injecting 10 μL of the sample solution at room temperature over a measuring time of 12.5 minutes. Figure 3 showed a typical chromatographic separation. Blank tests were performed, and the results showed that the signals were negligibly low. The mean value of three replicate measurements is reported in the following text.

Figure 3: Chromatographic separation of arsenic standards at 10 ng.g-1
Total As and As(V) Analysis in Soil
Soil samples from 6 locations were selected to analyze total As and As(V) contents using the HG-AFS technique. Analyses of total arsenic were conducted with a Millennium Merlin and Excalibur AFS (P S Analytical, Orpington, Kent, UK). An aliquot of soil sample (0.2 g) was digested with 10 mL of aqua regia (3:1 ratio of HCl to HNO3) for 2 hours at 120°C in a 50 mL polypropylene tube. After cooling down, the solution was diluted with deionized water to 50 mL, it was filtered with Whatman 541 filter paper and further diluted to fit the calibration range. The samples were then analyzed with the HG–AFS system using 0.7% NaBH4 (m/v) in 0.1M NaOH as the reductant against the reagent blank, namely 25% HCl (v/v)+2% KI (m/v) + 10% ascorbic acid (m/v). Calibration standards of 0.10 ng•mL-1 were prepared in the reagent blank, as shown in Figure 2. The mean value of three replicate measurements is reported. For the arsenic speciation analysis, an aliquot of soil sample (0.2 g) was weighed into a 50 mL clean polypropylene vial, followed by the addition of 5 mL of 0.5 M phosphoric acid. Samples were then capped and heated at 60°C overnight on a hot block and then shaken for 3 hours at room temperature, followed by centrifuging for 20 minutes. The supernatants were filtered by a 0.2 μm polytetrafluoroethylene (PTFE) syringe filter and transferred into a clean vial. These solutions were then further diluted in 20 mM phosphate buffer mobile phase and analyzed using HPLC-HG-AFS, where HPLC stands for high-performance liquid chromatography. A mixed standard with 10 μg•L-1 of As(III) and As(V) was also prepared and extracted using the same method as the samples to ensure no species conversion occurred. A single analysis was done for speciation.
Quantification of As Species in Grain
An aliquot of powdered plant sample (0.2 g) was taken into a 50 mL polypropylene tube and mixed with 10 mL solution of 1% 0.1 N HNO3 and 3% H2O2 (v/v), heated by placing in hot water (90°C) for 2 hours. The cold solution was centrifugated, and the supernatant liquid (2 mL) was filtered through a 0.45 μm syringe into a polypropylene vial for injection into an Agilent 8900 × ICP-MS/MS equipped with Thermo Surveyor. The carrier gas, plasma gas, and auxiliary gas in the ICPMS flowed at rates of 1.05 L•min-1, 15 L•min-1 and 0.90 L•min-1, respectively. Mass resolution, integration time, and isotope conditions were as follows: 0.6 amu-0.8 amu, 0.6 seconds-0.8 seconds, and Q1-75/Q2-91 m/z, respectively. The Agilent speciation column was operated at the flow rate, temperature, and pressure conditions of 0.9 mL•min-1, 35°C, and 75 bar by injecting 10 μL of the sample solution at room temperature over a measuring time of 12.5 minutes. Figure 3 showed a typical chromatographic separation. Blank tests were performed, and the results showed that the signals were negligibly low. The mean value of three replicate measurements is reported in the following text.
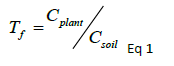
Transfer Factor
The transfer factor (Tf) of As and other elements was calculated using equation 1, which indicates the ratio of the metal content in the plant to that in the soil [14].
Health Risk Assessment
Different parameters, like Average Total Dose (ATD), Chronic Daily Intake (CDI), Cancer Risk (CR), and Hazard Quotient (HQ), were used to assess the health risk faced by the population. These evaluations were calculated based on the equations given by [15].
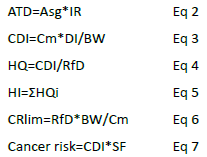
The variables ATD, Asg, IR, Cm, DI, BW, RfD, CDI, HI, HQi, CRlim and SF represent the average total dose, arsenic contamination of grain (in mg kg-1), grain ingestion rate (kg day-1), mean concentration of As in food, amount of food consumed per day (0.5kg day-1), the mean body weight of the individual (60 kg), reference dose, chronic daily intake, hazard index, summation of HQ of non-carcinogens, the maximum allowable food consumption rate (in kg d-1), and the slope factor (in mg kg-1 day-1), respectively.
QA/QC Analysis
Samples were digested using analytical grade acids from Sigma-Aldrich. Quality control and method validation were ensured through the use of LGC 6138 (coal carbonization, site soil, certified for total arsenic, 24 ± 1 μg g-1), and rice flour ERM BC211 reference materials. The LOD for all arsenic species are 0.5 μg L-1. The LOQ for iAs (As3+As5), MMA and DMAs in the rice was 30 μg kg-1. The recovery values for inorganic arsenic (iAs), monomethylarsenic (MMAs), and dimethylarsenic (DMAs) were within the range of 84%-112%, with a relative standard deviation (RSD) of 8%.
Statistical Analysis
IBM SPSS v.20 was used to analyze the data. The mean value of three measurements was recorded. The arsenic concentration in the samples was recorded in μg kg-1 dry weight (DW).
Results and Discussion
Soil Characteristics
The soil pH in the field samples was neutral, averaging 7.5 ± 0.1. Total and As(V) concentrations ranged from 21.4 to 62.0 mg kg-1 and from 17.1 to 47.5 mg kg-1 respectively (Table 1). Neither As(III) nor organic arsenic was found in the soils. Notably, arsenic concentration in the studied area’s soils greatly surpassed the background level of 5 mg kg-1. The level of arsenic exceeded values found in other regions of the country [16-19].
Cereal Grain Contamination
The arsenic speciation (iAs, MMAs, and DMAs) results for the 24 cereal grain samples (18 rice, 3 wheat, and 3 maize) are summarized in Table 2. All grain samples exhibited a significant concentration of iAs. Specifically, iAs concentrations in rice (n=18), wheat (n=3), and maize (n=3) grains were 229.9 to 684.7 μg kg-1, 84.6 to 218.5 μg kg-1 and 19.9 to 26.2 μg kg-1, respectively. The mean values for iAs content were 342.8 ± 82 μg kg-1, 96.2 ± 106.2 μg kg-1, and 44.1 ± 35.3 μg kg-1, respectively (Table 2). Thus, rice and wheat grains displayed concentrations approximately 8 and 2-fold higher than those of maize grains. MMAs were found only in one rice grain sample, while almost all rice grain samples exhibited substantial DMAs content. Among rice varieties, DMAs concentration in rice grain (n=16) displayed notable variations, ranging from 17.5 to 267.5 μg kg-1, with a mean value of 101.9 ± 69.8 μg kg-1. A low DMAs concentration was also detected in one maize grain sample. The arsenic speciation pattern observed in these grains is in line with previous reports in the literature [20-22].
Table 2: Arsenic species contents in rice, wheat, and maize plant parts, expressed in µg.kg-1
| Sample Number |
Sample |
Location |
DMAs |
MMAs |
iAs |
| Blank |
- |
- |
- |
- |
0.046 |
| BC 211 |
ERM BC 211 |
- |
126.889 |
7.829 |
122.248 |
| RG1 |
Rice (Sonam) grain |
Kaudikasa |
90.277 |
ND |
282.819 |
| RG2 |
Rice (Sonam) grain |
Muletitola |
63.239 |
ND |
232.973 |
| RG3 |
Rice (Sonam) grain |
Sonsaytola |
ND |
ND |
330.894 |
| RG4 |
Rice (Sarna) grain |
Kaudikasa |
32.224 |
ND |
250.614 |
| RG5 |
Rice (Sarna) grain |
Muletitola |
ND |
ND |
229.912 |
| RG6 |
Rice (Sarna) grain |
Sonsaytola |
125.949 |
ND |
471.3 |
| RG7 |
Rice (Naya 1010) grain |
Kaudikasa |
178.461 |
ND |
293.303 |
| RG8 |
Rice (Naya 1010) grain |
Muletitola |
134.094 |
ND |
261.893 |
| RG9 |
Rice (Naya 1010) grain |
Sonsaytola |
92.112 |
ND |
346.771 |
| RG10 |
Rice (RI) grain |
Jadutola |
93.722 |
ND |
260.683 |
| RG11 |
Rice (RI) grain |
Sangali |
97.043 |
ND |
317.777 |
| RG12 |
Rice (RI) grain |
Majhitola |
50.256 |
ND |
398.151 |
| RG13 |
Rice (PRN) grain |
Jadutola |
117.603 |
ND |
346.043 |
| RG14 |
Rice (PRN) grain |
Muletitola |
208.358 |
ND |
684.738 |
| RG15 |
Rice (PRN) grain |
Kaudikasa |
267.478 |
ND |
384.992 |
| RG16 |
Rice (Luchai) grain |
Jadutola |
37.467 |
7.726 |
386.256 |
| RG17 |
Rice (Luchai) grain |
Muletitola |
24.229 |
ND |
320.007 |
| RG18 |
Rice (Luchai) grain |
Kaudikasa |
17.474 |
ND |
371.268 |
| MG1 |
Maize grain |
Daihan |
8.451 |
ND |
84.637 |
| MG2 |
Maize grain |
Joratarai |
ND |
ND |
27.592 |
| MG3 |
Maize grain |
Netamtola |
ND |
ND |
19.954 |
| WG1 |
Wheat grain |
Kaudikasa |
ND |
ND |
26.211 |
| WG2 |
Wheat grain |
Kaudikasa |
ND |
ND |
218.471 |
| WG3 |
Wheat grain |
Joratarai |
ND |
ND |
43.914 |
| RS1 |
Rice (Naya 1010) straw |
Kaudikasa |
29.718 |
ND |
8002.237 |
| RS2 |
Rice (Naya 1010) straw |
Muletitola |
26.747 |
ND |
6019.72 |
| RS3 |
Rice (Naya 1010) straw |
Sonsaytola |
ND |
ND |
15460.911 |
| WS1 |
Wheat straw |
Koudikasa |
ND |
ND |
862.216 |
| WS2 |
Wheat straw |
Koudikasa |
ND |
ND |
388.408 |
| WS3 |
Wheat straw |
Joratarai |
11.834 |
ND |
4092.089 |
| RH1 |
Rice (Naya 1010) husk |
Kaudikasa |
186.81 |
ND |
1056.251 |
| RH2 |
Rice (Naya 1010) husk |
Muletitola |
135.719 |
ND |
756.116 |
| RH3 |
Rice (Naya 1010) husk |
Sonsaytola |
ND |
ND |
951.901 |
| RR1 |
Rice (Naya 1010) root |
Kaudikasa |
293.383 |
26.908 |
77404.395 |
| RR2 |
Rice (Naya 1010) root |
Muletitola |
281.836 |
80.956 |
48697.176 |
| RR3 |
Rice (Naya 1010) root |
Sonsaytola |
443.464 |
91.345 |
87051.697 |
| WR1 |
Wheat root |
Kaudikasa |
ND |
ND |
1242.98 |
| WR2 |
Wheat root |
Kaudikasa |
ND |
ND |
319.762 |
| WR3 |
Wheat root |
Joratarai |
ND |
ND |
6682.693 |
Straw and Husk Contamination
In the rice husk and straw, only two types of arsenic, i.e., iAs and DMAs, were detected (Table 2). The iAs concentration in rice straw, wheat straw, and rice husk were 6046.5 to 15460.9 μg kg-1, 388.4 to 4092.1 μg kg-1, and 756.1 to 1056.3 μg kg-1, respectively. The higher As content in the root straw samples (5.5-fold and 9.6-fold compared to wheat straw and rice husk) can be attributed to high arsenic translocation from the roots to the shoot [23].
Root Contamination
An extremely high uptake of iAs was noted in the root samples. The MMAs, DMAs, and iAs levels in the rice root samples varied from 26.9 to 91.3 μg kg-1, from 281.8 to 443.5 μg kg-1 and from 48697.2 to 87051.7 μg kg-1, respectively, with average values of 66.4 ± 34.6 μg kg-1, 339.6 ± 90.2 μg kg-1, and 71051.1 ± 19951.0 μg kg-1. However, only iAs showed accumulation in wheat roots, with contents ranging from 319.7 to 6682.7 μg kg-1 and a mean value of 2748.5 ± 3438.3 μg kg-1. The As concentrations in the different parts of the rice plant generally followed the same pattern previously reported [22]but were considerably higher than the values reported for that study in rice from Bangladesh.
Transfer factor
The mean transfer factor (Tf) values of the total As for rice grain (n=3), Triticum (wheat) grain (n=3), rice husk (n=3), rice straw (n=3), Triticum straw (n=3), rice root (n=3) and Triticum root (n=3) evaluated were 0.01 ± 0.003, 0.002 ± 0.001, 0.03 ± 0.006, 0.29 ± 0.11, 0.05 ± 0.05, 2.05 ± 0.39 and 0.07 ± 0.08, respectively. In terms of As, the rice root samples exhibited the highest Tf value (2.05), whereas other parts of the rice and wheat plants showed significantly lower values (0.03-0.29).
Toxicity
Rice serves as the primary food source for the residents of this region, yet grains from all rice varieties were discovered to be contaminated with iAs, surpassing the permissible limit of 200 μg kg-1 (as mentioned earlier, the mean iAs concentration in rice, wheat and maize grain was observed to be 433 ± 1 54.1 μg kg-1, 96.2 ± 106.2 μg kg-1, and 44.1 ± 35.4 μg kg-1, respectively). The concentrations found in Ambagarh Chouki were higher than those detected in rice samples collected from 13 major rice-producing provinces in China, where concentrations ranged from 25 to 327 μg kg-1 [23]. As for the husk and straw samples, utilized as feed for domestic animals, they exhibited iAs contamination at levels several times higher than the grains, posing a clear risk. The ATD, CDI, CR, and HQ values for the grains are presented in Table 3. The HQ values for rice, wheat, and maize were 14.28, 4.01 and 1.84, respectively, much higher than those reported for the Bengal Delta and the Bahama basin, likely due to the elevated As content in the soil and water of Ambagarh Chouki [24,25]. The HQ and CR values for these grains were observed to exceed above 1 and acceptable limit of 1×10⁻⁴ (US EPA 2005), respectively suggesting potential non-cancer and cancer health risk [26,27].
Table 3: Health risk assessment of grains samples
| Grain |
ATD |
CDI |
CR |
HQ |
| Rice |
0.17 ± 0.05 |
0.0029 ± 0.0009 |
0.0043 ± 0.0013 |
14.28 ± 4.46 |
| Wheat |
0.05 ± 0.05 |
0.0008 ± 0.0009 |
0.0012 ± 0.0013 |
4.01 ± 4.43 |
| Maize |
0.02 ± 0.02 |
0.0004 ± 0.003 |
0.0006 ± 0.004 |
1.8 4± 1.47 |
| ATD, CDI, CR, and HQ stand for average total dose, chronic daily intake, cancer risk, and hazard quotient. |
Conclusion
Elevated concentrations of arsenic in soil in the form of As(V)
was found in all six locations. Neither As(III) nor organic
arsenic species were found. Very high levels of arsenic were
found in rice grain, husk, straw and root samples obtained
from Ambagarh Chouki (Chhattisgarh, India). The order of
increasing arsenic concentration was grain << husk << straw
<< root. Arsenic levels in rice plant parts were significantly
higher than in wheat grain and plant parts, as well as maize
grain. A significant portion of the total arsenic (tAs) came from
toxic inorganic arsenic (iAs), which accounted for 80.9%, 97%
and nearly 100% of the tAs in rice grain, husk, and straw/root
samples, respectively. Only rice root samples contained MMAs,
while DMAs were present in most rice plant parts. The average
iAs content in rice grain (433 ± 154.1 μg kg-1) largely exceeded
the permissible limit of 200 μg kg-1, whereas wheat and maize
grain (96.2 ± 106.2 μg kg-1 and 44.1 ± 35.4 μg kg-1, respectively)
remained within the safe range, indicating them as safer food
sources. Hazard quotient values for rice, wheat, and maize
grain were 14.28, 4.01 and 1.84 respectively. The presence of
high levels of arsenic in the grains can be attributed to both
natural and human activities. Urgent action is required from
the Indian Government to address the adverse health effects
associated with consuming cereals grown in this region.
Acknowledgement
The authors are thankful to UGC, New Delhi, India for supporting this work through research grant: F.18-1/2011(BSR) 2016.
Conflict Of Interest
The authors declare that the research was conducted in the
absence of any commercial or financial relationships that could
be construed as a potential conflict of interest.
References
- Rai PK, Lee SS, Zhang M, Tsang YF, Kim K (2019) Heavy metals in food crops: Health risks, fate, mechanisms and management. Environ Int. 125:365-385.
[Crossref] [Google Scholar]
- Roman-Ochoa Y, Delgado GTC, Tejada TR, Yucra HR, Durand AE, et al. (2021) Heavy metal contamination and health risk assessment in grains and grain-based processed food in Arequipa region of Peru. Chemosphere. 274:129792.
[Crossref] [Google Scholar]
- Suman S, Sharma PK, Siddique AB, Rahman MA, Kumar R, et al. (2019) Wheat is an emerging exposure route for arsenic in Bihar, India. Sci Total Environ. 703:134774.
[Crossref] [Google Scholar]
- Cubadda F, Ciardullo S, D'Amato M, Raggi A, Aureli F, et al. (2010) Arsenic contamination of the environment-food chain: A survey on wheat as a test plant to investigate phytoavailable arsenic in Italian agricultural soils and as a source of inorganic arsenic in the diet. J Agric Food Chem. 58(18):10176-10183.
[Crossref] [Google Scholar]
- RuÃÂ?Âz-Huerta EA, Garza Varela A, Gomez-Bernal JM, Castillo F, Avalos-Borja M, et al. (2017) Arsenic contamination in irrigation water, agricultural soil and maize crop from an abandoned smelter site in Matehuala, Mexico. J Hazard Mater. 339:330-339.
[Crossref] [Google Scholar]
- Thielecke F, Nugent AP (2018) Contaminants in grain-A major risk for whole grain safety? Nutrients. 10(9):1213.
[Crossref] [Google Scholar]
- Tatah Mentan M, Nyachoti S, Scott L, Phan N, Okwori FO, et al. (2020) Toxic and essential elements in rice and other grains from the United States and other countries. Int J Environ Res Public Health. 17(21):8128.
[Crossref] [Google Scholar]
- Akter KF, Owens G, Davey DE, Naidu R (2005) Arsenic speciation and toxicity in biological systems. Rev Environ Contam Toxicol. 184:97-149.
[Crossref] [Google Scholar]
- Sharma S, Kaur I, Nagpal AK (2021) Contamination of rice crop with potentially toxic elements and associated human health risks-a review. Environ Sci Pollut Res Int. 28(10):12282-12299.
[Crossref] [Google Scholar]
- Patel KS, Pandey PK, Martn-Ramos P, Corns WT, Varol S, et al. (2023) A review on arsenic in the environment: Contamination, mobility, sources and exposure. RSC Adv. 13(13):8803-8821.
[Crossref] [Google Scholar]
- Patel KS, Pandey PK, Martn-Ramos P, Corns WT, Varol S, et al. (2023) A review on arsenic in the environment: Bio-accumulation, remediation and disposal. RSC Adv. 13(22):14914-14929.
[Crossref] [Google Scholar]
- Shukla DP, Dubey CS, Singh NP, Tajbakhsh M, Chaudhry M (2010) Sources and controls of arsenic contamination in groundwater of Rajnandgaon and Kanker district, Chattisgarh, Central India. J Hydro. 395(1):49-66.
[Crossref] [Google Scholar]
- Lal B, Sengar SS, Singh R, Jhariya MK, Raj A (2023) Hydrogeochemistry and groundwater quality assessment In Ambagarh Chowki, Chhattisgarh, India. Environ Monit Assess. 195(1):43.
[Crossref] [Google Scholar]
- Hu W, Huang B, Tian K, Holm PE, Zhang Y (2017) Heavy metals in intensive greenhouse vegetable production systems along Yellow Sea of China: Levels, transfer and health risk. Chemosphere. 167:82-90.
[Crossref] [Google Scholar]
- Varol S, Sener S, Sener E (2021) Assessment of groundwater quality and human health risk related to arsenic using index methods and GIS: A case of Suhut Plain (Afyonkarahisar/Turkey). Environ Res. 202:111623.
[Crossref] [Google Scholar]
- Srivastava S, Sharma YK (2013) Arsenic occurrence and accumulation in soil and water of Eastern districts of Uttar Pradesh, India. Environ Monit Assess. 185(6):4995-5002.
[Crossref] [Google Scholar]
- Suman S, Sharma PK, Siddique AB, Rahman MA, Kumar R, et al. (2019) Wheat is an emerging exposure route for arsenic in Bihar, India. Sci Total Environ. 703:134774.
[Crossref] [Google Scholar]
- Shrivastava A, Barla A, Singh S, Mandraha S, Bose S (2017) Arsenic contamination in agricultural soils of Bengal deltaic region of West Bengal and its higher assimilation in monsoon rice. J Hazard Mat. 324:526-534.
[Crossref] [Google Scholar]
- D'Amato M, Aureli F, Ciardullo S, Raggi A, Cubadda F (2011) Arsenic speciation in wheat and wheat products using ultrasound and microwave-assisted extraction and anion exchange chromatography-inductively coupled plasma mass spectrometry. J Anal Atom Spectro. 26:207-213.
[Crossref] [Google Scholar]
- Esperanza MG, Barrientos EY, Wrobel K, Aguilar FJA, Escobosa AR, et al. (2017) Determination of total arsenic and speciation analysis in Mexican maize tortillas by hydride generation-microwave plasma atomic emission spectrometry and high performance liquid chromatography inductively coupled plasma mass spectrometry. Anal Methods. 9:2059-2068.
[Crossref] [Google Scholar]
- Sarwar T, Khan S, Muhammad S, Amin S (2021) Arsenic speciation, mechanisms, and factors affecting rice uptake and potential human health risk: A systematic review. Environ Technol Innov. 22:101392.
[Crossref] [Google Scholar]
- Abedin MJ, Cresser MS, Meharg AA, Feldmann J, Cotter-Howells J (2005) Arsenic accumulation and metabolism in rice (Oryza sativa L). Environ Sci Technol. 36(5):962-968.
[Crossref] [Google Scholar]
- Chen J, Zeng J, Ding S, Li J, Liu X, et al. (2022) Arsenic contents, speciation and bioaccessibility in rice grains from China: Regional and variety differences. J Hazard Mater. 437:129431.
[Crossref] [Google Scholar]
- Khanam R, Hazra GC, Bag AG, Kulsum PGPS, Chatterjee N, et al. (2021) Risk assessment of arsenic toxicity through groundwater-soil-rice system in Maldah district, Bengal delta basin, India. Arch Environ Contam Toxicol. 81:438-448.
[Crossref] [Google Scholar]
- Watson C, Gustave W (2022) Prevalence of arsenic contamination in rice and the potential health risks to the Bahamian population-A preliminary study. Front Environ Sci. 10.
[Crossref] [Google Scholar]
- Kumar M, Ramanathan AL, Rahman MM, Naidu R (2016) Concentrations of inorganic arsenic in groundwater, agricultural soils and subsurface sediments from the middle Gangetic plain of Bihar, India. Sci Total Environ. 573:1103-1114.
[Crossref] [Google Scholar]
- Sharma R, Yadav A, Ramteke S, Patel KS, Lata L, et al. (2019) Heavy metal pollution in surface soil of Korba Basin, India. J Hazard Toxic Radioactive Waste. 23(4):05019004.
[Crossref] [Google Scholar]
Citation: Khute M, Sharma S, Patel KS, Pandey PK, Allen J, et al. (2024) Arsenic Speciation and Contamination in Cereals from Chhattisgarh, India. J Heavy Met Toxicity Dis. 9:01.
Copyright: © 2024 Khute M, et al. This is an open-access article distributed under the terms of the Creative Commons Attribution License, which permits unrestricted use, distribution, and reproduction in any medium, provided the original author and source are credited.