Research Article - (2025) Volume 12, Issue 2
Analyzing the Effect of Fatigue and Reliability in Used Equipment Using Statistics Inference
Aaron Kusidi Lutete*
Department of Business and Administration, California State University, Dominguez Hills, Carson, United States
*Correspondence:
Aaron Kusidi Lutete, Department of Business and Administration, California State University, Dominguez Hills, Carson,
United States,
Email:
Received: 24-Oct-2024, Manuscript No. IPBJR-24-21852;
Editor assigned: 26-Oct-2024, Pre QC No. IPBJR-24-21852 (PQ);
Reviewed: 08-Nov-2024, QC No. IPBJR-24-21852;
Revised: 12-Feb-2025, Manuscript No. IPBJR-24-21852 (R);
Published:
19-Feb-2025, DOI: 10.36648/2394-3718.12.2.143
Abstract
This study focuses on a critical evaluation of fatigue and reliability in used equipment, highlighting their significance as separate yet interconnected factors influencing industrial performance and quality assurance. Reliability is traditionally defined as the ability of equipment to perform consistently over time, whereas fatigue refers to the progressive structural degradation due to repeated operational stresses. Understanding the interplay between these two concepts is crucial for industries that rely on equipment with extended service periods. This research aims to bridge the gap between fatigue and reliability by defining each concept independently, identifying points of connection, and exploring their combined impact on equipment performance through statistical inference. To achieve this, the study develops a methodological framework using statistical inference techniques, including survival analysis and probabilistic modeling, to assess and predict the reliability and fatigue conditions of used machinery. The research collected extensive data on equipment performance and degradation, formulated hypotheses, and applied these statistical methods to validate the relationship between fatigue and reliability. A case study was conducted to test these hypotheses, simulating real-world conditions where equipment undergoes recurrent stress, demonstrating how statistical inference can accurately predict the onset of fatigue and its effects on reliability. The findings of this study confirm that statistical inference provides a powerful approach to predicting reliability and fatigue conditions, enabling industries to transition from reactive to proactive maintenance strategies. By incorporating statistical models, the research illustrates how industries can anticipate equipment failures, optimize maintenance schedules, and extend the lifespan of machinery, ultimately enhancing operational efficiency and reducing costs. The study emphasizes that reliability should be viewed not merely as a current performance indicator but as a predictive tool influenced significantly by fatigue. This approach provides a deeper understanding of the reliability life cycle, promoting better decision-making and strategic planning in equipment management.
Keywords
Statistic inference; Bathtub curve; Reliability; Fatigue
Introduction
In the contemporary industrial landscape, the reliance on equipment and machinery that has been in service for an extended period is ubiquitous. This reliance underscores a critical need for a thorough understanding of how fatigue and reliability issues impact used equipment. The degradation of machinery over time is an inevitable phenomenon, influenced by various factors including operational stress, environmental conditions, maintenance practices, and the intrinsic quality of the equipment. The manifestation of fatigue in used equipment can lead to unforeseen failures, posing significant operational and safety risks, and incurring substantial economic costs. Reliability is the capacity to perform by maintaining a certain quality over time. Reliability is quality over time. The concept beyond reliability brings us to understand how we can perform certain tasks and maintain a level of performance. Reliability is often used to describe what to expect from a device or a machine. Because of its popular use in technology, the word reliability tends to be used to define how well a device can perform. Reliability follows a certain path called the bathtub curve. The bathtub curve explained the rate of failure as a probability over time. The bathtub curve is described by three principal stages: Early infant mortality failure, constant failure, and wear-out failure. The first stage of failure is composed of a teething problem with a decreasing rate of failure. This stage does not concern our study as it is a stage where a device is not subject to any exhaustion. Our study articulates the next stage because, with a constant rate of failure in the second stage, we entered into the notion of fatigue. Fatigue in a used device is the stress applied to a device over some time. Fatigue is a concept that explains the stage of exhaustion of a device or an element. Fatigue is a central part of understanding the impact of technology utilization on reliability. The importance of fatigue is to explain the bathtub cycle stage. Because fatigue plays an important part in the reliability cycle, we will analyze the impact of fatigue using statistic inference as a method to predict or define the future stage of a used device within a manufacturing process.
Materials and Methods
The concept of equipment fatigue refers to the progressive and localized structural damage that occurs when a material is subjected to cyclic loading. Reliability, on the other hand, is the probability that equipment will perform its intended function without failure over a specified period under stated conditions. The interplay between fatigue and reliability in used equipment presents a complex challenge that industries must navigate to ensure operational efficiency and safety. Traditional approaches to addressing this challenge have often relied on heuristic methods or rule-of-thumb guidelines that lack the precision of data-driven decision-making. Few authors have discussed the impact of fatigue on reliability. Padding Gudipudi and Shane Underwood, in reliability analysis of fatigue life prediction from the viscoelastic continuum damage model, two scholars from Arizona States University, talk about the impact of fatigue on the reliability of a material. They adopted a statistical approach by analyzing the variation in the probability of failure generated by a level of stress on the asphalt. They have combined twelve parameters to determine the reliability and the failure rate. In their study, they have adopted a methodical approach to understand the reliability of the asphalt in terms of how well the asphalt INS is resistant to decoration and they have discussed the probability of failure as a percentage rate. The two concepts exposed the correlation that existed between the rate of failure of material and the concept of fatigue. Ran Xuedong, searcher for Science and Technology of Photon Manufacturing, in his article “A model for reliability and confidence level in fatigue statistical calculation”, talks about a form of modeling reliability and fatigue through statistical calculation. For the authors, reliability is represented by the confidence interval, the expected life of the element, and the level of variation. This approach emphasizes the impact of statistical analysis on fatigue and reliability studies. Echard, Gayton, and Bignonnet introduced a novel reliability analysis method aimed at advancing the fatigue design process. Their approach involves a probabilistic assessment of fatigue life, which incorporates uncertainties related to material properties and loading conditions. By moving beyond a simplistic view of load effects, this method extends traditional fatigue analysis methodologies to include a comprehensive consideration of variability, thereby offering a more robust framework for improving design reliability. Also, Bingham Chen, Advances in Materials Science and Engineering, developed a methodical approach to analyze the effect of fatigue on reliability. The author’s models start by defining the parameter and the type of distribution. Through these steps, we can see the impact of certain statistical elements that affect the process of analysis. The author also emphasizes the composition of the materials as an element that affects reliability. This perspective gives us a broader view of how deep the concept of reliability can go. From different statistical notions to core chemical notions. Jian-Xiong Gao, a mechanical engineer, adopted a different perspective. He analyzed the impact of growing stress on the reliability of a material. This perspective differs from ours because of our first condition stating a period of constant failure. With the impact of increasing stress or repetitive native stress, we have a different opinion on reliability and can even bring to it the notion of resistivity and consistency of materials. The authors have developed different notions of where the notion of reliability and fatigue can be applied by using statistics. Our paper will try to develop a new understanding and method to forecast the effect of fatigue in the reliability bathtub curve cycle [1].
Problematic
The concept of reliability is defined as quality over time and is often characterized as a measure of performance. However, it should be seen not only as a current performance indicator but as a concept of future quality assurance. Reliability provides insights into both current and future performance, serving as a key element in manufacturing by offering a predictive view of processes and equipment. In machinery, reliability is typically seen as the ability of the machine to perform perfectly, which is a narrow perspective [2]. This approach often overlooks the critical aspect of future performance and investment security.
Reliability follows a life cycle characterized by a decreasing rate of performance, and within this cycle, fatigue plays an integral role. However, traditional analyses focus primarily on the rate of failure, neglecting the significant presence of fatigue within the reliability life cycle. The lack of a systematic analytical framework to predict fatigue onset and assess reliability through statistical inference leads many organizations to struggle with the unpredictability of equipment failure, resulting in reactive rather than proactive management strategies.
The research problem addressed in this paper is the need to systematically integrate statistical inference methods into the analysis of equipment reliability and fatigue. The absence of such an approach undermines effective decision-making regarding maintenance, replacement, and operational planning. Fatigue critically impacts the second and third stages of the reliability cycle, influencing the material’s stress levels and overall performance. Understanding the clear interaction between fatigue and reliability is essential to shift from merely observing failure rates to predicting performance outcomes.
The research seeks to address the following objectives:
• Developing a methodology to analyze the impact of fatigue on reliability: Creating appropriate methods to incorporate fatigue into reliability assessments using statistical inference.
• Assessing the role of statistical inference in reliability analysis: Utilizing statistical tools such as regression analysis, survival analysis, and probabilistic modeling to analyze reliability data and predict fatigue effects.
• Establishing the place of fatigue in reliability analyses: Identifying and integrating fatigue as a central element within the reliability cycle for tools, devices, and materials, thereby enhancing predictive maintenance and operational efficiency [3].
By focusing on these objectives, this study aims to demonstrate the application and advantages of statistical inference in reliability analysis, providing a robust framework for proactive management strategies that better align with operational needs.
Methods
The methodology of this research follows a descriptive approach, aimed at providing a comprehensive understanding of fatigue and reliability in used equipment. The descriptive method was chosen because it allows for the detailed examination and presentation of the key elements, phenomena, and relationships related to equipment degradation and performance. This approach systematically documents existing conditions, analyzes patterns, and identifies factors influencing the reliability and fatigue of machinery.
Data Collection
Data were collected from a variety of sources, including:
Operational records: These records provided historical data on equipment performance, including operational hours, load levels, and maintenance intervals, helping to track patterns of wear and failure.
Data Analysis
The collected data were analyzed using several statistical inference techniques to identify patterns and predict future conditions:
Survival analysis: Used to estimate the remaining useful life of equipment by examining time-to-failure data, survival analysis helps in understanding how long equipment can operate before a significant failure occurs.
Probabilistic modeling: Probabilistic models were developed to predict the likelihood of failures under different operational conditions, allowing for risk assessments and proactive maintenance planning.
Literature Review and Documentation Study
A comprehensive literature review was conducted to gather existing knowledge on fatigue and reliability. This included studying different authors' perspectives on statistical inference in equipment analysis, which helped frame the theoretical foundation of the research. Document analysis was also used to collect additional data on common practices and methodologies employed in reliability and fatigue studies.
Case Study and Hypothesis Testing
To validate the theoretical framework and statistical models, a practical case study was conducted involving used plastic grinder machine. The case study simulated real-world conditions where equipment is subjected to repeated operational stresses. Hypotheses were formulated based on the statistical models and tested using the collected data to assert the connection between fatigue and reliability [4].
Conclusion of Methodology
This descriptive approach provided a robust framework for understanding the dynamics between fatigue and reliability. By integrating statistical analysis, machine learning, and realworld data, the research developed predictive models that can guide decision-making processes, optimize maintenance schedules, and enhance the operational longevity of used equipment.
Results and Discussion
Theatrical Framework
Notion of reliability: The notion of reliability in the context of engineering, statistics, and various other fields refers to the probability that a system, component, or process will perform its intended function without failure under specified conditions for a designated period. Reliability is a key measure of performance and quality, indicating the dependability and consistency of a product or system. It plays a crucial role in the design, manufacturing, and maintenance of goods and services, impacting everything from consumer electronics to large-scale industrial machinery. Reliability is the ability of a product, material, or element to perform the intended way.
Key aspects of reliability
• Probability of success: Reliability is quantitatively expressed as the probability that a system or component functions without failure for a certain period under specified conditions. It is typically represented by a value between 0 and 1, where 1 indicates perfect reliability (no failure) and 0 indicates complete unreliability (certain failure).
• Specified conditions: Reliability is always defined concerning the operating conditions, including environmental factors, usage rates, and maintenance practices. The same system may have different reliability measures under different conditions.
• Designated period: Reliability predictions or measurements are time-dependent. They are often expressed in terms of Mean Time to Failure (MTTF) for non-repairable systems or Mean Time between Failures (MTBF) for repairable systems.
Factor influencing reliability
• Design quality: The inherent design of a system, including the choice of materials, components, and redundancy, significantly affects its reliability.
• Manufacturing consistency: Variations in manufacturing processes can lead to differences in the reliability of otherwise identical units.
• Environmental conditions: External conditions such as temperature, humidity, and exposure to corrosive substances can impact the reliability of a system.
• Operational stress: The level and type of stress (mechanical, electrical, thermal) a system is subjected to during operation can influence its reliability.
• Maintenance practices: Regular and effective maintenance can improve the reliability of a system by preventing failures or identifying potential issues early.
Reliability is related to the notion of failure rate. Assuming that a material or machine only fails when performing in an unattended manner, the failure will represent the number of times fails to meet the requirement. As failure is the principal element of reliability, we can derive other elements like:
• Failure rate
• Time between failure
• Time to failure
• Default
The different elements describe the different notions related to the process of analyzing a failure. As performance is related to a timeframe of performance, the failure rate will be:

We assume that the time to failure is represented by the timeframe divided by the number of failure moments (ÃÃÃÂ????) the timeframe and the failures defined by the number of times in which failure occurs (t). Because m we are following an increasing failure rate based on a bathtub curve, the time between failures follows a negative exponential evolution of the failure time.
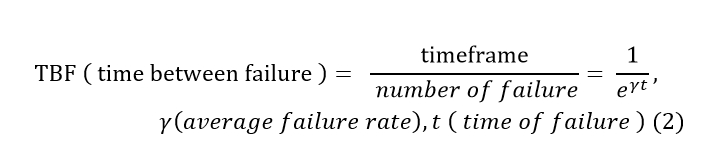
As a result, reliability will be defined as the probability of having less failure which is equal to the maximization of the time between failures.

Assuming that the failure rate takes a different form of distribution, we will have a resilience function formula based on different distribution functions like gamma distribution or Waybill distribution.
Notion on fatigue: The notion of fatigue in used equipment refers to the progressive, localized structural damage that occurs when a material is subjected to repeated or fluctuating stresses below its ultimate tensile strength. This phenomenon is especially critical in the context of mechanical components and structures that experience cycles of loading and unloading during their operational lifetime [5]. Fatigue can lead to failure or significant degradation of equipment performance, even if the applied stresses are relatively low and well below the material's yield strength. Understanding fatigue is essential for predicting the lifespan of used equipment, ensuring its reliability, and maintaining safety standards. Fatigue is a type of distress generally conditioned by exhaustion. It is the deprivation or deterioration of performance through a repetitive activity (Figure 1).
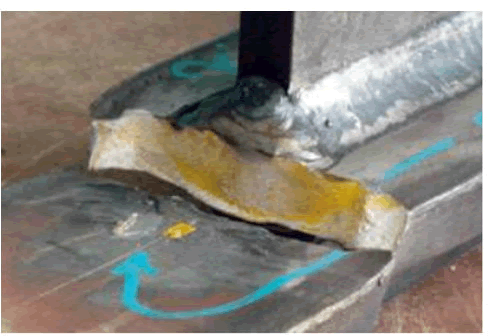
Figure 1: Example of steel fatigue failure.
Key aspects of fatigue in used equipment:
Cyclic loading: Fatigue failures typically result from cyclic stresses, which can vary in magnitude, frequency, and direction. These stresses cause micro-cracks to initiate and gradually propagate through the material until a catastrophic failure occurs.
S-N curve: The relationship between the stress amplitude (S) and the number of cycles to failure (N) is often represented by an S-N curve (or Wohler curve). This curve is a fundamental tool in fatigue analysis, helping to predict the lifespan of a component under varying stress levels.
Cumulative damage: In real-world applications, equipment is seldom subjected to uniform stress cycles. The cumulative damage theory allows for the prediction of fatigue life under variable loading conditions by accounting for the collective effect of different stress cycles over time.
Influence of material and design: The fatigue strength of a component depends on its material properties, manufacturing processes (which can introduce residual stresses or defects), and design factors (such as shape and surface finish). Metals, for instance, exhibit different fatigue behaviors than polymers or composites.
Impact of environmental factors: Environmental conditions, including temperature, humidity, and corrosive environments, can exacerbate fatigue damage. For example, corrosion fatigue results from the combined action of cyclic stress and corrosion.
Fatigue is linked to quality and performance. It is composed of three elements: stress, strain, and exhaustion. When we talk about a repetitive activity, we talk about an intensive application of movement or force called Stress.
Stress is calculated by the formula:

Stress comes with a repetitive application of a movement or a force. The state of exhaustion is defined by the concept of "strain”. Strain is the deformation or deterioration caused by the stress. Strain is the change factor of stress.

the application of stress creates the phenomena of strain which after time results in exhaustion or distress at the end of an extensive activity due to the structural break of elements.
Fatigue is present in every element, for example:
• The fracture of the screen after many utilizations.
• The torsion of a hand after a large extension.
• The fracture of automobile tools after a long time of utilization.
• A motor brake after a long moment of automobile use.
• The deterioration of the street asphalt after years of utilization.
• The technical failure in a production.
• Keyboard deterioration after years of utilization.
• Erosion after heavy rains.
The effect of fatigue on reliability: To understand the effect of fatigue on reliability, we need to understand the reliability lifecycle and the different stages. Reliability in a manufacturing process or a device or machine follows a lifecycle based on three stages: Early infantile mortality of failure, constant failure, and wear-out failure (Figure 2).
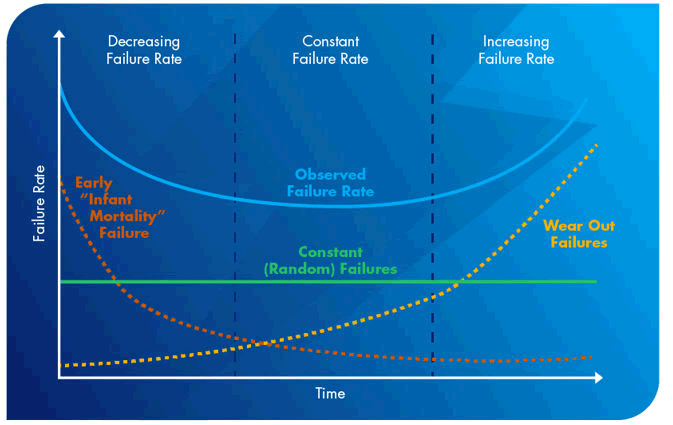
Figure 2: Bathtub curve.
In the early infant stage, the level of failure decreases which means that the element of deterioration "failure" follows a decreasing pattern. In this stage, we cannot talk about fatigue because the element is not subject to any inconvenient factor that may deteriorate the evolution of the process. At this stage, we say that the Stress is equal to zero because the strain is zero.
The second stage of constant failure is defined by observed failure or defection. In this stage, we assume that the process or the machine encounters some level of stress because there is a variation in the production process or a variation in the process result. We are talking about failure as an element that causes deterioration in a process or a machine. The movement or the force applied in the process will be defined as a failure because it affects the condition of the production. As failure is applied a certain number of times or in a particular cycle, the stress will be defined as the failure rate because of its impact on the process.

Fatigue in reliability is expressed as the failure rate because it affects the performance by applying a level of deterioration in the manufacturing process. This deterioration is expressed by the strain which is the degree by which the process vitiates in terms of failure.
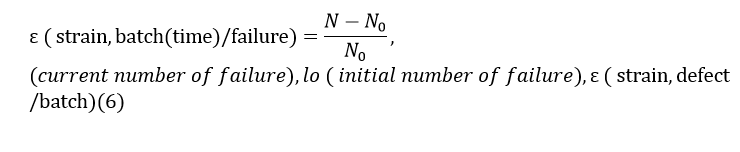
The strain indicates the level by which the stress has affected the process.
Work-related practical case 1: In the construction stone industry a stone breaker machine is used to transform heavy big stones into gravel for construction, the quality is based on dimension, and the smaller the stone, the better the quality. The machine has been producing for a week. On the first day, the operator had to add water two times to break a stone. On the next day, the operator had to remove three heavy stones that were not crushed, on the third and the fourth days the breaker ran smoothly until the fifth day, and on the sixth day, the operator removed three times some rocks in the breaker. The owner of the company still finds the machine very reliable, what to say about it?
As we have few elements to determine the reliability of the machine we will tend to see the effect of fatigue in the machine. Let σ be the stress or the deterioration effect of failure in the machine.

This result shows us that the machine will be having at least one failure a day and this failure will be increasing by the rate of 0.78 failure as we keep using the machine. This shows us the failure rate and the constant by which failure will be involved through this stage.
The concept of stress and stress brings us to understand the notion of elasticity E, elasticity defines how long can the process go without failure as a term of probability. It is represented by the expression:

This simply means that the operator has to wait one day and a half to see the next problem. Those rates are probabilistic but give us a brief overview of how fatigue affects the reliability of the material or the element.
The second stage is the appropriate stage where we experience fatigue because it follows the major conditions for fatigue which are:
• The occurrence of failure or defect by batch or by period.
• There is a constant presence of failure in the system (constant failure rate).
• The failure follows a pattern called "strain" which is increasingly changing.
• The time failure is represented by a decreasing elasticity.
These four conditions, give us an understanding that we are in the second phase of reliability where failure is constant.
The third stage is defined as the braking stage where there is an increase in failure rate or stress and deterioration of the process or material.
Analytical Review with Statistical Inference
As we have defined the effect of fatigue on reliability, we can infer or forecast about the reliability of a process or a used machine using statistical inference techniques. We will examine this possibility by solving a special work-related case study.
Case study: When using a plastic grinder to process plastic for production, the production process is done by a batch of plastic trash which is poured into the grinder. Most of the time a failure results in a man using sticks to unlock the grinder. The grinder was bought from Kenya where the different data are given from the previous usage of the equipment. The grinder is a recently bought used machine. As a technical director of the project, the batch has been running for a year with over 1000 batches, a table representing the number of failures by batch is represented [6]. Supposing that the number of failures by batch becomes 4 because of a supposed apparition of cracks in the machine. The question is asked as to know if the cracks will be bigger when reaching 5 failures by batch (Figure 3 and Table 1).
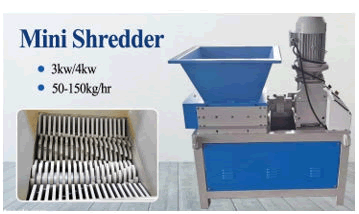
Figure 3: Plastic grinder.
| Mean |
4.25 |
| Standard deviation |
1.748133 |
| Medium |
4 |
| Max |
7 |
| Min |
1 |
Table 1: Failure by batches.
The dynamic environment of plastic recycling and production, and the utilization of plastic grinders play a pivotal role in processing plastic waste into reusable material. This process, inherently batch-oriented, involves the systematic grinding of plastic trash, transforming it into a form suitable for production purposes. However, operational challenges often emerge, particularly in the context of equipment reliability and maintenance. A case in point is the experience encountered with a used plastic grinder recently acquired from Kenya, now at the heart of our production process.
Since its integration into our operations, this grinder has processed over 1000 batches of plastic trash in its first year, signifying a substantial workload and highlighting its critical role in our production line. Despite its contributions, a recurring issue has been observed: The grinder occasionally fails, necessitating manual intervention with sticks to unlock and restart the machine. This workaround, while effective in the short term, raises significant safety concerns and questions regarding the sustainability of current operational practices.
The following Table 2 shows the number of failures using n number of batches as a sample.
| Batch number |
Number of failure |
| 1 |
5 |
| 2 |
4 |
| 3 |
2 |
| 4 |
6 |
| 5 |
4 |
| 6 |
7 |
| 7 |
3 |
| 8 |
3 |
| 9 |
1 |
| 10 |
4 |
| 11 |
6 |
| 12 |
5 |
| 13 |
6 |
| 14 |
3 |
| 15 |
1 |
| 16 |
1 |
| 17 |
2 |
| 18 |
6 |
| 19 |
4 |
| 20 |
5 |
| 21 |
5 |
| 22 |
7 |
| 23 |
4 |
| 24 |
7 |
| 25 |
1 |
| 26 |
4 |
| 27 |
3 |
| 28 |
5 |
| 29 |
4 |
| 30 |
1 |
| 31 |
7 |
| 32 |
7 |
| 33 |
1 |
| 34 |
4 |
| 35 |
5 |
| 36 |
4 |
| 37 |
5 |
| 38 |
5 |
| 39 |
4 |
| 40 |
6 |
| 41 |
4 |
| 42 |
4 |
| 43 |
6 |
| 44 |
6 |
| 45 |
5 |
| 46 |
5 |
| 47 |
6 |
| 48 |
3 |
| 49 |
6 |
| 50 |
5 |
| 51 |
6 |
| 52 |
5 |
| 53 |
6 |
| 54 |
4 |
| 55 |
6 |
| 56 |
6 |
| 57 |
6 |
| 58 |
5 |
| 59 |
5 |
| 60 |
3 |
| 61 |
3 |
| 62 |
5 |
| 63 |
5 |
| 64 |
5 |
| 65 |
5 |
| 66 |
3 |
| 67 |
3 |
| 68 |
5 |
Table 2: Number of failures using n number of batches.
A concerning development has been the recent increase in the frequency of these failures, with data now indicating an average of 4 failures per batch. Preliminary analysis suggests that this uptick in failures may be attributed to the emergence of cracks within the grinder's structure a worrying sign that points to potential underlying issues with the machine's integrity and reliability. The presence of these cracks not only complicates the operational efficiency of the grinder but also poses a direct risk to the safety of the operational staff and the longevity of the machine itself.
Given the critical nature of this situation, a pressing question arises: With the failure rate escalating to 4 instances per batch, is there a risk that these cracks could worsen, potentially leading to even higher failure rates, possibly reaching 5 failures per batch? This question not only underscores the immediate need for a detailed investigation into the relationship between failure rates and the structural integrity of the grinder but also highlights the broader implications for our production process, equipment maintenance strategies, and safety protocols [7].
As the technical director overseeing this project, it is imperative to approach this issue with a comprehensive analytical framework, leveraging statistical inference and mechanical analysis to assess the risk posed by the current trend of increasing failures. This investigation will not only aim to confirm the correlation between the observed failures and the structural deterioration of the grinder but also to inform the development of robust mitigation strategies to ensure the continued reliability and safety of our production process.
First of all, to assert our hypotheses, we have to give ourselves a confidence level, as a personal guess, let's say that our confidence level is 90 % with a z-score=1.645 with α=0.10. To make inferences about 1000 batches based on a sample, we have to identify what type of inference are we into. As we do not know the standard deviation of the population N, we will have to use the sample standard deviation n. For our case, we will be using the p-value test, the z-test, With a mean μ=4.25 with a standard deviation δ=1.74. Based on our knowledge, the Stress will be represented by 4.25 failures by batch with a strain of 1.74 failures by batch.
Our hypothesis will be
We will conduct a one-tail test with two assumptions, if we assert our first hypothesis, we assume that there is a crack in the machine when reaching 10 failures by batch. If our hypothesis fails to be verified, then we need further testing to be more accurate.
With that perspective m using the Z-score, we will find the probability of defect or the reliability function to be equal to: This case study shows us how the effect of fatigue interacts with the reliability of a machine or a process. Using statistic inference, we can formulate multiple hypotheses and verify them. This method helps us to forecast our production and to evaluate different theories we have about reliability.

This case study shows us how the effect of fatigue interacts with the reliability of a machine or a process. Using statistic inference, we can formulate multiple hypotheses and verify them. This method helps us to forecast our production and to evaluate different theories we have about reliability.
We draw several important conclusions regarding the impact of fatigue on the reliability of the used plastic grinder in question. The statistical analysis aimed to evaluate whether the observed increase in failure rates, specifically moving from an average of 4.25 failures per batch with a standard deviation of 1.74 based on a sample size of 68 batches, was indicative of worsening conditions in the machine, potentially due to the development of cracks.
The hypothesis set forth was twofold:
• H0: μ ≥ 4.25, suggesting that the mean failure rate would not decrease and could potentially indicate worsening conditions due to fatigue.
• H1: μ<4.25, suggesting an improvement or no significant worsening in the condition of the machine that would contradict concerns over increasing fatigue-related damage.
Upon analyzing with a specified confidence level of 90% and a corresponding Z-score threshold of 1.645, the calculated Zscore from the sample data was 3.55 [8]. This value significantly exceeds the critical value, indicating that the probability of observing such a difference if H0 were true is extremely low (with a p-value approximately equal to 0.003, which is less than the significance level p=0.10 α=0.10).
Therefore, the conclusion drawn from this analysis is that we reject the null hypothesis (H0). This suggests that the data does not support the hypothesis that the condition of the machine is deteriorating to the extent that would result in a significant increase in failure rates per batch due to the development of cracks. Instead, the observed failure rate does not statistically signify an increase in fatigue-induced damage beyond the established average of 4.25 failures per batch.
This conclusion underscores the importance of employing statistical inference in evaluating equipment reliability and the effects of fatigue. By systematically analyzing operational data through statistical tests, we can make more informed decisions regarding maintenance, operational adjustments, and equipment replacement. It also highlights the necessity of continuous monitoring and analysis, as such statistical findings can guide preventive measures to mitigate further risks associated with equipment fatigue and reliability, ensuring the sustainability and safety of the production process.
It's critical, however, to interpret these results within the context of operational realities, including the physical inspection of equipment for signs of wear or damage not captured by statistical measures alone. While statistical analysis provides valuable insights into trends and probabilities, the physical condition of the machine and other operational factors should also inform maintenance strategies and operational decisions.
Conclusion
Based on the comprehensive analysis of fatigue and reliability in used equipment through statistical inference, we can draw several key conclusions that have significant implications for industrial operations and equipment management. This study has underscored the importance of integrating statistical methods to assess and predict the performance and lifespan of machinery that has been subjected to varying degrees of use and environmental conditions.
Significant role of statistical inference: The application of statistical inference, including techniques like hypothesis testing, regression analysis, and survival analysis, has proven to be invaluable in identifying patterns of equipment degradation and failure. These methods offer a robust framework for understanding how fatigue impacts equipment reliability over time, enabling more accurate predictions of equipment lifespan and maintenance needs.
Predictive maintenance and operational efficiency: The findings highlight the potential of statistical analysis to inform predictive maintenance strategies. By identifying early signs of fatigue and potential failure points, organizations can schedule maintenance activities proactively, minimizing downtime and improving operational efficiency. This approach contrasts with traditional reactive maintenance, which only addresses issues after a failure has occurred.
Enhanced safety and cost savings: Understanding the relationship between fatigue and equipment reliability can significantly enhance workplace safety by reducing the likelihood of unexpected equipment failures that could pose risks to operators. Additionally, by optimizing maintenance schedules and extending equipment lifespan, organizations can achieve substantial cost savings, reducing the need for premature equipment replacements and avoiding costly unplanned downtime.
Customized solutions for equipment management: The study demonstrates that the effects of fatigue and reliability vary significantly across different types of equipment and operational contexts. Therefore, statistical models need to be tailored to the specific characteristics of each piece of machinery, taking into account its usage history, operational conditions, and maintenance records. Customized analysis ensures that predictive models are as accurate and relevant as possible, providing actionable insights for equipment management.
Continuous monitoring and data collection: The success of applying statistical inference to analyze equipment fatigue and reliability heavily relies on the availability of comprehensive and high-quality data. Continuous monitoring and systematic data collection practices are essential for maintaining up-to-date models that reflect the current condition of equipment. This ongoing data analysis supports dynamic adjustments to maintenance strategies as new information becomes available.
Fatigue has an important place in reliability. It is a factor defining the lifecycle of reliability. Fatigue takes place in the constant failure stage of the life cycle. This notion opens us to different notions of inference based on statistic inference techniques. Many authors only see reliability as an ability to perform. However, reliability is a hard to predict the future and different hazardous events. Based on that, we can use the fatigue notion which affects reliability to infer about future aspects of our production or of our tool. Also, “With the development of modern industry and ever more complex structural loads, the possibility of fatigue failure is increasing. Fatigue analysis can be used to evaluate the service life of components and reduce the probability of accidents. Therefore, the development and application of fatigueanalysis technology have important research significance". Fatigue needs to have a greater place in reliability with the evolution of customer requirements and technology, the everlasting will always be a factor of quality and performance. Our paper emphasizes different basic notions in understanding fatigue and its place and effect on reliability. We express fatigue as a component of the reliability function. Based on that integration m we have turned our understanding to build the hazard function based on different inferences on future problems and failure using statistical methods. This perspective brings us to define reliability as an anticipative science of future problems related to the commitment to performance and quality. Further study needs to be done to extrapolate the impact of fatigue with different forms of experimental trials and scientific notions.
References
- Cockerham J (2023) What is the bathtub curve and why should you care? Manager Plus.
- Echard B, Gayton N, Bignonnet A (2014) A reliability analysis method for fatigue design. Int J Fatigue. 59:292–300.
[Crossref] [Google Scholar]
- Gudipudi P, Underwood BS (2016) Reliability analysis of fatigue life prediction from the viscoelastic continuum damage model. Transp Res Rec. 2576(1):91–99.
[Crossref] [Google Scholar]
- Bagdonavicius V, Nikulin M (2009) Statistical models to analyze failure, wear, fatigue, and degradation data with explanatory variables. Commun Stat Theory Methods. 38(16-17):3031-3047.
[Crossref] [Google Scholar]
- Cameron ZA, Krantz TL (2023) Statistical distribution of gear surface fatigue lives at high reliability. Int J Fatigue. 167:107350.
[Crossref] [Google Scholar]
- Wang R (2021) Fatigue reliability assessment of steel bridges considering spatial correlation in system evaluation. Struct Infrastruct Eng. 19(2):254-268.
[Crossref] [Google Scholar]
- Zhang L (2023) Methods for fatigue-life estimation: A review of the current status and future trends. Nanotechnol Precis Eng. 6(2):025001.
[Crossref] [Google Scholar]
- Zhang Z (2023) Structural fatigue reliability evaluation based on probability analysis of the number of zero-crossings of the stochastic response process. Eng Fail Anal. 143:106923.
[Crossref]
Citation: Lutete AK (2025) Analyzing the Effect of Fatigue and Reliability in Used Equipment Using Statistics Inference. Br J
Res. 12:143.
Copyright: © 2025 Lutete AK. This is an open-access article distributed under the terms of the Creative Commons
Attribution License, which permits unrestricted use, distribution, and reproduction in any medium, provided the original author
and source are credited.