Keywords
Alkaline Phosphatase; Bilirubin
Abbreviations
ALP alkaline phosphatase; TB total bilirubin
INTRODUCTION
A vital organ of human being is liver which has
various important functions such as protein synthesis,
decomposition of red blood cells, detoxification, glycogen
storage, and production of biochemical and hormone. The
liver has multidimensional functions, and it is also prone
to many diseases. Note that there are more than 100
different forms of known liver disease caused by many risk
factors [1, 2, 3]. The most common disease throughout the
world is the liver disease which is caused by damaged or
inflammation hepatocyte in liver [4, 5, 6, 7]. In every year,
throughout the world, more than one million of new liver
cancer patients are diagnosed [8]. Even more dreadful is
the real situation that liver cancer is not easily identified,
as the liver is able to maintain regular activity even if there
are some partially damaged. The imaging diagnosis of early
stage hepatic cirrhosis, hepatitis, and hepatic fibrosis is
still very complicated as they lack morphological changes.
However, a few hemodynamic changes of the liver diseases
are generally observed [8, 9]. The most important steps in
liver cancer treatment is the early diagnosis of the disease.
Many research articles have pointed that dietary
factors have great effects on liver biochemical markers [8, 10, 11]. In animals or healthy humans, fat ingestion has
been identified to elevate serum ALP levels. It is happened either if a high-fat diet is absorbed or if fat is included in a
test meal [12, 13, 14]. Intravenous infusion of glucose in
rabbits develops an increase in the hepatic excretion of
conjugated bilirubin [15]. A few medium-chain fatty acids
decrease in binding of bilirubin to albumin in vitro [16].
In practice, excess alcohol consumed (>80 g/day for more
than 5 years) (excluding other causes of cirrhosis) may
produce alcoholic cirrhosis [12, 17].
There is a little study on the explanatory factors of
serum alkaline phosphatase (ALP), considering the real
fact that it is non-normal, heteroscedastic and positive.
It is identified that the response ALP is heterogeneous,
and non-normally distributed. Therefore, ALP should
be analyzed by joint generalized linear models (JGLMs)
namely, gamma or Log-normal [18, 19, 20, 21]. In order to
confirm the analysis, the present considered data set has
been analyzed using both the gamma and Log-normal joint
generalized linear models. It is found that joint Log-normal
models give better results. Both the analysis results are
given in the article.
The article attempts to know the answer of the following
quarries or hypotheses. What are the explanatory factors
or determinants of the serum alkaline phosphatase (ALP)?
How are the explanatory factors correlated with the ALP?
What are the functional activities of the explanatory factors
on ALP? These quarries or hypotheses are evaluated in
the article, using a real data set of 583 subjects with 9
continuous variables and 2 attribute characters.
MATERIALS AND STATISTICAL METHODOLOGY
Materials
The current report considers a real data set of 583
subjects with 9 continuous variables and 2 attribute
characters. The data set was collected from the North-East
of Andhra Pradesh, India. The data set can be obtained
from https://archive.ics.uci.edu/ml/machine-learningdatabases/
00225/. The statement of the explanatory
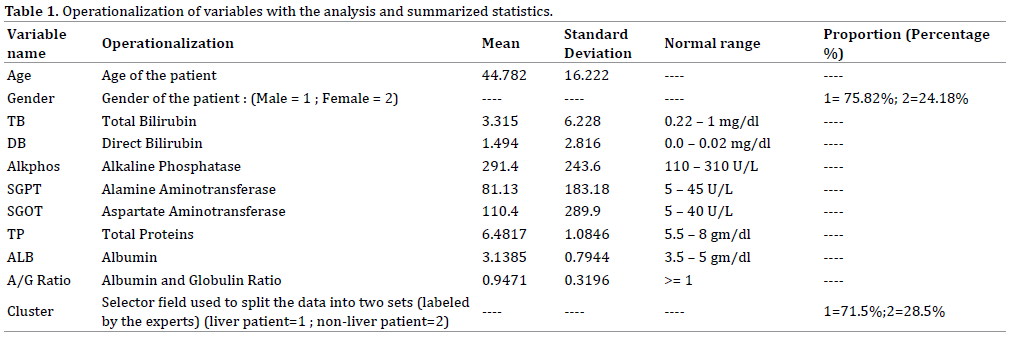
variables, and levels of the attribute characters are given in Table 1. The descriptive statistics such as the proportion,
mean, normal range of the biochemical parameters, and
standard deviation are displayed in Table 1. There are
75.82% male patients, and 24.18% female patients. Liver patients (71.5%) are more than the non-liver patients
(28.5%) in the given data set. The statement of the subject
population and the information collection method are
displayed in [22, 23]. This is not described again in the
report.
Statistical Methods
The usual regression models consider that the variance
of the response (Y) is constant within the whole range of
the variable. However, this assumption is not true always
[24]. Generally, biochemical data are heterogeneous. For
example, the ALP values for the liver disease patients
are heterogeneous. In order to remove the non-constant
variance of a data set, the log-transformation is generally
used, but practically, the heteroscadasticity of the data set
may not always be removed [24, Table 2].
Positive data from the continuous variables with
constant variance or constant coefficient of variation may
be analyzed either by the Log-normal or the gamma models
[21]. Generally, physiological data are heterogeneous, so
these two models may not give similar results [19, 20, 25, 26, 28]. In practice, generalized linear models class is
used to analyze non-normal, heteroscedastic and positive
data set. Generally, the mean and variance of the response
variable may be related in the generalized linear models, as
a result the variance of the response may be non-constant.
For the analysis of non-constant variance positive data yi ’s, Nelder and Lee [28] have suggested to use the joint
generalized linear models (JGLMs). A detailed discussion
of JGLMs is given in [18, 19, 27, 28]. For ready reference, a
short description of the JGLMs is reproduced herein.
For the positive data Yi ’s, when
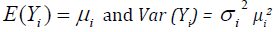
The log transformation Zi = log (Yi) is used to stabilize
the variance Var  . If one needs better models,
an improved statistical tool is used. Generally, the variance
may not be stabilized always by a simple transformation
[24]. Then Nelder and Lee [28] have suggested to use
JGLMs.
. If one needs better models,
an improved statistical tool is used. Generally, the variance
may not be stabilized always by a simple transformation
[24]. Then Nelder and Lee [28] have suggested to use
JGLMs.
For the positive dependent variable Yi, the log
transformation Zi = logYi is applied. The joint modeling for the mean and variance under Log-normal distribution is
given by
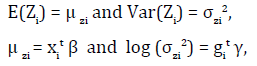
where xit and git denote respectively, the row vectors for
the regression coefficients β (mean model) and γ (variance
model).
For the positive dependent variable yi ’s, if

where are the dispersion parameters and
  is the variance function. In generalized linear models, the
variance has two portions. One portion is that
depends on the mean values. The other portion is σi2 that
is free of mean values. The variance function identifies the
distribution family in GLMs. For example, the distribution
is gamma if
is the variance function. In generalized linear models, the
variance has two portions. One portion is that
depends on the mean values. The other portion is σi2 that
is free of mean values. The variance function identifies the
distribution family in GLMs. For example, the distribution
is gamma if  , Poisson if
  , and Normal
if
, and Normal
if  , etc.
The mean and variance models of JGLMs are

where g(⋅) and h(⋅) are respectively the GLM
link functions for mean and variance, and  denote respectively, the row vectors for the regression
coefficients β (mean model) and γ (variance model).
Maximum likelihood (ML) method is used to estimate β
(mean model), and restricted ML (REML) method is used
to estimate γ (variance model) [18, 19].
denote respectively, the row vectors for the regression
coefficients β (mean model) and γ (variance model).
Maximum likelihood (ML) method is used to estimate β
(mean model), and restricted ML (REML) method is used
to estimate γ (variance model) [18, 19].
It is well-known that the serum alkaline phosphatase
(ALP) is a liver biomarker. Higher than normal levels of
ALP (Table 1) in blood may indicate a problem with liver
or gall bladder. This could include hepatitis (infection),
cirrhosis (scarring), liver cancer, gallstones, or a blockage in our bile ducts. The article considers ALP as the
dependent variable to examine the hypotheses as stated
in Introduction. The response serum alkaline phosphatase
is positive with non-constant variance, and it belongs to
exponential family distribution. Therefore, such data are
generally, analyzed by the Log-normal or gamma models as
stated above. In order to confirm the derived results, both
the above models are used to perform the analysis. Now
we are interested to investigate the following using both
the models. What are the approximate true models of ALP
for the liver disease patients? What are the explanatory
factors (or determinants) of ALP? What are the effects of
the explanatory factors on the ALP? These quarries are
addressed in the next sections.
Alkaline Phosphate (ALP) Value Analysis, Results and
Interpretations
Analysis: Alkaline phosphate (ALP) value is the
continuous positive response random variable of interest
in the article. There are remaining 8 continuous, and 2
attribute explanatory variables. In case of attribute factors,
we have considered the constraint that the effects of the
first levels are zero. Hence, for each attribute factor, the
first level is considered as the reference level by estimating
it as zero. The main effect of A is denoted by ai for i = 1, 2,
3. We have considered  , so that
  . Therefore,
the estimate of the effect A2 is the difference between the
second and the first levels in the main effect A.
. Therefore,
the estimate of the effect A2 is the difference between the
second and the first levels in the main effect A.
Alkaline phosphate vale is considered as the response
variable in the current analysis and the rest other variables
or factors are considered as the explanatory variables. We
have modeled the response ALP using both the Log-normal
and gamma models [18, 19]. The final fitted models have
been selected on the basis of smallest Akaike information
criterion (AIC) value in each class. It is known that the AIC selects a model which minimizes the predicted additive
errors and squared error loss [28]. The Log-normal and
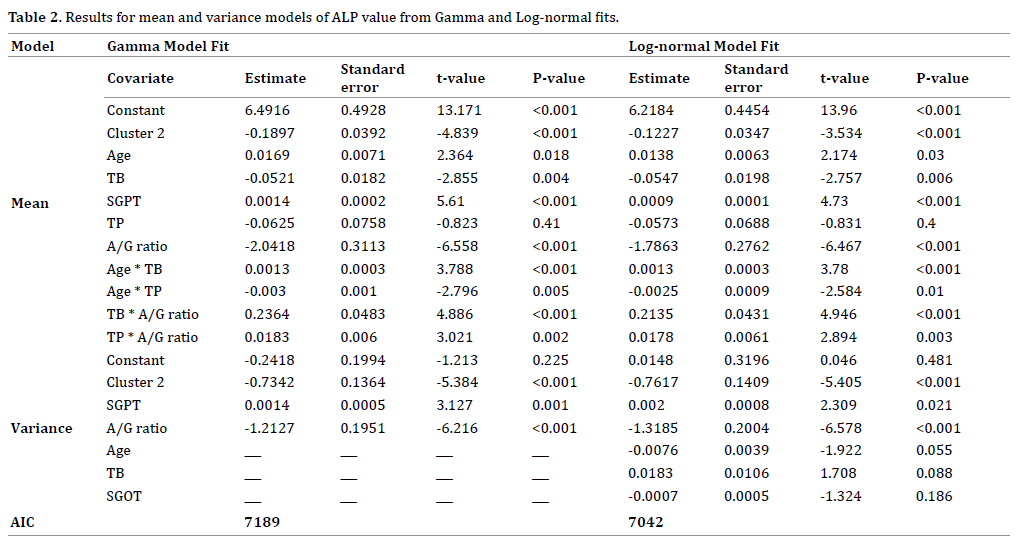
the gamma fitted models results of ALP are given in Table
2. Table 2 shows that the Log-normal fitted models (AIC=
7042) give better results than the gamma fitted models
(AIC=7189). It is not always necessary that all the selected
effects are significant [29]. Some insignificant effects are
retained in the model in order to respect the marginality
rule, namely that when an interaction term is significant all
related lower-order interactions and main effects should
be included in the model [30]. In epidemiology, statistical
insignificant included factors or variables in the fitted
models are known as confounder. For model checking
diagnosis plots, we have plotted the absolute residuals and
normal probability plots for the fitted joint Log-normal
models (Table 2) as they are better fitted models.
Figure 1(a) presents the absolute residuals plot of
the fitted Log-normal models (Table 2) with respect to
fitted values. It is a straight flat diagram, implying that the
variance is constant with the running means. The normal
probability plot for the fitted mean model of Log-normal
fit (Table 2) is given in Figure 1(b). There is no lack of fit,
or systematic departure in the Figure 1(b). Therefore, the
fitted Log-normal models (Table 2) are approximate true
models of ALP.
Figure 1. For the fitted Log-normal models of ALP (Table 2), the (a). absolute residuals plot with respect to fitted values, and the (b). normal probability
plot of the mean model
RESULTS
The mean serum alkaline phosphatase (ALP) is
negatively associated with the types of liver patients
(P<0.001), or total bilirubin (TB) (P=0.006), or albumin
to globulin ratio (A/G) (P<0.001), or interaction effects
of albumin to globulin ratio (A/G) with total proteins
(TP) (A/G*TP) (P=0.003). The mean ALP is positively
associated with the age (P= 0.030), or SGPT (P<0.001), or
interaction effect of age with total bilirubin (TB) (Age*TB)
(P<0.001), or interaction effect of albumin to globulin ratio (A/G) with the total bilirubin (TB) (A/G*TB) (P<0.001), or
interaction effect of albumin to globulin ratio (A/G) with
total proteins (TP) (A/G*TP) (P=0.003).
The variance of serum alkaline phosphatase is
negatively associated with the types of liver patients
(P<0.001), or albumin to globulin ratio (A/G) (P<0.001),
or age (P=0.055), or SGOT (P=0.186). The ALP variance
is positively associated with the SGPT (P<0.001), or total
bilirubin (TB) (P=0.088).
Interpretations of Liver Disease Data Analysis
Summarized results of the serum alkaline phosphatase
value analysis are given in Table 2. Table 2 presents
results of joint gamma and Log-normal models. Note that
joint Log-normal models give better results. Therefore, the
following interpretations are drawn based on Log-normal
models (Table 2).
*The mean alkaline phosphates (ALP) is negatively
significantly correlated with the patient types (liver
patient=1, non-liver patient=2) (P<0.001). This indicates
that ALP value is higher for liver disease patients than nonliver
patients.
*The mean ALP is positively correlated with the
subjects age (P=0.030), implying that the mean ALP value
increases at senior ages.
*The mean ALP is negatively significantly correlated
with the total bilirubin (TB) (P=0.006), indicating that the
total bilirubin increases as the ALP value decreases.
*The mean ALP is positively significantly correlated with
Alamine Aminotransferase (SGPT) (P<0.001), indicating
that the mean ALP increases as the SGPT increases.
*The mean ALP is negatively significantly correlated with
the Albumin to globulin ratio (A/G) (P<0.001), indicating that
the mean ALP increases as the A/G ratio decreases.
*The mean ALP is positively significant associated with
the interaction effect of age and the total bilirubin (TB)
(Age*TB) (P<0.001), indicating that the ALP increases as
the interaction effect (Age*TB) increases.
*The mean ALP is negatively significant associated
with the interaction effect of age and the total protein (TP)
(Age*TP) (P=0.010), indicating that the ALP increases as
the interaction effect (Age*TP) decreases.
*The mean ALP is positively significant associated
with the interaction effect of total bilirubin (TB) and the
Albumin to globulin ratio (A/G) (TB*A/G) (P<0.001),
implying that the ALP increases as the interaction effect
(TB*A/G) increases.
*The mean ALP is directly significantly correlated with
the interaction effect of total protein (TP) and the Albumin to
globulin ratio (A/G) (TP*A/G) (P=0.003), indicating that the
ALP increases as the interaction effect (TP*A/G) increases.
*The variance of Alkaline Phosphates (ALP) is inversely
significantly correlated with the patient’s type (liver
patient=1, non-liver patient=2) (P<0.001), implying that
the ALP variance is higher for liver patients than the nonliver
patients.
*The ALP variance is directly significantly correlated
with Alamine Aminotransferase (SGPT) (P=0.021),
implying that the ALP variance increases as the SGPT
increases.
*The ALP variance is reciprocally significantly
correlated with the Albumin to globulin ratio (A/G)
(P<0.001), indicating that the ALP variance decreses as the
A/G ratio increases.
*The ALP variance is reciprocally significantly
correlated with the age (P=0.055), implying that the ALP
variance is higher at junior ages.
*The ALP variance is directly significantly correlated
with the total bilurubin (TB) (P= 0.088), indicating that the
ALP variance increases as TB increases.
The final fitted Log-normal mean and variance models
(Table 2) of ALP value of the liver patients, respectively,
are

and

DISCUSSION
The article has considered Alkaline Phosphates (ALP)
as the dependent variable. The estimated ALP values can
be derived from the fitted Log-normal models. Fitted
results for the two models are given in Table 2. These
two fitted models show very close results, except a few
additional covariates included in the fitted Log-normal
variance model. The explanatory factors of the ALP values
have been derived in the article using the fitted Log-normal
models (Table 2).
It has been identified in the article that the mean
alkaline phosphatase (ALP) value is higher for the liver
patients than non-liver patients. It is higher at senior ages
of the liver patients than the junior ages. It decreases as
the total bilirubin increases, while it increases as the SGPT
increases. The mean ALP decreases as the albumin to
globulin ratio increases. Interaction effect such as age with
total bilirubin (TB) (Age*TB), age with total proteins (TP)
(Age*TP), albumin to globulin ratio (A/G) with the total
bilirubin (TB) (A/G*TB), total proteins (TP) with albumin
to globulin ratio (A/G) (A/G*TP) are significant effects on
the mean ALP.
The article has considered 583 patients with all nonmissing
information. The current results are not similar
to earlier results. For example, SGOT is not a significant
determinant of the ALP (Table 2) in the present report,
but it is significant in some other articles [31, 32]. Similarly,
age, total bilirubin (TB), albumin to globulin ratio (A/G
ratio) are significant factors for ALP in the present article,
but these factors are not significant in the previous articles
[17]. In the present report, many interaction effects such
as Age*TB, Age*TP, TB*A/G, TP*A/G are significant on the
mean ALP (Table 2), which are not reported in the earlier
reports. Many ALP variance determinants such as patient’s
type, SGPT, age, albumin to globulin ratio, total bilirubin,
SGOT are significant in the present reports which are not
reported in the previous articles [31, 32].
CONCLUSION
The current models may provide many determinants
of Alkaline Phosphates. Based on the present results, it
may be possible to take the necessary action to control
the Alkaline Phosphates value. Medical practitioners,
researchers and the liver patients may be benefited
from the current report. Every individual should care on
Alkaline Phosphates values at older ages. Note that at older
ages with higher values of total bilirubin, and total protein
increase the Alkaline Phosphates values.
Conflict of Interest
The authors confirm that this article content has no
conflict of interest.
References
- Rang HP, Dale MM, Ritter JM, Moore PK. Pharmacology. 5th ed. Bath:
Churchill Livingstone; 2003.
- Robbins SL, Kumar V, Cotran RS. Robbins and Cotran Pathologic Basis
of Disease. Philadelphia, PA: Saunders/Elsevier; 2010.
- El-serag HB, Mason AC. Rising incidence of hepatocellular carcinoma
in the United States. N Engl J Med 1999; 340:745-50. [PMID: 10072408]
- Deuffic S, Poynard T, Buffat L, Valleron AJ. Trends in primary liver
cancer. Lancet 1998; 351:214–215. [PMID: 9449893]
- Godley PA, Sandler RS. Liver cancer, in: Digestive Diseases in the
United States: Epidemiology and Impact, J.E. Everhart, ed., Washington,
D.C., Government Printing Office, 1994; 227–241, (NIH publication no.
94–1447).
- Kew MC. Hepatic tumors and cysts, in: Sleisenger & Fordtran’s
Gastrointestinal and Liver Disease: Pathology/diagnosis/management,
6th ed, vol. 1, M. Feldman, M.H. Sleisenger and B.F. Scharschmidt, eds,
Philadelphia: W.B., Saunders, 1998; 1363–1387.
- Okuda K, Fujimoto I, Hanai A, Urano Y. Changing incidence of
hepatocellular carcinoma in Japan. Cancer Res 1987; 47:4967–4972.
[PMID: 3040235]
- Deems RO, Friedman LS, Friedman MI, Munoz SJ, Deems DA, Maddrey
WC. Relationship between liver biochemical tests and dietary intake in
patients with liver disease. J Clin Gastroententerol 1994; 18: 304–308.
[PMID: 8071515]
- Lin RH. An intelligent model for liver disease diagnosis. Artif Intell
Med 2009; 47:53–62.
- Orrego H, Blendis LM, Crossley IR, Medline A, Macdonald A, Ritchie
S, Israel Y, Correlation of intrahepatic pressure with collagen in the
Dissespace and hepatomegaly in humans and in the rat. Gastroenterology
1981; 80:546–556. [PMID: 19540738]
- Larkin FA, Metzner HL, Thompson FE, Flegal KM, Guire KE.
Comparison of estimated nutrient intakes by food frequency and dietary
records in adults. J Am Diet Assoc 1989; 89:215–223. [PMID: 2915094]
- McDowell CM, Ross MH. Dietary fat, age and hepatic alkaline
phosphatase activity in the rat. Growth 1966; 30:177–185.
[PMID: 5963696]
- Malagelada JR, Stolbach LL, Linscheer WG. Influence of carbon chain
length of dietary fat on intestinal alkaline phosphatase in chylous ascites.
Dig Dis 1977; 22:629–632. [PMID: 879129]
- Young GP, Friedman S, Yedlin ST, Alpers DH. Effect of fat feeding on
intestinal alkaline phosphatase activity in tissue and serum. Am J Physiol
1981; 241:461–468. [PMID: 7325238]
- Munoz ME, Gonzalez J, Esteller A. Effects of glucose administration
on bilirubin excretion in the rabbit. Experientia 1987; 43:166–168.
[PMID: 2949996]
- Brodersen R. Free bilirubin in blood plasma of the newborn: Effects of
albumin, fatty acids, pH, displacing drugs, and phototherapy, in: Intensive
Care in the Newborn, L. Stern, W. Oh and B. Friis-Hansen, eds, New York:
Masson Publishing, 1978; 331–345.
- Das RN. Relationships of liver biochemical parameters and effects of
wine drinking. Model Assist Stat Appl 2013; 8:163–175.
- Lee Y, Nelder JA, Pawitan Y. Generalized Linear Models with Random
Effects (Unified Analysis via H-likelihood), Chapman & Hall, London, 2006.
- Das RN, Lee Y. Log normal versus gamma models for analyzing data
from quality-improvement experiments. Qual Eng 2009; 21:79-87.
- Das RN, Park JS. Discrepancy in regression estimates between lognormal
and gamma: Some case studies. J Applied Statistics 2012; 39:97-111.
- Firth D. Multiplicative errors: log-normal or gamma? J R Stat Soc
Series B Stat Methodol 1988; 50:266-268.
- Ramana BV, Babu MSP, Venkateswarlu NB. A Critical Study of Selected
Classification Algorithms for Liver Disease Diagnosis. Int J Database
Manag Sys 2011; 3:101-14.
- Ramana BV, Babu MSP. Liver Classification Using Modified Rotation
Forest. Int J Eng Res Dev 2012; 1:17-24.
- Myers RH, Montgomery DC, Vining GG. Generalized linear models
with applications in engineering and the sciences. New York: John Wiley
and Sons 2002.
- Das RN, Mukherjee S, Panda RN. Association between Body Mass
Index and Cardiac Parameters of Worcester Heart Attack Study. BAOJ Cell
Mol Cardio 2016; 2:1-6.
- Das RN, Mukherjee S. Joint Mean-Variance Overall Survival Time
Fitted Models from Stage III Non-Small Cell Lung Cancer. Epidemiology
(Sunnyvale) 2017; 7:296.
- Das RN. Robust Response Surfaces, Regression, and Positive Data
Analyses. Chapman & Hall, London, 2014.
- Nelder JA, Lee Y. Generalized linear models for the analysis of
Taguchi-type experiments. Appl Stoch Models Bus Ind 1991; 7:107-120.
- Hastie T, Tibshirani R, Friedman J. The Elements of Statistical
Learning, Springer-Verlag, 2001.
- Nelder JA. The statistics of linear models: back to basics. Statistics
and Computing 1994; 4:221–234.
- Babu MSP, Swapna K, Balakrishna T, Venkateswarlu NB. An
Implementation of Hierarchical Clustering on Indian Liver Patient
Dataset. Int J Emerg Technol Comput Appl Sci 2014; 8:543-547.
- Ramana BV, Babu MSP, Venkateswarlu NB. A Critical Comparative
Study of Liver Patients from USA and INDIA: An Exploratory Analysis.
Int J Comput Sci 2012; 9:506-516.