Research Article - (2023) Volume 7, Issue 3
Water quality assessment and source apportionment of Huangpu River water pollution in Shanghai City, eastern China using APCS-MLR
Yueya Chang*
Shanghai Urban Construction Vocational College, Shanghai, 201415, P.R. China
*Correspondence:
Yueya Chang,
Shanghai Urban Construction Vocational College, Shanghai, 201415,
P.R. China,
Email:
Received: 04-Aug-2023, Manuscript No. IPJAPT-23-17235;
Editor assigned: 07-Aug-2023, Pre QC No. IPJAPT-23-17235;
Reviewed: 21-Aug-2023, QC No. IPJAPT-23-17235;
Revised: 28-Aug-2023, Manuscript No. IPJAPT-23-17235;
Published:
04-Sep-2023, DOI: 10.36648/2581-804X.23.9.21
Abstract
As a result of increasing anthropogenic disturbance, the degradation of the surface water environment has be�come a key concern for water resource management. Controlling possible pollution sources is necessary for pro�tecting water resources. In this paper, water quality data from online monitoring national control stations were analyzed in terms of pH, Water Temperature (WT), Electrical Conductivity (EC), turbidity (NTU), dissolved oxygen (DO), and concentrations of permanganate index (CODMn), ammonium nitrogen (NH3 + –N), total nitrogen (TN), total phosphorus (TP). Principal component analysis/factor analysis (PCA/FA) was employed to qualitatively figure out the potential sources of river water pollution of Huangpu River in Shanghai City, eastern China. An absolute prin�cipal component score-multiple linear regression (APCS-MLR) receptor model was used to analyze each source’s contribution to the variables affecting water quality quantitatively. The results showed that all observed water quality indices met the quality criteria specified in the Chinese surface water standards, except for TN. Five sources of river water pollution were identified, and their contribution ratios in a descending order were as follows: The meteorological process (26%)>agricultural activities (14%)>industrial sewage (10%)>natural environmental sourc�es (4%)=domestic sewage (4%). Therefore, recommendations for enhancing the quality of surface water resources in this area involve decreasing agricultural pollution and improving the sewage system.
Keywords
Surface water; Water quality; Source apportionment; APCS-MLR model; Huangpu river
Introduction
As the main source of fresh water on the Earth’s surface, rivers
play an irreplaceable role in human survival and social development.
In recent years, with accelerated urbanization and
rapid economic development, river pollution has drawn great
attention from the government and the public [1-3]. According
to studies, the primary factors responsible for a decrease
in river water quality are excessive sewage discharges from industry,
households, and agriculture, particularly in developing
countries [1,4-6]. When a river is polluted, it can significantly
impact the overall water quality of the surrounding aquatic
environment because it plays an essential role in the hydrological
cycle [7,8]. For this reason, the implementation of accurate
source identification and allocation in the management
of pollution sources is of paramount importance in assessing
and safeguarding the integrity of water resources [9,10]. According
to the Bulletin of Ecology and Environment in China in
2022 (MEEC, 2022), 12.1% of surface water was unsuitable for
drinking in 2022, Yangtze River Basin, Pearl River Basin, Zhejiang
and Fujian piece of rivers, northwest rivers, and southwest
rivers water quality is excellent, the Yellow River Basin, Huaihe
River Basin, and Liaohe River Basin water quality is good, the
Songhua River Basin and the Haihe River Basin for light contamination.
Principal component analysis/factor analysis (PCA/
FA) is traditional mathematical and statistical methods. PCA/
FA linearly transforms variables using orthogonal transformation.
These techniques have a proven efficacy in qualitatively
identifying sources of pollution. However, they lack the capacity
to accurately determine the precise contributions of sources
[11-15]. Positive Matrix Factorization (PMF), chemical mass
balance, Unmix, absolute principal component score-multiple linear regression (APCS-MLR), and global optimal inverse models
which are models use statistical methods and mathematical
algorithms to estimate the contributions of different pollutant
sources and provide valuable insights into the sources of pollution
in soil, air, and water [9,11,15-21]. The APCS-MLR models
have been commonly used to quantify pollution sources
in different water bodies, such as lakes, rivers coastal water,
and groundwater [9,15,18,20,22]. In recent years, numerous
researches have demonstrated the stability of these models,
however, the APCS-MLR model proves to be more effective
in handling data sets with parameter of varying magnitudes
analyzed a water quality dataset consisting of 15 parameters
collected from eight sampling sites in the tributaries and mainstream
of the Min River [9,11,16,17,20,21]. The APCS-MLR
model was employed to identify potential sources of pollution
and allocate their respective contributions. Similarly, the five
sources of river water contamination that identified were as
follows, with the contribution ratios listed in descending order:
The geogenic process (24%) is more prevalent in the Xinbian
River of Anhui Province, Eastern China than agricultural activities
(21%), sources related to chicken farming (17%), residential
pollution (9%) and transportation pollution (5%) [17].
These studies have important implications for regional water
resources management. Shanghai is located in East China, on
the West Coast of the Pacific Ocean and the eastern edge of the
Asian continent, part of the alluvial plain of the Yangtze River
Delta. Previous studies have shown that deteriorated river water
quality significantly affects the economic development and
the health of people in this area [23,24]. In recent years, the
water systems of Shanghai have been greatly improved by the
execution of a series of water-management plans. Since 2017,
Shanghai has started a new phase of large-scale water environment
management. In 2018, the black odor of small and medium-
sized rivers was essentially eliminated, and in 2020, the
inferior Grade V water bodies were essentially eliminated. In
the Huangpu River Waterfront Area Construction Plan (2018-
2035), a spatial development strategy of “two cores and multiple
nodes” is intended for the area along the Huangpu River,
with each portion being staggered and synergistic, and the
core functions of finance, innovation, and culture with global
competitiveness being built out in a cluster fashion in the most
significant sections. Upstream The Xupu Bridge to Dianshan
Lake segment strengthens the strategic ecological conservation
function basis and effectively integrates the functions of life,
recreation, culture, and innovation industry. The core section
(Yangpu Bridge to Xupu Bridge) concentrates on carrying the
core functions of finance, business, culture, commerce, and
recreation of the international metropolis, and provides public
activity space with global influence. The downstream section
(Wusongkou to Yangpu Bridge) provides development space
for innovative functions based on regional transformation and
upgrading, and strengthens the integration of ecological and
public functions and living functions used the chemical oxygen
demand, total phosphorus, dissolved oxygen, ammonium nitrogen
and biochemical oxygen demand and showed that after
the river remediation work of Yangpu District in 2017, the
main pollutants in the river converted from ammonium nitrogen
to total phosphorus, indicating that the river remediation
improves the self-purification ability of the river, which had a
remarkable influence on the water quality [23]. However, no
study has been conducted to characterize online monitoring
statistics of the whole river. Therefore, this study selected the
Huangpu River, known as the “Mother River of Shanghai,” as
the study area, and used mathematical and statistical analysis
techniques PCA/FA combined with the APCS-MLR model to
• Evaluate the seasonal characteristics of river water quality
in the study area,
• Identify potential sources of primary water elements, and
• Quantify the source inputs and contribution variables for
each water quality parameter. The findings of this study
are expected to help assess the water quality and potential
sources of pollution in the Huangpu River in Shanghai and
enable stakeholders to more effectively manage pollutants
entrance into the river and improve surface water quality
in this area.
Material and Methods
Study Area
Shanghai is located in a longitude belt of 120°52’E to 122°12’E
and a latitude belt of 30°40’N to 31°53’N, Shanghai has a
four-season, north subtropical monsoon climate with plenty
of sunlight and rain. The weather in Shanghai is moderate
and muggy, with longer winters and summers than springs and
autumns. The city had an average temperature of 17.9°C and
1474.5 mm of precipitation in 2021. Between June and September,
there is a concentration of 66.1% of the yearly precipitation.
Shanghai’s elevation is 2.19 m on average. Shanghai’s
highest point is DaJinshan Island, which is 103.7 m above sea
level [19]. Huangpu River, the upper reaches of which are located
in the southwest of Shanghai, flows through Qingpu, Songjiang,
Fengxian, Minhang, Xuhui, Huangpu, Hongkou, Yangpu,
Pudong New Area, Baoshan and other districts to Wusongkou
with a total length of 113.4 kilometers, and the main stream of
Huangpu River from Mishidu to Wusongkou is 82.5 kilometers
long [19]. Huangpu River is a lake source river network tidal
river, is the main source of drinking water, industrial water,
agricultural irrigation water in Shanghai, and plays an important
role in shipping and other aspects. Additionally, it is also a
receiving water body for Shanghai’s wastewater discharge, resulting
in water pollution. Therefore, the local water resources
management department has planned to develop the Huangpu
River (the sampling section of the river) in the coming years
to better support functional area development (Figure 1). Four
sampling sections were shown as follows: “1” stands for Dianfeng,
“2” stands for Linjiang, “3” stands for west Minhang border
(Songpu Bridge), “4” stands for Wusongkou.
Sampling and Analysis
The study employed water quality data from online monitoring
national control stations from January to December 2021 of
Wusongkou to investigate the intra-year variable characteristics
of the water quality of the Huangpu River. As Wusongkou is
the Huangpu River’s downstream exit, and because the catchment
area encompasses the whole basin, it may represent the
features of the water body as a whole and serve as a foundation
for determining the primary component findings in the
study of the sources of pollution that follows. As a result of the COVID-19 outbreak resulted in Shanghai’s closure control, the
study did not include data from 2022. The Huangpu River’s pollution
sources will be investigated using a total of 60 average
online water quality data points covering the first, second, and
third 10 days of each month from January to May 2023. From
the national monitoring website, information on water quality
was obtained. The water quality parameters for investigation
in this study included electrical conductivity (EC), dissolved oxygen
(DO), water temperature (WT), turbidity (NTU), pH, permanganate
index (CODMn), ammonium nitrogen (NH3
+–N), total
nitrogen (TN), total phosphorus (TP).

Figure 1: Map of surface water quality sampling sites in Huangpu River
of Shanghai, China
PCA-APCS-MLR Model
The APCS-MLR is a receptor model integrating the two statistical
methods of APCS and MLR. This model is suggested to
quantify the contribution of pollution sources to water quality
parameters in the basins based on the PCA model Thurston et
al. (1985). The core idea of PCA is dimensionality reduction,
which reduces a large number of indicators to a small number
of indicators to represent the majority of original materials
[12,25]. In order to identify potential factors affecting water
quality, PCA was used to analyze each data group that the
CA had indicated. By computing the covariance and principal
components of separation (PCs), a linear combination of eigenvectors
and original variables, PCA may assess the degree of
dispersion in water quality data. Closely related to PCA, factor
analysis (FA) can be applied in a variety of ways to polarize the
loadings of the original variables and obtain new factors, called
varifactors (VFs), that more effectively explain the potential information
contained in the original variables [26,27].
The data must first be examined for goodness-of-fit to the
log-normal distribution using Kolmogorov-Smirnov (K-S) statistics
before doing PCA. All of the variables prepared for PCA had
log-normal distributions with confidence levels greater than or
equal to 95%, according to K-S statistics. To determine whether
the data in this study were suitable for PCA, Kaiser-Meyer-Olkin
(KMO) and Bartlett’s Test of Sphericity statistical analyses were
carried out [8,28,29]. Absolute factor loadings [0.30-0.50],
[0.50-0.75], and > 0.75 were considered to be weak, moderate,
and strong loadings, respectively. The greater the absolute value
of load, the stronger the correlation between water quality
parameters and principal components, and the positive and
negative signs indicate the positive and negative correlation
between them [30].
Principal Component Analysis
PCs are expressed as follows:
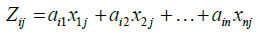
where Z is the component score; a is the component loading;
x is the measured value of the variable; i is the component
number; j is the sample number; and n is the total number of
variables. Absolute principal component score-multiple linear
regression (APCS-MLR) Principal Component Scores (PCS) calculated
by PCA were converted to absolute principal component
scores (APCS); then the source contributions to pollutant
concentrations could be calculated by using multiple linear regression
(MLR):
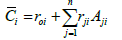
where r0i is the multiple regression constant term for the i pollutant,
which means the contribution of the i pollutant from
the sources cannot be explained PCs derived from PCA, rji is the
regression coefficient of the j source for the i parameter, and
rjiAji is the contribution of the j source to the i parameter. The
mean value of rjiAji for all samples represents the mean contribution
of the j source. Although the sources represented by the
APCS-MLR model can have negative influence onwater quality
indicators, the Environmental Protection Agency’s (EPA) Unmix
and PMF models with non-negative restrictions might be perplexing
when they show contributions from several sources.
According to Gholizadeh et al. (2016), negative contributions
can be changed into positive ones in the following ways to help
with the quantitative evaluation of source contributions [18]:
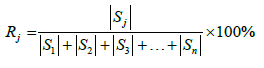
where Rj is the contribution ratio of the j source; and S1, S2, S3,
and Sn are the contributions of the first, second, third, and n
sources, respectively.
Results and Discussion
Temporal and Spatial Variations in Water Quality
Overall, NH3-N, TN, and TP are all significant indicators of eutrophication, CODMn is one of the primary indicators of organic pollution in water bodies, DO is essential for aquatic life and is recognized as a fundamental marker of water quality, and NTU, EC, and pH are significant physicochemical indices [25]. Basic statistics of physicochemical variables of water quality in Huangpu River of the four sampling sites within 5 months are presented in Table 1. Generally, TN had relatively high levels compared to National Surface Water Quality Standard of China (GB3838-2002), worse than the Grade V, the mean concentrations of CODMn, NH3–N, TP were Grade II of the standard, and DO was Grade I. Only the TN concentration was very poor, indicating that agricultural non-point source pollution is likely to be the main cause of pollution in this river. concentrations ranged from 1.75 mg/L to 4.66 mg/L in 12 months, the mean TN concentration was 2.61 mg/L exceeding the Grade V of the National Surface Water Quality Standard of China (GB3838-2002). The highest mean TN (4.17 mg/L) appeared from January to March. The TN concentration fluctuated greatly in the first 3 months, then decreased gradually from April, and then increased from July to September. TP concentrations were basically stable throughout the year, except for September reached the highest of 0.25 mg/L, mean concentration of TP was 0.15 mg/L within Grade of water quality standard. The mean concentrations of CODMn and NH3–N met the Grade II of water quality standard (3.38 mg/L and 0.23 mg/L). Mean concentrations of CODMn during August to October (August 4.05 mg/L, September 3.70 mg/L, October 4.15 mg/L) were slightly higher than those during the other months, while mean concentrations of NH3–N during September (0.07 mg/L) and October (0.09 mg/L) were lower. However, it should be noted that NH3–N in some month is very close to Grade I of the standards (0.15 mg/ L). Throughout the year, mean concentrations of CODMn and TP of Wusongkou water were not fluctuated much, while mean concentrations of NH3–N and TN fluctuated greatly from January to March.
Table 1: Statistical descriptions of the Huangpu River's water quality (Arithmetic Mean [Mean], Standard Deviation [SD], Coefficient of Variation [CV], and grade of water quality [grade])
| Parameters |
Mean |
SD |
CV |
Grade |
| WT(°C) |
14.71 |
5.04 |
0.34 |
- |
| pH |
7.77 |
0.5 |
0.06 |
|
| DO |
8.46 |
1.59 |
0.19 |
I |
| EC/(µS/cm) |
623.35 |
71.36 |
0.11 |
- |
| NTU |
96.34 |
69.27 |
0.72 |
- |
| CODMn/(mg/L) |
3.92 |
1.72 |
0.44 |
II |
| NH3-N/(mg/L) |
0.26 |
0.18 |
0.69 |
II |
| TP/(mg/L) |
0.1 |
0.04 |
0.43 |
II |
| TN/(mg/L) |
3.34 |
1.49 |
0.45 |
worse than V |
PCA-APCS-MLR Model
The number of data samples in this study complied with Thurston and Spengler’s (1985) recommendation that the degree of freedom of the data set should be greater than 50 in order to get a reliable PCA/FA outcome. Bartlett’s p-value for sphericity was 0.000 and the KMO value was 0.629, both of which showed that there were significant correlations between the input parameters. Therefore, source identification in this investigation was attainable using PCA/FA. The first five VFs were obtained in accordance with Kaiser’s criteria (eigenvalue greater than 1), and they accounted for 86.2% of the total variance. It shows the loadings of each parameter in the five VFs (Figures 2-3). The first VF (VF1) showed strong positive loadings (> 0.750, 0.863) on DO, moderate positive loading on NH3-N (> 0.50, 0.625), and a strong negative loading on WT (<-0.750, -0.958), accounting for 31.6% of the total variance. DO is determined by WT, the NH3–N concentration is affected by WT. Indeed, nitrification reaction accelerates the consumption of ammonia nitrogen when the temperature rises, which leads to a decrease in NH3–N concentration in the water environment [31]. Thus, VF1 might represent meteorological sources.

Figure 2: Temporal characteristics of water quality in Wusongkou ("4" sampling site) from January to December in 2021

Figure 3: Component loadings for 9 variables following varimax rotation
The second VF (VF2), which occupied 25.9% of the total variance, showed a strong positive loading on NTU (0.775), a strong negative loading on pH (-0.858), and a moderate positive loading on TP (0.648) and NH3-N (0.500). pH is affected by water temperature, the ion concentration, the activities of aquatic organisms, and the partial pressure of atmospheric carbon dioxide. NTU is calculated by insoluble substances of sediment, planktonic algae, corrosive matter, and colloidal particles suspended in water. Due to the domestic sewage discharge and its rich phosphorus and nitrogen into the water body, which will affect the NTU and pH of the water body, so VF2 could reflect the influence of industrial sewage? The third VF (VF3) accounted 11.4% of the total variance and showed a strong positive loading on TN (0.883) a moderate positive loading on TP (0.614). TN and TP seem to be primarily more affected by manure and chemical fertilizer application than by domestic and industrial sewage. According to Wang L et al. VF3 could reflect the influence of the activities such as the application of fertilizers in agricultural activities [32]. The fourth VF (VF4) explained 9.9% of the total variance and showed a strong positive loading on EC (0.923). Water contains a variety of dissolved salts present in the form of ions. E is used to predict the total ion concentration or salt content in water [33]. This result indicates that VF4 was mainly related to salt ions in the water it may be attributed to natural ionic group sources from river inflow. Thus, VF4 might represent natural environmental sources. The fifth VF (VF5) explained 7.5% of the total variance and showed a strong positive loading on CODMn (0.979), and no other factors play strong or moderate relationships with VF5, so this result indicates that VF5 was mainly related to domestic sewage.
The APCS-MLR model was employed to determine the contribution ratio of each source and quantify its contribution to each water quality indicator based on the outcomes of source identification using PCA/FA. According to fig, the determination coefficient (R2) between the parameters that were observed and those that were predicted ranged from 0.79 to 0.99, with a mean value of 0.87, demonstrating a satisfactory fit between the two values (Figure 4). The APCS-MLR model could therefore accurately estimate source apportionment [18,20,22]. The meteorological process (VF1) had a significant influence on DO, NH3-N, and WT, with high contribution ratios for DO (81.9%), NH3-N (40.2%), and WT (39.9%) (Figure 5). The largest contribution to NTU (30.2%) and TP (27.4%) came from industrial sewage (VF2). The contribution ratios from agricultural activities (VF3) application for TP, TN, and CODMn were 51.6%, 37.8%, and 14.5%, respectively. EC (10.6%) and NTU (8.7%) were primarily caused by natural environmental sources (VF4) in water. Domestic sewage (VF5) made up 30.9% of CODMn’s contribution. However, the concentrations of some pollutants in the area are still high and additional treatment is needed. Therefore, local governments should take measures to control pollutant emissions from agriculture and industry to improve river water quality in the future [34-38].

Figure 4: Scatter plots of observed and APCS-MLR-predicted concentrations of water quality

Figure 5: Effects of pollution sources on river water pollution calculated with the APCS-MLR model A) Contributions of sources to each water quality parameters. B) Average contributions of pollution sources
Limitations of this Study
This study involves certain uncertainties since the methods, as well as the data, are limited. Since the lack of water quality data, this study does not provide a clear picture of changes in the temporal scale of the main pollution sources. When further information is available, additional research will be required based on the factors mentioned above.
Conclusion
This study used PCA and correlation analysis to extract and identify
potential pollution sources in the Huangpu River in Shanghai,
China, and the APCS-MLR receptor model partitioned their
contribution to each quality variable. Overall, TN was the most
important pollution index in the river, which exceeded Class V
of China’s National Surface Water Quality Standard (GB3838-
2002). The results showed that PCA/FA identified five factors
responsible for river water quality degradation, accounting
for 86.2% of the total variation. The average contribution of
weather process, agricultural activity, industrial wastewater,
natural environmental sources, and domestic wastewater was
26%, 14%, 10%, 4%, and 4%, respectively. In the Huangpu River,
the main pollution sources shifted to weather processes, agricultural
activities, and industrial sources, indicating that the area’s
ecological environment has improved after long-term pollution
management and control. In consideration of this, the
study provided the following recommendations for improving
drainage systems, reinforcing livestock regulations, and reducing
agricultural pollution in the study area.
Statement of Ethics
This study was conducted following the ethical standards of the
Declaration of Helsinki, and the confidentiality of patients’ data
was respected. Written informed consent was obtained from
the participant.
Patient Consent
The patient has given consent for possible publication of this
case report.
Acknowledgement
I am grateful to MOONAPI for the data collection.
Conflict of Interest Statement
No conflict of interest to disclose.
Funding Sources
None.
Author Contribution
All the authors contributed to the study’s development. All the
authors have reviewed the statistical analysis and validated the
manuscript’s final version.
Data Availability Statement
All data generated or analysed during this study are included
in this article. Further enquiries can be directed to the corresponding
author.
Provenance and Peer Review
Not commissioned, externally peer reviewed.
References
- Reitz A, Hemric E, Hall KK (2021) Evaluation of a multivariate analysis modeling approach identifying sources and patterns of nonpoint fecal pollution in a mixed use watershed. J Environ Manage 277(3): 111413.
[Crossref] [Google Scholar]
- Albergamo V, Schollee JE, Schymanski EL, Helmus R, Timmer H, et al. (2019) Nontarget screening reveals time trends of polar micropollutants in a riverbank filtration system. Environ Sci Technol 53(13): 7584-7594.
[Crossref] [Google Scholar]
- Wijesiri B, Liu A, Deilami K, He BB, Hong NA, et al. (2019) Nutrients and metals interactions between water and sediment phases: An urban river case study. Environ Pollut 251: 354-362.
[Crossref] [Google Scholar]
- Xu Z, Xu J, Yin H, Jin W, Li H (2019) Urban river pollution control in developing countries. Nat Sustain 2(3): 158-160.
[Crossref] [Google Scholar]
- Xu H, Paerl HW, Zhu GW, Qin BQ, Hall NS, et al. (2017) Long-term nutrient trends and harmful cyanobacterial bloom potential in Hypertrophic Lake Taihu, China. Hydrobiologia 787(1): 229-242.
[Crossref] [Google Scholar]
- Varol M, Gokot B, Bekleyen A, Sen B (2012) Spatial and temporal variations in surface water quality of the dam reservoirs in the Tigris River Basin, Turkey. Catena 92: 11-21.
[Crossref] [Google Scholar]
- Tong YD, Zhang W, Wang XJ, Couture RM, Larssen T (2017) Decline in Chinese Lake phosphorus concentration accompanied by shift in sources since 2006. Nat Geosci 10(7): 507.
[Crossref] [Google Scholar]
- Han Q, Tong RZ, Sun WC, Zhao Y, Yu JS, et al. (2020) Anthropogenic influences on the water quality of the Baiyangdian Lake in North China over the last decade. Sci Total Environ 701: 134929
[Crossref] [Google Scholar]
- Zhang H, Cheng S, Li H, Fu K, Xu Y (2020) Groundwater pollution source identification and apportionment using pmf and pca-apca-mlr receptor models in a typical mixed land-use area in Southwestern China. Sci Total Environ 741(1): 140383.
[Crossref] [Google Scholar]
- Tong YD, Zhang W, Wang XJ, Couture RM, Larssen T (2017) Decline in Chinese Lake Phosphorus concentration accompanied by shift in sources since 2006. Nat Geosci 10(7): 507.
[Crossref] [Google Scholar]
- Yu L, Zheng TY, Yuan RY, Zheng XL (2022) APCS-MLR Model: A convenient and fast method for quantitative identification of nitrate pollution sources in groundwater. J Environ Manage 314(2): 115101.
[Crossref] [Google Scholar]
- Xiao MS, Bao FY, Wang S, Cui F (2016) Water quality assessment of the Huaihe River segment of Bengbu (China) using multivariate statistical techniques. Water Resour 43(1): 166-176.
[Crossref] [Google Scholar]
- Jabbar FK, Grote K (2019 Statistical assessment of nonpoint source pollution in agricultural watersheds in the Lower Grand River Watershed, Mo, USA. Environ Sci Pollut Res 26(2): 1487-1506.
[Crossref] [Google Scholar]
- Muangthong S, Shrestha S (2015) Assessment of surface water quality using multivariate statistical techniques: Case study of the Nampong River and Songkhram River, Thailand. Environ Monit Assess 187(9): 548.
[Crossref] [Google Scholar]
- Ma Z, Li H, Ye Z, Wen J, Hu Y (2020) Application of modified Water Quality Index (Wqi) in the Assessment of coastal water quality in main aquaculture areas of Dalian, China. Mar Pollut Bull 157: 111285.
[Crossref] [Google Scholar]
- Zhang H, Li H, Yu H, Cheng S (2020) Water quality assessment and pollution source apportionment using multi-statistic and APCS-MLR modeling techniques in Min River Basin, China. Environ Sci Pollut Res 27 (33): 41987-42000.
[Crossref] [Google Scholar]
- Chen K, Liu QM, Peng WH, Liu Y, Wang ZT (2023) Source apportionment of river water pollution in a typical agricultural city of Anhui Province, Eastern China using multivariate statistical techniques with APCS-MLR. Water Sci Eng 16(2): 165-174.
[Crossref] [Google Scholar]
- Gho Yu Zadeh MH, Melesse A, Reddi L (2016) Water quality assessment and apportionment of pollution sources using APCS-MLR and pmf receptor modeling techniques in three major rivers of South Florida. Sci Total Environ 566: 1552-1567.
[Crossref] [Google Scholar]
- Liu LL, Tang Z, Kong M, Chen X, Zhou CC (2019) Tracing the potential pollution sources of the coastal water in Hong Kong with statistical models combining APCS-MLR. Journal of Environmental Management 245: 143-150.
[Crossref] [Google Scholar]
- Li W, Wu J, Zhou C, Nsabimana A (2021) Groundwater pollution source identification and apportionment using Pmf and Pca-APCS-MLR receptor models in Tongchuan City, China. Arch Environ Contam Toxicol 81(3): 397-413.
[Crossref] [Google Scholar]
- Cho YC, Choi H, Lee MG, Kim SH, Im JK (2022) Identification and Apportionment of potential pollution sources using multivariate statistical techniques and APCS-MLR model to assess surface water quality in Imjin River Watershed, South Korea. Water 14(5): 793.
[Crossref] [Google Scholar]
- Zhou J, Hu M, Liu M, Yuan J, Ni M, et al. (2022) Combining the multivariate statistics and dual stable Isotopes methods for nitrogen source identification in coastal rivers of Hangzhou Bay, China. Environ Sci Pollut Res 29(55): 82903-82916.
[Crossref] [Google Scholar]
- Wu Y (2023) Water quality change and pollution characteristics analysis of the Huangpu River in Yangpu District of Shanghai in 2016-2021. J Environ Monit Restor 15(1): 80-84.
- Xu Z, Yin H (2003) Huangpu river water quality improvement analysis. Shanghai Environmental Sciences 22 (3): 167-170.
[Crossref] [Google Scholar]
- Ravindra K, Thind PS, Mor S, Singh T, Mor S (2019) Evaluation of groundwater contamination in Chandigarh: Source identification and health risk assessment. Environ Pollut, 255(1): 113062.
[Crossref] [Google Scholar]
- Zheng LY, Yu HB, Wang QS (2015) Assessment of temporal and spatial variations in surface water quality using multivariate statistical techniques: A case study of Nenjiang River Basin, China. J Cent South Uni 22(10): 3770-3780.
[Crossref] [Google Scholar]
- Chattopadhyay A, Singh AP, Singh SK, Barman A, Patra A, et al. (2020) Spatial variability of arsenic in Indo-Gangetic basin of Varanasi and its Cancer risk assessment. Chemosphere 238: 124623.
[Crossref] [Google Scholar]
- Duan WL, He B, Nover D, Yang GS, Chen W, et al. (2016) Water quality assessment and pollution source identification of the Eastern Poyang Lake basin using multivariate statistical methods. Sustainability 8(2): 133.
[Crossref] [Google Scholar]
- Zhong MF, Zhang HY, Sun XW, Wang ZY, Tian W, et al. (2018) Analyzing the significant environmental factors on the spatial and temporal distribution of water quality utilizing multivariate statistical techniques: A case study in the Balihe Lake, China. Environ Sci Pollut Res 25(29): 29418-29432.
[Crossref] [Google Scholar]
- Liu CW, Lin KH, Kuo YM (2003) Application of factor analysis in the assessment of groundwater quality in a blackfoot disease area in Taiwan. Sci Total Environ 313(1-3): 77-89.
[Crossref] [Google Scholar]
- Chaturvedi R, Banerjee S, Das B, Chattopadhyay P, Bhattacharjee CR, et al. (2016) High Nitrate Content in the surface water of Balipara, North Brahmaputra River Basin, Sonitpur District, Assam, India: A multivariate approach. Curr Sci 110(7): 1350-1360.
[Crossref] [Google Scholar]
- Wang L, Gao S, Yin X, Yu X, Luan L (2019) Arsenic accumulation, distribution and source analysis of Rice in a typical tor growing area in North China. Ecotoxicol Environ Saf 167: 429-434.
[Crossref] [Google Scholar]
- Cheng G, Wang M, Chen Y, Gao W (2020) Source apportionment of water pollutants in the upstream of yangtze river using APCW-MLR. Environ Geochem Health 42(11): 3795-3810.
[Crossref] [Google Scholar]
- Le TV, Do DD, Nguyen BT (2023) Spatiotemporal assessment and pollution-source identification and quantification of the surface water system in a coastal region of Vietnam. Hydrol Sci J 68(6): 782-793.
[Crossref] [Google Scholar]
- Thurston GD, Spengler JD (1985) A quantitative assessment of source contributions to inhalable particulate matter pollution in metropolitan Boston. Atmos Environ 19(1): 9-25.
[Crossref] [Google Scholar]
- Wang HL, An JL, Cheng MT, Shen LJ, Zhu B, et al. (2016) One year online measurements of water-soluble ions at the industrially polluted town of Nanjing, China: Sources, seasonal and diurnal variations. Chemosphere 148: 526-536.
[Crossref] [Google Scholar]
- Yang J, Holbach A, Wilhelms A, Krieg J, Qin Y, (2020) Identifying spatio-temporal dynamics of trace metals in shallow Eutrophic Lakes on the basis of a case study in Lake Taihu, China. Environ Pollut 264: 114802.
[Crossref] [Google Scholar]
- Zhang QQ, Wang HW, Wang YC, Yang MN, Zhu L (2017) Groundwater quality assessment and pollution source apportionment in an intensely exploited region of Northern China. Environ Sci Pollut Res 24(20): 16639-16650.
[Crossref] [Google Scholar]
Citation: Chang Y (2023) Water Quality Assessment and Source Apportionment of Huangpu River Water Pollution in Shanghai City, Eastern China using APCS-MLR. J Aqua Pollut Toxicol. 7:21.
Copyright: © 2023 Chang Y. This is an open-access article distributed under the terms of the Creative Commons Attribution License, which permits unrestricted use, distribution, and reproduction in any medium, provided the original author and source are credited.