Research Article - (2022) Volume 9, Issue 11
Utilization of Pharmacy Value-Added Services and Its Association with Waiting Time for Medication Collection in Public Health Institutions across Malaysia
Mazuin Mahmud Taridi1,
Muhammad Radzi Abu Hassan2,
Rozita Mohamad3,
Chan Huan Keat2,
Chan Pui Lim4,
Ong Chin Wen5,
Khairul Iman Muzakir6,
Azuana Ramli6 and
Noraini Nordin4*
1Department of Pharmacy, Hospital Tunku Azizah (Women & Child Hospital), Ministry of Health Malaysia, Malaysia
2Department of Clinical Research Centre, Hospital Sultanah Bahiyah, Ministry of Health Malaysia, Malaysia
3Department of Pharmacy Practice and Development Division, Pahang State Health, Ministry of Health Malaysia, Malaysia
4Department of Pharmacy Policy and Strategic Planning Division, Pharmaceutical Services Programme, Ministry of Health Malaysia, Malaysia
5Pharmacy Practice and Development Division, Institute of Pharmaceutical Services Programme, Ministry of Health Malaysia, Malaysia
6Department of Pharmacovigilance Section, Institute of National Pharmaceutical Regulatory Agency, Ministry of Health Malaysia, Malaysia
*Correspondence:
Noraini Nordin,
Department of Pharmacy Policy and Strategic Planning Division, Pharmaceutical Services Programme, Ministry of Health Malaysia,
Malaysia,
Email:
Received: 01-Nov-2022, Manuscript No. IPBJR-22-14173;
Editor assigned: 03-Nov-2022, Pre QC No. IPBJR-22-14173;
Reviewed: 17-Nov-2022, QC No. IPBJR-22-14173;
Revised: 22-Nov-2022, Manuscript No. IPBJR-22-14173;
Published:
29-Nov-2022, DOI: 10.35841/2472-1646.22.9.116
Abstract
Background: Pharmacy Value-Added Services (PVAS) have long been offered in public health institutions across Malaysia as an alternative to conventional counter services for prescription refills, with the aim to reduce the waiting time.
Objective: To assess the utilization of the PVAS in individual health institutions and its association with the achievement of the Key Performance Indicator (KPI) set for the pharmacy waiting time.
Method: This was a cross-sectional study based on the data contributed by 142 hospitals and 648 health clinics throughout 2018. The availability and uptake of the PVAS were summarized as percentages. The impacts of the PVAS uptake and the other institution related factors on the KPI achievement were further explored using the logistic regression analysis.
Results: Approximately 2.9 million (17.1%) of the refill prescriptions were dispensed via the PVAS. The appointment and pickup services (42.7%) and the Integrated Drug Dispensing System (23.7%) emerged as the most commonly used types of PVAS. A higher PVAS uptake was associated with a better KPI achievement (OR=0.91, 95% CI: 0.84-0.98). In contrast, adding a new type of PVAS to the existing services yielded an opposite outcome (OR=1.48, 95% CI: 1.15-1.89). Both the prescription load and location of health institutions were also found have influenced the KPI achievement.
Conclusion: The PVAS are generally well accepted in Malaysia and showed to have reduced the pharmacy waiting time. However, strategies to optimize the PVAS uptake are warranted.
Keywords
Pharmacy; Public health; Value added services; Waiting time; Prescription load
INTRODUCTION
Universal access to high quality healthcare is the ultimate goal
of public health systems worldwide. One of the strategies to
improve the quality of healthcare is by finding a way to reduce
the waiting time for health services [1]. Prolonged waiting time
in health institution is always associated with poor patient satisfaction,
which is also believed to have increased the stress
level and affected the health related quality of life, particularly
among the chronically ill population [2]. Therefore, a wide
range of innovative measures, including the use of an automated
prioritization system, have been taken not only to ease the
congestion in health institutions but also to prioritize the care
for vulnerable populations [3].
In the context of pharmacy practice, waiting time typically refers
to the time required for patients to collect their medications
from the pharmacy counter following a medical consultation,
or to get a refill of their prescriptions [4]. Apart from reflecting
poorly on the efficiency of healthcare providers, prolonged waiting
time in a pharmacy setting could adversely affect their commitment
to their treatment plan [5]. While providing sufficient
information upon dispensing is crucial to ensure medication adherence
in patients [6]. It remains a challenge for pharmacists
to professionally perform such a task under time pressure. In
addition to causing a long waiting time at the pharmacy department,
the conventional counter dispensing services might have
also inconvenienced some patients by requiring them to make
additional trips to health institutions for refills [7,8]. Other than
that, longer waiting time at pharmacy counter could possibly
due to manual prescription by doctors which make it challenging
for the pharmacist to read as well as at some facilities the
pharmacy’s counter and space are too small as compared to the
number of patients they have to serve [9].
As the pharmacy services are likely to have a great impact on
the overall impression of the health system, the waiting time
at the outpatient pharmacy department has long been made
by the Ministry of Health (MOH) as one of the key performance
indicators (KPIs) for all the public hospitals and clinics in Malaysia
as well as the Client Charter in MoH facilities. It is mandated
that at least 95% of prescriptions, both new and refill, be
filled and dispensed within 30 minutes at the outpatient pharmacy
department [10]. However, the increasing patient load
constantly stands in the way of meeting the standard set for
the KPI. In 2017 alone, the public health institutions in Malaysia
received a total of 58.7 million prescriptions, approximately
12.2% higher than the number of prescriptions received in the
previous year [11].
In the wake of such limitations, the MOH has been impelling
for the use of a series of novel services, collectively known as
the Pharmacy Value-Added Services (PVAS), for the prescription
refills since the last decade [11,12]. The common types of PVAS
made widely available in public hospitals and clinics across the
country include:
• The appointment and pickup services, which allow patients
to set an appointment date for their subsequent refills
by using either an appointment card or various modes of
communication, such as phone calls, short message service
(SMS), communication applications, fax and email.
• The Integrated Drug Dispensing System (IDDS), a nationwide
standard referral system allowing patients to get their
refills from a preferred health institution near to the patients
house under the Ministry of Health, Malaysia.
• The drive through services, which allow patients to pick up
their refills without having to park or leave their vehicles.
• The medication deliveries by post services, which allow the
refills directly sent to where a patient lives or work at minimal
postal charges [12]. Meantime, a number of health
institutions have also been making efforts to initiate new
forms of PVAS to complement the conventional pharmacy
counter services.
As compared with the similar services provided in other countries
[13,14]. The strength of the PVAS lies in the variety of the
services offered, each of which could be tailored according to
the capacity of an institution and the need of a local community.
As much as the PVAS are expected to improve the patient
satisfaction, the uptake of the services is voluntary and patients
are still allowed to opt for conventional counter services to pick
up their monthly refills. Although the last few years witnessed
an increase in the number of refill prescriptions dispensed via the PVAS, [15]. The association between such an initiative and
the pharmacy waiting time for medication collection remains
unclear. The existing studies on the PVAS are generally limited
by the their single center design and a relatively small sample
size [12,16]. As efforts and resources have been put in by public
health institutions in Malaysia to initiate the PVAS, this study
was designed to assess the utilization of the services and its association
with the achievement of the KPI set for the pharmacy
waiting time on a nationwide scale.
Methods and Materials
Study Design and Data Source
This was a retrospective cross sectional study on the utilization
of the PVAS and how it influenced the waiting time for medication
collection in 2018. The findings were generated based
on the data collected by the Pharmaceutical Services Program
(PSP) from the public health institutions, both hospitals and
health clinics, which were known to have provided at least one
type of the PVAS in 2018. The health institutions which were
not staffed with pharmacists or pharmacy assistants, and those
managing only acute and uncomplicated cases which did not
require patients to refill their prescriptions, were excluded. The
implementation of the PVAS had been centrally coordinated
and monitored by the PSP since they were launched. Each institution
offering the PVAS was required to submit report on
the utilization of the services quarterly. Meanwhile, the PSP has
also been closely monitoring the waiting time at the outpatient
pharmacy departments of all the public health institutions. In
this context, the pharmacy waiting time referred to the duration
between the point at which a prescription was received at
a pharmacy counter and the point at which patients were called
to pick up their medications.
Data Collection and Assessment
This study was registered and approved with the National
Medical Research Register (NMRR) Malaysia (NMRR-19-3040-50122). The data was directly obtained from the PSP dataset.
A data collection form was constructed to gather the following
information of each health institution:
• The prescription load (the number of new prescriptions,
refill prescriptions and items per prescription)
• The capacity (the number of counters and pharmacy staff)
• Utilization of the PVAS (the types of PVAS offered and the
uptake of each service)
• The average waiting time for medication collection and the
achievement of the KPI
• The setting (hospital or clinic) and location (Northern Peninsula,
Central Peninsula, Southern Peninsula, East Coast or
East Malaysia).
The PVAS uptake in each health institution was calculated in
relation to the total number of refill prescriptions received in
the same year. According to their prescription load, the health
institutions were grouped into group 1 hospitals, group 2 hospitals,
group 1 health clinics and group 2 health clinics. Half of the
hospitals and health clinics, which had the higher prescription
load in 2018 (median), were grouped under the group 1 hospitals
and health clinics, while the lower were grouped as group
2 respectively.
Statistical Analysis
The statistical analysis was performed using the SPSS for Windows
version 21.0 (IBM, New York). All the categorical variables
were summarized as frequencies and percentages, and numerical variables as means and Standard Deviations (SDs), or as medians
and Interquartile Ranges (IQRs), as appropriate. The association
between the PVAS uptake and the failure to achieve the
KPI set for the pharmacy waiting time, along with the roles of
other institution related factors, was further explored by using
the simple and multiple logistic regression (backward stepwise
method) analyses. The results were presented as odds ratios
(ORs), along with their corresponding 95% confidence intervals
(CIs) and p-values. The final model was also tested for multicollinearity
and interactions, while its fitness was confirmed
through the Hosmer-Lemes how goodness of fit test, the overall
correctly classified percentage and the area under the receiver
operating characteristic curve. The significant level of the statistical
test was set at 5%.
Results
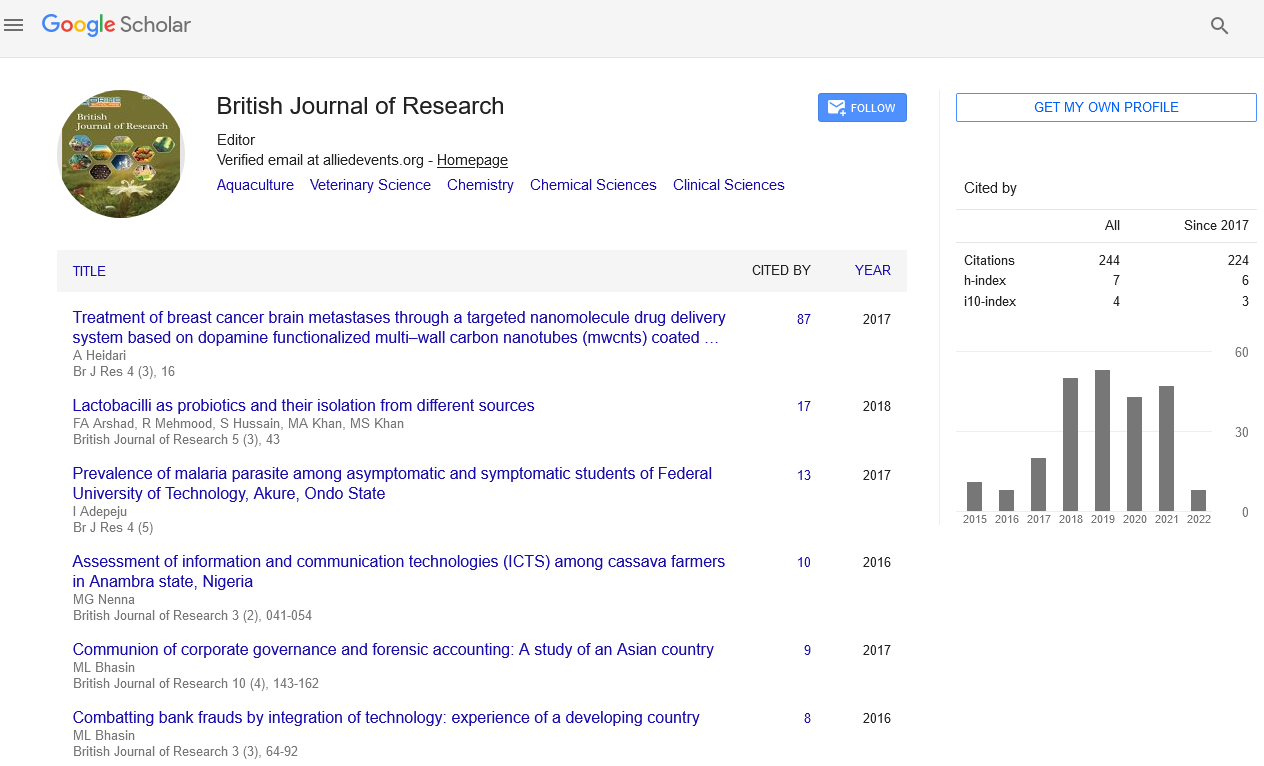
A total of 790 public health institutions in Malaysia, including 142 hospitals and 648 health clinics, were found to have provided at least one type of PVAS in 2018. They were widely distributed across different regions of the country (98 in the Northern Peninsula, 190 in the Central Peninsula, 187 in the Southern Peninsula, 189 in the East Coast, and 126 in East Malaysia). Over the one year period, all the public health institutions had received a total of 55,407,903 prescriptions. Hospitals contributed to nearly 40% of the overall prescription load, more than 80% of which fell on the group 1 hospitals. Similarly, the prescriptions from the group 1 health clinics composed approximately 80% of the overall prescription load of health clinics. The proportion of refill prescriptions ranged from 23.8% to 33.2% across different settings. (Figure 1).

Figure 1: Distribution of presription load and the utilization of PVAS across settings.
On average, the health institution was staffed with four pharmacists and pharmacy assistants, and had two dispensing counters. More than 90% of them provided the appointment and pickup services, and slightly more than 80% implemented the IDDS. Apart from the 4 major types of the PVAS, more than one third of them also provided alternative services, such as the medication locker and home medication review services. Most group 1 hospitals provided at least three types of PVAS, while other settings mainly provided only one or two types of services (Table 1).
Table 1: Capacity, availability of PVAS and waiting time of outpatient pharmacy departments at four major groups of public health institutions across Malaysia, 2018. IQR, interquartile range; IDDS, Integrated Drug Dispensing System; KPI, key performance indicator; PVAS, pharmacy value-added service; SD, standard deviation. Including pharmacists and pharmacy assistants.
| Variables |
Overall (n=790) |
Hospitals |
Health clinics |
| |
|
Group 1 (n=71) |
Group 2 (n=71) |
Group 1 (n=324) |
Group 2 (n=324) |
| Number of pharmacy staff a, median (IQR) |
4.00 (5.00) |
14.00 (13.00) |
5.00 (3.00) |
6.00 (4.00) |
3.00 (2.00) |
| Number of dispensing counters, median (IQR) |
2.00 (1.00) |
4.00 (2.00) |
2.00 (1.00) |
2.00 (1.00) |
1.00 (0.00) |
| Types of PVAS offered, n (%) |
| IDDS |
639 (80.9) |
71 (100.0) |
70 (98.6) |
301 (92.9) |
197 (60.8) |
| Appointment-and-pickup services |
729 (92.3) |
70 (98.6) |
65 (91.5) |
306 (94.4) |
288 (88.9) |
| Drive-through services |
57 (7.2) |
24 (33.8) |
2 (2.8) |
29 (9.0) |
2 (0.6) |
| Medication delivery by post services |
162 (20.5) |
53 (74.6) |
12 (16.9) |
89 (27.5) |
8 (2.5) |
| Miscellaneous |
298 (37.8) |
59 (83.1) |
29 (40.8) |
168 (51.9) |
42 (13.0) |
| Number of PVAS types offered, n (%) |
| 1 |
169 (21.4) |
0 (0.0) |
3 (4.03) |
21 (6.5) |
145 (44.8) |
| 2 |
322 (40.8) |
6 (8.5) |
40 (56.3) |
128 (39.5) |
148 (45.7) |
| 3 |
169 (21.4) |
21 (29.6) |
18 (25.4) |
102 (31.5) |
28 (8.6) |
| 4 |
90 (11.4) |
22 (31.0) |
9 (12.7) |
56 (17.3) |
3 (0.9) |
| 5 |
35 (4.4) |
18 (25.4) |
1 (1.4) |
16 (4.9) |
0 (0.0) |
| 6 |
5 (0.6) |
4 (5.6) |
0 (0.0) |
1 (0.3) |
0 (0.0) |
| Waiting time for medication collection, minutes, mean (SD) |
10.95 (5.63) |
15.85 (4.58) |
12.81 (4.53) |
13.43 (5.19) |
6.99 (3.69) |
| Meeting the standard of the KPI for waiting time, n (%) |
635 (80.4) |
51 (71.8) |
62 (87.3) |
208 (64.2) |
314 (96.9) |
The overall PVAS uptake was 17.1%. The group 1 hospitals recorded the highest PVAS uptake (29.1%), followed by the group 2 hospitals (17.5%) and the group 1 health clinics (10.9%) (Figure 1) The most widely used PVAS type was the appointment and pickup services, followed by the IDDS and the drive through services. Such a trend cut across different settings, except for the group 1 hospitals, in which the IDDS were the most frequently used services (Figure 2).

Figure 2: Figure explains the percentage of hospitals that are having pharmacy value added services in malaysia.
The health institutions recorded an average pharmacy waiting time of 10.95 minutes for medication collection, and 80.4% of them met the standard set for the KPI (Table 1). As compared with the group 2 health clinics, the group 1 hospitals (adjusted OR: 4.25; 95% CI: 1.51, 11.98) and the group 1 health clinics (adjusted OR: 10.90; 95% CI: 5.26, 22.56) were shown to have a higher tendency of not achieving the KPI goal. A higher PVAS uptake increased the likelihood of hitting the target (adjusted OR: 0.91; 95% CI: 0.84, 0.98). However, offering more types of services resulted in an opposite outcome (adjusted OR: 1.48; 95% CI: 1.15, 1.89) (Table 2). In comparison with the health institutions located in the Northern Peninsula, those located in East Malaysia (adjusted OR: 2.64; 95% CI: 1.33, 5.22) were more likely to fail in meeting the standard of the KPI. In contrast, health institutions in the East Coast had a lower risk of not achieving the KPI goal (adjusted OR: 0.39; 95% CI: 0.18, 0.84).
Table 2: Factors associated with the failure to achieve the standard set for the key performance indicator of the pharmacy waiting time, logistic regression analysis. b, regression coefficient; OR, odds ratio; CI, confidence interval. Multicollinearity and interaction term were checked and not found. Hosmer-Lemeshow test (p=0.201), classification table (overall correctly classified percentage=80.8%) and area under curve (82.4%) were applied to check the model fitness. b Health institutions were grouped according to their locations (states) into Northern Peninsula (Perlis, Kedah, Penang), Central Peninsula (Perak, Selangor and Kuala Lumpur), Southern Peninsula (Negeri Sembilan, Melaka and Johor), East Coast (Kelantan, Terengganu and Pahang), and East Malaysia (Sabah, Sarawak and Labuan).
| Variables |
Simple logistic regression |
Multiple logistic regression a |
| b |
OR (95% CI) |
p |
b |
OR (95% CI) |
p |
| Setting |
| Group 1 hospital |
2.51 |
12.31 (5.45, 27.81) |
<0.001 |
1.45 |
4.25 (1.51, 11.98) |
0.006 |
| Group 2 hospital |
1.52 |
4.56 (1.78, 11.68) |
0.002 |
0.9 |
2.45 (0.89, 6.75) |
0.084 |
| Group 1 health clinic |
2.86 |
17.51 (8.97, 34.20) |
<0.001 |
2.39 |
10.90 (5.26, 22.56) |
<0.001 |
| Group 2 health clinic |
0 |
1 |
- |
0 |
1 |
- |
| Number of PVAS types offered |
0.08 |
1.76 (1.51, 2.01) |
<0.001 |
0.39 |
1.48 (1.15, 1.89) |
0.002 |
| Percentage of refill prescriptions dispensed using PVAS |
-1.4 |
0.99 (0.94, 1.04) |
0.659 |
-0.1 |
0.91 (0.84, 0.98) |
0.012 |
| Locationb |
| Northern Peninsula |
0 |
1 |
|
0 |
1 |
|
| Central Peninsula |
-0.1 |
0.88 (0.50, 1.55) |
0.658 |
-0.1 |
0.88 (0.47, 1.64) |
0.685 |
| Southern Peninsula |
-0.5 |
0.58 (0.32, 1.05) |
0.073 |
-0.3 |
0.73 (0.38, 1.43) |
0.363 |
| East Coast |
-1.5 |
0.23 (0.12, 0.48) |
<0.001 |
-0.9 |
0.39 (0.18, 0.84) |
0.016 |
| East Malaysia |
0.34 |
1.41 (0.78, 2.54) |
0.253 |
0.97 |
2.64 (1.33, 5.22) |
0.005 |
Discussion
This study clearly indicates that the PVAS, a set of novel pharmacy
services introduced by the MOH in Malaysia, are getting
increasingly well accepted among the patients. The number of
prescription dispensed by the PVAS was shown to have reached
a historic high at 2,860,586 (17.1%) in 2018, higher than that reported
in 2014 (14%) [13]. To the best of our knowledge, this is
the first situational analysis of the PVAS on a nationwide scale.
Aside from the utilization of the PVAS, the findings also provide
insight into how the services could affect the waiting time,
which has been an important quality indicator of the pharmacy
services as a whole.
The appointment and pickup services emerged as the most
widely available and frequently used services. Such findings imply
that this particular type of PVAS has been highly feasible and
sustainable in resource limited settings. It is arguably the least
cost-consuming PVAS type and easy to set up, as it only requires
a telephone or any other communication devices, which enable
patients to make an appointment and collect their refills upon
their arrival. It has also been generally well accepted by patients
due to its potential to significantly reduce the waiting time, as
demonstrated by Othman et al. The relatively high uptake of the
appointment and pickup services also suggests that patients
still highly value the opportunities to meet with the pharmacy
staff and receive advices on medications in person, as much as
they desire not to wait long in front of the pharmacy counters.
Instead of the appointment and pickup services, the IDDS was
shown to be the most widely used PVAS type in the group 1 hospitals.
Such findings would be expected as most group 1 hospitals
typically serve as referral centers for a wide range of specialties,
and are not necessarily the most preferred settings for
patients to pick up their refills. Additionally, the group 1 hospitals
were also found to have an exceptionally high prescription
load, approximately five times higher than that of their group 2
counterparts. This also explains why group 1 hospitals recorded
the longest pharmacy waiting time among all the settings.
Therefore, it is conceivable that the group 1 hospitals would
highly recommend the uptake of the IDDS to patients. Patients
are also likely to opt for the IDDS, simply because they do not
need to regularly return to high volume hospitals. By addressing
all these limitations, the IDDS allows patients to pick up their refills
from settings, which are less congested and nearer to their
residence or workplace.
However, the drive through and medication delivery by post
services, which were initially designed to address the car parking
problems in health institutions, were not widely used as
they would be expected. The drive-through services have the
potential to ease the congestion at the pharmacy counters and
benefit the vulnerable populations. However, the feasibility of
such services is primarily limited by the need for extra costs
and space to build the facilities, as well as additional manpower
to run the service. Therefore, the drive-through services are not currently made available for medication collection in many
health institutions. On the other hand, the relatively low uptake
of the medication delivery by post services is likely attributable
to the postal fees, which could be deemed as a burden, particularly
by patients of a lower socioeconomic status. It is also likely
that patients are not well informed about the services, mainly
due to inadequate promotion from providers. Additionally, the
existing post services in Malaysia also do not allow the delivery
of psychotropic photo and heat sensitive medications, and are
not available in some remote areas due to limited postage coverage
by the logistic partner courier company. Despite their limitations,
this study also shows that increasing the PVAS uptake
had increased the achievement of the KPI set for the waiting
time. A similar finding was reported by Loh, et al. where the
report concluded that the patient waiting time in the ambulatory
pharmacy is improved as the VAS registration increased.
Nevertheless, such findings should not be mistaken for a reason
to vary the services in a health institution, as the logistic
regression model also indicates that adding new types of PVAS
to what are already available could, conversely, lengthen the
waiting time.
Although it is understandable that some health institutions
have been taking the initiative to diversify their services to meet
the need of different populations, the findings of this study suggest
that they should be more strategic in the selection of services
to provide, particularly by taking their own capacity into
the consideration without compromising the KPI achievement.
This is reasonable, as in resource limited public hospitals and
health clinics, initiating a new service are likely to augmented
the manpower shortage and consequently affect the operation
of the conventional pharmacy counter services. Thus, instead of
introducing new types of PVAS, emphasis should be placed on
optimizing the uptake of existing PVAS in the future. In our record,
at least one third of the health institutions were found to
have offered unique and unclassifiable PVAS other than those
highly recommended by the MOH, however further investigation
into the effectiveness of such a strategy is thus required.
Even though the standard set for the KPI was fulfilled by slightly
more than 80% of the health institutions, it is noteworthy
that approximately 30% of the group 1 hospitals and 35% of
the group 1 health clinics still did not achieve the targeted waiting
time for medication collection. As compared with the group
2 health clinics, the group 1 health clinics even demonstrated
approximately 11 times higher odds of not achieving the KPI
set for the pharmacy waiting time. Given that approximately
7 in 10 prescriptions were still dispensed through the conventional
counter services in the high volume health institutions
in Malaysia, efforts to upscale the promotion of the PVAS use
are necessary [11]. At the same time, the reasons for geographical
differences in the waiting time for medication collection
remain questionable, calling for further research in this area.
The strength of this study lies in the representativeness of its
findings, as the data was obtained directly from the PSP, which has long been centrally monitoring the implementation of the
services across the country. As positive as the findings of this
study sound, the roles of many factors which could also have
an impact on the achievement of the KPI, such as the resources
put into the services, the efficiency of individual health institutions,
the medication inventory management and the extent to
which the electronic hospital information system was used to
facilitate the medication dispensing, were not comprehensively
explored. Furthermore, it was assumed that all the data used in
this study was collected and reported according to the guidelines
set by the PSP by individual health institutions.
Conclusion
After a constant initiative for patient centered services for
years, it is encouraging to note the uptake of the PVAS for
medication collection, which were launched by the MOH more
than a decade ago, had reached 17.1% in 2018 and 22.3% in
2019. Increasing the PVAS uptake was shown to have led to
a better achievement of the KPI set for the waiting time in a
public health institution. Hence, continuous efforts to scale up
the use of PVAS, especially in a busy hospitals and health clinics
throughout the country, are warranted. Going forward, besides
the waiting time, the potential roles of the PVAS in reducing the
medication wastage and improving the patient compliance and
satisfaction, as well as their economic implications, could also
be explored.
Acknowledgement
None.
Conflict Of Interest
The author’s declared that they have no conflict of interest.
References
- Martinez DA, Zhang H, Bastias M (2019) Prolonged wait time is associated with increased mortality for Chilean waiting list patients with non-prioritized conditions. BMC Public Health 19(1): 233.
[Crossref] [Google Scholar] [PubMed]
- Reichert A, Jacobs R (2018) The impact of waiting time on patient outcomes: Evidence from early intervention in psychosis services in England. Health Eco 27(11): 1772-1787.
[Crossref] [Google Scholar] [PubMed]
- Aboumatar HJ, Winner LE, Davis RO (2008) No time to waste: Decreasing patient wait times for chemotherapy administration using automated prioritization in an oncology pharmacy system. Am J Manag Care 14(5): 309-316.
[Google Scholar] [PubMed]
- Meena Kumari M, Somu K, Amberkar M, Nandit PB (2012) Patients’ response to waiting time in an out-patient pharmacy at a tertiary care hospital. J Appl Pharm Sci. 2(10):090-093.
[Crossref] [Google Scholar] [Researchgate]
- Dalton K, Byrne S (2017) Role of the pharmacist in reducing healthcare costs: Current insights. Integr Pharm Res Pract 6: 37-46.
[Crossref] [Google Scholar] [PubMed]
- Jin H, Kim Y, Rhie S (2016) Factors affecting medication adherence in elderly people. Patient Prefer Adherence 10: 2117-2125.
[Crossref] [Google Scholar] [PubMed]
- Collecting Your Medications (2020) Singapore General Hospital.
- Lau BT, Nurul NAAR, Ng SY, Wong SN (2018) Satisfaction of patients receiving value added-services compared to traditional counter service for prescription refills in Malaysia. Pharm Pract 16(1): 1075.
[Crossref] [Google Scholar] [PubMed]
- Alodan A, Alalshaikh G, Alqasabi H, Alomran S, Abdelhadi A, et al. (2020) Studying the efficiency of waiting time in outpatient pharmacy. MethodsX 7: 100913.
[Crossref] [Google Scholar] [PubMed]
- Tan CLH, Gan VBY (2016) Pharmacy value added services: Early begininings, current implementation, and challenges from the Malaysian experience. Indian J Pharm Educ Res 50(3): 335-343.
[Crossref] [Google Scholar]
- Afolabi MO, Erhun WO (2005) Patients response to waiting time in an out-patient pharmacy in Nigeria. Trop J Pharm Res 2(2): 207-214.
[Crossref] [Google Scholar]
- LAPORAN STATISTIK PROGRAM FARMASI (2016).
- Chan H-K, Shahabudin NA, Ghani NA, Hassali MA (2015) Satisfaction with traditional counter versus value-added services for prescription claims in a Malaysian Tertiary Hospital. J Pharm Heal Serv Res 6(1): 61-68.
[Crossref] [Google Scholar]
- Tan CLH, Hassali MA, Saleem F, Shafie AA, Aljadhay H, et al. (2016) Building intentions with the theory of planned behaviour: A qualitative assessment of salient beliefs about pharmacy value added services in Malaysia. Heal Expect. 19(6): 1215-1225.
[Crossref] [Google Scholar] [PubMed]
- Abu Farha R, Abu Hammour K, Alefishat E, Alsaeed H, Almaaiah S (2017) Drive-thru pharmacy service: Assessments of awareness, perception and barriers among pharmacists in Jordan. Saudi Pharm J 25(8): 1231-1236.
[Crossref] [Google Scholar] [PubMed]
- Loh BC, Wah KF, Teo CA, Khairuddin NM, Fairuz FB, et al. (2017) Impact of value added services on patient waiting time at the ambulatory pharmacy Queen Elizabeth Hospital. Pharm Pract (Granada) 15(1): 846.
[Crossref] [Google Scholar] [PubMed]
Citation: Taridi MM, Abu Hassan MR, Mohamad R, Keat CH, Lim CP, et al (2022) Utilization of Pharmacy Value-Added Services and
its Association with Waiting Time for Medication Collection in Public Health Institutions across Malaysia. Br J Res. 9:116.
Copyright: © 2022 Nordin N. This is an open-access article distributed under the terms of the Creative Commons Attribution
License, which permits unrestricted use, distribution, and reproduction in any medium, provided the original author and source
are credited.