Research Article - (2026) Volume 12, Issue 4
The Role of Human Tumor Necrosis Factor-α (TNF-α) in Predicting Diabetic Nephropathy in Type Ⅱ Diabetic Patients
Khalid Ibrahem Husein Al Ghodran1*,
Amina Ali Dessouki2,
Heba MA Abdelrazek3,
Dahlia Ibrahim Badran4 and
Emad M Gad5
1Department of Chemistry, Suez Canal University, Ismailia, Egypt
2Department of Pathology, Suez Canal University, Ismailia, Egypt
3Department of Physiology, Suez Canal University, Ismailia, Egypt
4Department of Medical Biochemistry and Molecular Biology, Suez Canal University, Ismailia, Egypt
5Department of Organic Chemistry, Suez Canal University, Ismailia, Egypt
*Correspondence:
Khalid Ibrahem Husein Al Ghodran, Department of Chemistry, Suez Canal University, Ismailia,
Egypt,
Email:
Received: 18-Nov-2024, Manuscript No. IPBMBJ-24-21997;
Editor assigned: 21-Feb-2024, Pre QC No. IPBMBJ-24-21997 (PQ);
Reviewed: 06-Dec-2024, QC No. IPBMBJ-24-21997;
Revised: 10-Aug-2026, Manuscript No. IPBMBJ-24-21997 (R);
Published:
17-Aug-2026, DOI: 10.35248/2471-8084.12.1.003
Abstract
Background: Diabetic nephropathy is a chronic main microvascular consequence of untreated hyperglycemia, affects a significant portion of the population. It's thought to be the main factor causing end-stage kidney disease. Proinflammatory cytokine TNF-α is involved in the development and course of disease in diabetic nephropathy.
Aim: This study aimed at the detection the validity of using tumor necrosis factor-alpha as earlier and reliable biomarker for diabetic nephropathy.
Materials and methods: This study included 125 Egyptian subjects attending the out patients clinic of the Department of Internal Medicine, 10th of Ramadan City Health Insurance Hospital and divided as follow Group A: Control group which included 20 healthy subjects. Study groups: Included 105 patients divided into three sub-groups: group B: 20 patients with diabetic mellitus, group C: 65 patient’s diabetic nephropathy, group D: 20 diabetic nephropathy and other complications.
Results: Our study showed that the tumor necrosis factor-alpha was increased significantly in group B, C and D compared with control group, the high mean values were recorded in group D (713.7 ± 18.5) followed by group C (524.1 ± 56.4) and group B (281.0 ± 76.6) while the control group had the lowest value. At cut-off level ≥ 83.5, tumor necrosis factor-alpha had 96.7% sensitivity and 79.7% specificity for diagnosing diabetic nephropathy.
Conclusion: The study found that patients with DM and DM-CKD had considerably higher serum levels of TNF-α. This suggests that TNF-α may have a function in mediating changes in DN and may contribute to the progression of DM to DN.
Keywords
Tumor necrosis factor-alpha; Diabetic Nephropathy; T2DM; DM-CKD
Introduction
Diabetes Mellitus Type 2 (T2DM) is a chronic illness that is quite common. All microvascular and macrovascular problems in individuals with type 2 diabetes (T2DM), including Diabetic Nephropathy (DN), which may manifest later in the disease, are primarily caused by prolonged hyperglycemia [1].
Diabetes Mellitus (DM) patients with DN, the most prevalent chronic microvascular consequence, have significantly reduced quality of life. The development of DN is aided by dedifferentiation, cell hypertrophy, and inflammation. Numerous variables, such as oxidative stress, elevated glucose, altered hemodynamic, and inflammatory processes, are linked to the development of Diabetic Ketoacidosis (DKA). While data shows increased macrophage infiltration and overproduction of leukocyte adhesion molecules in kidneys, DN has always been regarded as a nonimmune illness [2].
Tumor Necrosis Factor Alpha (TNF-α) is a cytokine that initiates the acute-phase response and is a cell signaling molecule associated with systemic inflammation. TNF-α is primarily involved in immune cell modulation [3]. Monocytes and macrophages are the main source of TNF-α synthesis, while intrinsic resident renal cells can also produce this cytokine. Some cell surface receptors mediate the effects of TNF-α. A variety of transcription factors, cytokines, growth factors, receptors, cell adhesion molecules, mediators of inflammatory processes, and acute-phase proteins are expressed when TNF-α binds to its receptors. It may also mediate necrotic and apoptotic cell death [4]. As a result, TNF-α speeds up the production and release of inflammatory cytokines and may contribute to the development of DN. Therefore, the purpose of this work is to investigate the function of TNF-α serum level in type 2 DN.
Aim of the Work
The present study aimed at the detection the validity of using Tumor Necrosis Factor-Alpha as earlier and reliable biomarkers for diabetic nephropathy.
Materials and Methods
Study Design
Cross sectional study design was used.
Study Setting
The study was conducted at the outpatient clinic of the Dept. of Internal Medicine, 10th of Ramadan City Health Insurance Hospital.
Target Population
Diabetic patients attending the outpatient clinic of the Dept. of Internal Medicine, 10th of Ramadan City Health Insurance Hospital. The study including 125 persons whose were attending them were enrolled in the study and divided in to two group:
Control group: 20 healthy subjects were taken as control group.
Study group: Including 105 patients divided in to three group.
- Group I: 20 with diabetes mellitus.
- Group II: 65 with Diabetic nephropathy.
- Group III: 20 with diabetic nephropathy and other complication.
Inclusion Criteria
- Age ranged between 30 -50 years old.
- Both genders.
Exclusion Criteria
- Patients with T1DM
- Pregnancy
- Patients with congestive hard failure.
- Patients with systemic lupus erythematous.
- Patients with polycystic kidney disease.
Methods
- The study and control group were subjected to collection of demographic data as required in the attached sheet including age, occupation, anthropometric measurements of height, weight, waist circumference, and history of disease.
- Collection of early morning urine samples in vacutainer cups and about 5 ml of venous blood sample from overnight fasted subjects were collected on plain tubes and 5 ml blood were collected on EDTA tubes by vacutainer system under complete aseptic conditions and Glycosylated hemoglobin (HbA1C) first done and samples centrifuged for 10 min at 2.500 g within 30 min, separated serum and plasma were stored at 20 degree to be used in the following testes: Serum creatinine, serum total cholesterol, HDL, LDL and triglycerides, ALT, AST, albumin, total protein, gloubulin, total bilirubin.
- Plasma concentration of tumor necrosis factor-alpha was examined be using an Enzyme-Linked Immunosorbent Assay (ELISA kit).
- Spot urine sample from each patient for: Urinary albumin/ creatinine ratio was measured.
The collected data was revised, coded, tabulated and introduced to a PC using Statistical Package for Social Science (SPSS 26). Data was presented and suitable analysis was done according to the type of data obtained for each parameter. The following tests were used:
Descriptive Statistics
- A normality test (Shapiro-Wilk) was done to check the normal distribution of the samples.
- Mean Standard Deviation (± SD) and range for parametric numerical data.
- Frequency and percentage of non-numerical data (gender).
Statistical Analysis
ANOVA test of significance was used when comparing between means of more than two groups (the three studied groups and the control).
Post-hoc test after ANOVA for significance between each two groups.
Chi-square test was used to examine the relationship between two qualitative variables (gender).
Correlation analysis (using Pearson's method) to assess the strength of association between two quantitative variables. The correlation coefficient denoted symbolically "r" defines the strength (magnitude) and direction (positive or negative) of the linear relationship between two variables.
- r= 0-0.19 is regarded as very weak correlation.
- r=0.2-0.39 as weak correlation.
- r=0.40-0.59 as moderate correlation.
- r=0.6-0.79 as strong correlation.
- r=0.8-1 as very strong correlation.
ROC curve for prediction of independent value effect on the outcome: P-value: level of significance; P>0.05: Non- Significant (NS); P<0.05: Significant (S).
Results
This study included 125 Egyptian subjects attending the out Patients Clinic of the Department of Internal Medicine, 10th of Ramadan city Health Insurance Hospital and divided as follow
- Group A: Control group which included 20 healthy subjects
- Study groups: Included 105 patients divided into three subgroups:
- Group B: 20 patients with diabetic mellitus.
- Group C: 65 patient’s Diabetic nephropathy.
- Group D: 20 Diabetic nephropathy and other complications.
A total of 125 subjects were enrolled in this study; the mean age was ranged from 30 to 46 years with mean 36.2 for group A, from 31 to 49 years with mean 41.7 for group B, from 39 to 50 years with mean 47.5 for group C and from 42 to 50 years with mean 46.9 for group D there were 71 men and 54 women. BMI, Duration of DM, FBG, HBAIC, ACR, cholesterol, triglycerides, LDL, AST and ALT were significantly higher in diabetic patients than non-diabetic control. Meanwhile, GFR and HDL were significantly lower in diabetic patients than in non-diabetic controls. Other parameters did not differ significantly between the diabetes group and non-diabetic controls (Table 1). Tumor necrosis factor-alpha was significantly higher in diabetic patients (p<0.001) (Figure 1).
| |
Control group (A) |
Diabetic group (B) |
Group C and D |
F-test |
P-value |
| Years |
36.2 ± 4.5 |
41.7 ± 5.2 |
47.4 ± 2.7 |
91.88 |
<0.001**a |
| Gender |
| Male |
12 (60%) |
12 (60%) |
47 (55.3) |
2.46 |
0.88b ns |
| Female |
8 (40%) |
8 (40%) |
38 (44.7) |
|
|
| BMI |
27.3 ± 2.2 |
28.7 ± 2.6 |
29.7 ± 3.0 |
5.9 |
0.009**a |
| Duration |
- |
4.95 ± 2.4 |
8.89 ± 2.81 |
|
<0.001**a |
| FBG |
88.5 ± 9.0 |
167.6 ± 31.8 |
158.0 ± 23.3 |
80 |
<0.001**a |
| HBAIC |
4.9 ± 0.3 |
9.6 ± 2.0 |
9.1 ± 0.9 |
126.7 |
<0.001**a |
| CR |
0.8 ± 0.1 |
1.0 ± 0.1 |
4.5 ± 2.5 |
40.5 |
<0.001**a |
| ACR |
10.9 ± 1.9 |
21.6 ± 3.4 |
970.7 ± 57.9 |
4.7 |
<0.001**a |
| GFR |
129.0 ± 27.0 |
110.5 ± 8.8 |
18.5 ± 10.2 |
713.3 |
<0.001**a |
| CHOL |
169.2 ± 13.4 |
170.9 ± 12.1 |
194.6 ± 33.0 |
10.3 |
<0.001**a |
| TG |
127.0 ± 8.9 |
156.2 ± 15.9 |
157.1 ± 29.9 |
11.2 |
<0.001**a |
| HDL |
47.8 ± 2.6 |
40.8 ± 3.3 |
42.8 ± 6.5 |
8.6 |
<0.001**a |
| LDL |
96.9 ± 13.1 |
99.2 ± 11.8 |
122.3 ± 33.6 |
9.8 |
<0.001**a |
| AST |
26.9 ± 3.7 |
37.2 ± 7.7 |
43.6 ± 14.6 |
15.1 |
<0.001**a |
| ALT |
26.9 ± 2.6 |
36.9 ± 6.9 |
44.6 ± 16.9 |
13.3 |
<0.001**a |
| ALB |
4.0 ± 0.2 |
4.0 ± 0.2 |
3.7 ± 0.3 |
20.7 |
<0.001**a |
| TP |
7.0 ± 0.2 |
7.0 ± 0.2 |
6.7 ± 0.4 |
15.6 |
<0.001**a |
| GLB |
3.0 ± 0.2 |
3.0 ± 0.2 |
2.9 ± 0.3 |
1 |
<0.001**a |
| A/G ratio |
1.8 ± 0.2 |
1.4 ± 0.1 |
1.3 ± 0.2 |
74.1 |
<0.001**a |
| Human Tumor Necrosis Factor-α (TNF-α) |
94.5 ± 35.4 |
281.0 ± 76.6 |
568.7 ± 68.4 |
107.2 |
<0.001**a |
Note: **means significant differences between groups at p<0.05
aANOVA test at P<0.05
bChi-square test at P<0.05 |
Table 1: Baseline characteristics among control, diabetics and diabetics with nephropathy groups.
BMI, duration of DM, FBG, HBAIC, ACR, cholesterol, triglycerides, LDL, AST and ALT were significantly highest in diabetic nephropathy patients with complications. TNF-was significantly higher in diabetic patients with the highest mean among diabetic nephropathy patients with complications (p<0.001) (Table 2).
| Comparison between groups |
| |
Control group |
Diabetic group |
Diabetic nephropathy group (c) |
Diabetic nephropathy with complications (D) |
F-test |
P-value |
| Age |
36.2 ± 4.53 |
41.7 ± 5.2 |
47.53 ± 2.7 |
46.95 ± 2.8 |
61.12 |
<0.001**a |
| Gender |
| Male |
12 (60%) |
12 (60%) |
34 (52.3%) |
12 (60%) |
0.749 |
0.86ns |
| Female |
8 (40%) |
8 (40%) |
31 (47.7%) |
8 (40%) |
|
|
| BMI |
27.3 ± 2.2 |
28.7 ± 2.6 |
29.6 ± 2.9 |
30.1 ± 3.2 |
3 |
0.008** |
| Duration |
- |
4.95 ± 2.4 |
8.81 ± 2.87 |
9.15 ± 2.68 |
71.41 |
<0.001**a |
| FBG |
88.5 ± 9.0 |
167.6 ± 31.8 |
151.7 ± 170 |
178.5 ± 29.0 |
83.92 |
<0.001**a |
| HBAIC |
4.9 ± 0.3 |
9.6 ± 2.0 |
9.1 ± 1.0 |
9.2 ± 0.7 |
37.9 |
<0.001**a |
| CR |
0.8 ± 0.1 |
1.0 ± 0.1 |
4.0 ± 2.4 |
6.2 ± 2.0 |
27.39 |
<0.001**a |
| ACR |
10.9 ± 1.9 |
21.6 ± 3.4 |
324.1 ± 28.3 |
3071.9 ± 24.1 |
508.15 |
<0.001**a |
| GFR |
129.0 ± 27.0 |
110.5 ± 8.8 |
20.9 ± 10.3 |
10.6 ± 4.5 |
57.87 |
<0.001**a |
| CHOL |
169.2 ± 13.4 |
170.9 ± 12.1 |
181.0 ± 20.5 |
238.8 ± 27.2 |
35.94 |
<0.001**a |
| TG |
127.0 ± 8.9 |
156.2 ± 15.9 |
146.6 ± 16.1 |
191.3 ± 38.5 |
23.18 |
<0.001**a |
| HDL |
47.8 ± 2.6 |
40.8 ± 3.3 |
44.8 ± 5.9 |
36.4 ± 3.5 |
75.96 |
<0.001**a |
| LDL |
96.9 ± 13.1 |
99.2 ± 11.8 |
107.6 ± 19.8 |
170.3 ± 22.5 |
86.57 |
<0.001**a |
| AST |
26.9 ± 3.7 |
37.2 ± 7.7 |
37.2 ± 6.8 |
64.7 ± 13.1 |
123.55 |
<0.001**a |
| ALT |
26.9 ± 2.6 |
36.9 ± 6.9 |
36.7 ± 5.9 |
70.5 ± 14.9 |
27.61 |
<0.001**a |
| ALB |
4.0 ± 0.2 |
4.0 ± 0.2 |
3.8 ± 0.2 |
3.5 ± 0.2 |
40.7 |
<0.001**a |
| TP |
7.0 ± 0.2 |
7.0 ± 0.2 |
6.8 ± 0.3 |
6.2 ± 0.3 |
11.37 |
<0.001**a |
| GLB |
3.0 ± 0.2 |
3.0 ± 0.2 |
3.0 ± 0.2 |
2.7 ± 0.3 |
49.64 |
<0.001**a |
| A/G ratio |
1.8 ± 0.2 |
1.4 ± 0.1 |
1.3 ± 0.1 |
1.3 ± 0.2 |
71.14 |
<0.001**a |
| Human Tumor Necrosis Factor-α (TNF-α) |
94.5 ± 35.4 |
281.0 ± 76.6 |
524.1 ± 56.4 |
713.7 ± 18.5 |
99.3 |
<0.001**a |
Note: **means significant differences between groups at p<0.05, ns:no significant
aANOVA test at P<0.05
bChi-square test at P<0.05 |
Table 2: The comparison between the studied groups with control groups for different parameters.
In Table 3, Human Tumor Necrosis Factor-α (TNF-α) was positive and significantly correlated with BMI, duration of DM, FBG, HBAIC, CR, GFR, CHOL, HDL, LDL, AST, A/G ratio, BRONECTINFI, fibronectin. Meanwhile, tumor necrosis factor-alpha was negatively correlated with ACR, TG, ALT, ALB, TP and GLB.
| Human Tumor Necrosis Factor-α (TNF-α) |
| Parameters |
R |
P value |
| BMI |
0.205 |
0.035* |
| Duration |
0.552 |
<0.001** |
| FBG |
0.515 |
<0.001** |
| HBAIC |
0.527 |
<0.001** |
| CR |
0.427 |
<0.001** |
| ACR |
-0.744 |
<0.001** |
| GFR |
0.504 |
<0.001** |
| CHOL |
0.425 |
<0.001** |
| TG |
-0.284 |
<0.001** |
| HDL |
0.504 |
<0.001** |
| LDL |
0.519 |
<0.001** |
| AST |
0.536 |
<0.001** |
| ALT |
-0.47 |
<0.001** |
| ALB |
-0.446 |
<0.001** |
| TP |
-0.224 |
0.012* |
| GLB |
-0.498 |
<0.001** |
| A/G ratio |
0.662 |
<0.001** |
Table 3: Correlations between the TNF-α and other parameters in patients with diabetes.
The results in Table 4, showed that at cut-off level ≥ 83.5, tumor necrosis factor-alpha had 96.7% sensitivity and 79.7% specificity for diagnosing diabetic nephropathy (Figure 1).
|
|
AUC
|
Sensitivity
|
Specificity
|
Cut-off value
|
|
TNF-α
|
0.626
|
96.70%
|
79.70%
|
83.5
|
Table 4: Validity of the TNF-α for diabetic nephropathy.
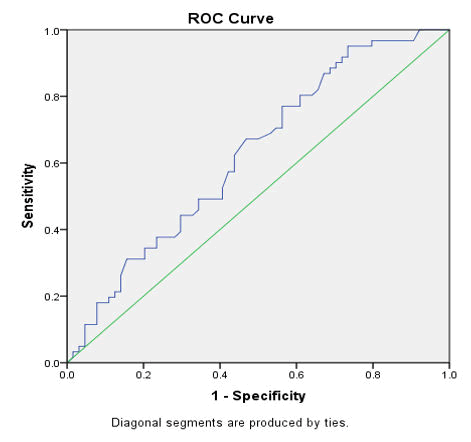
Figure 1: ROC curve of TNF-α for diabetic nephropathy.
Discussion
One frequent diabetic microvascular consequence that might progress to end-stage renal disease is Diabetic Nephropathy (DN). Pro-inflammatory cytokine TNF-α is involved in the development and course of disease in DN [5]. With no discernible difference between DM and DM-CKD, the
BMIs of both patient groups were significantly higher than those of the control group. These findings corroborated those of Doghish et al. [6], who found no difference in BMI between DM-CKD and non-DM patients. But according to Gupta et al. [7], there was no discernible change in BMI between the DM and DM-CKD groups when compared to the control group. According to Maric-Bilkan [8], interactions between a number of variables stimulate intracellular signalling, which in turn causes the generation of cytokines and growth factors and ultimately results in renal illness. These beginning processes are similar for renal disorders associated with diabetes and obesity.
It was discovered that DM-CKD had a longer history of diabetes than DM. This was in line with the findings of Mahfouz et al. [9], who discovered a substantial difference in the length of diabetes between DM and DM-CKD. On the other hand, Ochodnicky et al. and Motawi et al. found no discernible variation in the length of diabetes between DM and DM-CKD.
Gallagher and Suckling provided an explanation of the relationship between DN and the length of diabetes by stating that chronic exposure to hyperglycemia damages kidney structures either directly or indirectly through hemodynamic alterations. According to Anders et al., hyperglycemia reduces the amount of sodium that is exposed at the macula densa. This, in turn, causes glomerular hyperfiltration, dilates the afferent arteriole, suppresses tubuloglomerular feedback, and causes podocyte barotrauma, which ultimately leads to podocyte and nephron loss.
In a recent study, DM-CKD and DM had significantly greater FBG, 2 h PP, and HbA1c values than controls. While Alnaggar et al. and Gupta et al. discovered that FBS and 2 h PP were considerably greater in T2DM with microalbuminuria compared with normoalbuminuria group, the obtained results were in agreement with Motawi et al. According to Saulnier- Blache et al., there was no difference in HbA1c between DM and DM-CKD. Because hyperglycemia dysregulates multiple metabolic pathways, it has been proposed that hyperglycemia is the primary initiator of kidney damage linked to DN. According to Bedard and Krause, hyperglycemia exacerbates the formation of reactive oxygen species in the mitochondria, which damages DNA and promotes apoptosis. This, in turn, increases oxidative stress. Furthermore, as an inflammatory cytokine, TNF-α triggers the processes that lead to both cell death and survival. When TNF-α binds to TNF receptor-1, death domain protein is drawn to the site, activating more protein mediators and sending a signal from the active receptor to the signalling caspase cascade, which leads to apoptosis.
While there was no significant difference in BUN and creatinine between DM and controls, there was a difference in BUN, creatinine, and ACR between DM-CKD and both DM and controls. These outcomes agreed with those of Dabhi and Mistry and Doghish et al. In terms of lipid profile, there was no significant difference in total cholesterol and TG between DM and controls, while DM-CKD had significantly higher levels of these three markers than DM and controls. LDL-C and TG were also significantly higher. But compared to DM and controls, HDL-C was lower in DM-CKD; additionally, DM had lower HDL-C than controls. The outcomes obtained match the findings of Mahfouz et al. Furthermore, Motawi et al., found that whereas total cholesterol, LDL-C, and HDL-C did not significantly differ between patient groups, TG was higher in DM-CKD than in DM and controls. In the meanwhile, Alnaggar et al. found that the lipid profiles of DM and DM-CKD did not differ significantly. Under diabetic conditions, dyslipidemia increases the expression of extracellular matrix and activates macrophages in the glomeruli, which results in DN. Dyslipidemia is observed in diabetic patients with early stage renal damage, according to Doghish et al. It results in a rise in TG and a fall in HDL-C due to the compromised function of lipoprotein lipase, which is found in endothelial cells.
In this study, at cut-off level ≥ 83.5, tumor necrosis factoralpha had 96.7% sensitivity and 79.7% specificity for diagnosing diabetic nephropathy.
TNF-α concentrations were considerably greater in both patient groups than in the control group, and DM-CKD was higher than DM. In the DM-CKD group, TNF-α level had a strong positive connection with FBG, creatinine, total cholesterol, LDL-C, HbA1c, and ACR. These findings corroborated those of Chen et al., who discovered that TNF-α was elevated in both DM and DM-CKD, but was higher in the former. This suggests that DN has an enhanced inflammatory load. According to Chen et al. TNF-α is a pleiotropic cytokine that is essential for mediating inflammatory processes that are linked to glomerular and tubulointerstitial damage.
Conclusion
The study found that patients with DM and DM-CKD had considerably higher serum levels of TNF-α. This suggests that TNF-α may have a function in mediating changes in DN and may contribute to the progression of DM to DN. However, more investigation and clinical validation are required to confirm the link between TNF-α and the pathogenesis because to the intricacy of DN processes.
References
- Jacob JM, Karthik C, Saratale RG (2018) Biological approaches to tackle heavy metal pollution: A survey of literature. J Environ Manage. 217:56-70.
[Crossref] [Google Scholar] [PubMed]
- Bishop PL. Pollution prevention: Fundamentals and practice. Tsinghua University Press. 2002.
[Google Scholar]
- Wang J, Chen C (2006) Biosorption of heavy metals by Saccharomyces cerevisiae: A review. Biotechnol Adv. 24(5):427-451.
[Crossref] [Google Scholar] [PubMed]
- Kortenkamp A, Casadevall M, Faux SP (1996) A role for molecular oxygen in the formation of DNA damage during the reduction of the carcinogen Chromium(VI) by glutathione. Arch Biochem Biophys. 329(2):199-207.
[Crossref] [Google Scholar] [PubMed]
- Mitra S, Chakraborty AJ, Tareq AM (2022) Impact of heavy metals on the environment and human health: Novel therapeutic insights to counter the toxicity. J King Saud Univ Eng Sci. 34(3):101865.
[Google Scholar]
- Fred AO (2019) A 50-year review on heavy metal pollution in the environment: Bivalves as bio-monitors. Afr J Environ Sci Technol. 13(6):220-227.
[Google Scholar]
- Kumar R, Verma A, Shome A (2021) Impacts of Plastic pollution on ecosystem services, sustainable development goals, and need to focus on circular economy and policy interventions. Sustainability. 13(17): 9963.
[Google Scholar]
- Briffa J, Sinagra E, Blundell R (2020) Heavy metal pollution in the environment and their toxicological effects on humans. Heliyon. 6(9):e04691.
[Google Scholar]
- MacCarthy P, Klusman RW, Cowling SW (1995) Water analysis. Anal Chem. 67(12):525-582.
[Crossref] [Google Scholar] [PubMed]
Citation: Al Ghodran KIH, Dessouki AA, Abdelrazek HMA, Badran DI, Gad EM (2026) The Role of Human Tumor Necrosis Factor-? (TNF-?) in Predicting Diabetic Nephropathy in Type? Diabetic Patients. Biochem Mol Biol J. 12:03.
Copyright: © 2026 AI Ghodran KIH, et al. This is an open-access article distributed under the terms of the Creative Commons Attribution License, which permits unrestricted use, distribution, and reproduction in any medium, provided the original author and source are credited.