Keywords
Cholesteric LC; New polyesteramides; Synthetic methods; NMR; Molecular modeling
Introduction
Liquid crystals are self-organizing systems. With increasing temperature, they do not directly go from the crystalline state into the melt, in the middle they undergo a mesophase state which combine order of perfect crystals and mobility of liquids [1]. The parallel orientation of their longitudinal molecular axes is common to all mesophases (long-range orientational order). Two major classes can be distinguished: nematic (with molecular centers distributed isotropically) and smectic (molecular centers organized in layers). The special array of nematic planes stacked in a helical superstructure with a prevalent screw direction is called the cholesteric mesophase.
Cholesteric liquid polyesters have received much attention in the last few years for their interesting chemical, optical, mechanical and biological properties. Due to their anisotropic formulation and amphiphilic nature, their molecules are able to self-associate and/or aggregate in blocks to form species with supramolecular ordered structure which present desirable material properties.
Chiral, cholesteric liquid crystal poly[terephthaloyl-4-bisoxybenzoate- decamethyl-ethylene] [C34H36O8]n, named PTOBDME, m=9 in Figure 1, was obtained by polycondensation reaction between terephthaloyl-bis-(4-oxybenzoyl chloride) (TOBC) and DL-1,2 dodecanediol. Although only racemic materials were used in the synthesis, a cholesteric, chiral morphology, theoretically unexpected, was found. Evidence of this was obtained when a white solid, recrystallized, as the second fraction, from toluene mother liquor after the filtration of the polymer, was identified as –PTOBDME, with [α]25 589= –1.43 [1.538 gr/100ml, toluene] [2,3]. The synthetic method [4,5], based on the previously reported by Bilibin [6, 7], leads to the obtention of two fractions of different kinetic rates, with different diasteromeric excess [2]. Not always the diastereomer in excess is the same.
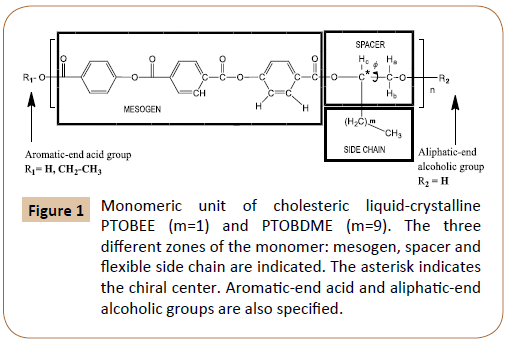
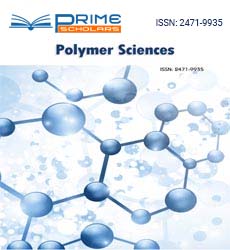
Figure 1: Monomeric unit of cholesteric liquid-crystalline PTOBEE (m=1) and PTOBDME (m=9). The three different zones of the monomer: mesogen, spacer and flexible side chain are indicated. The asterisk indicates the chiral center. Aromatic-end acid and aliphatic-end alcoholic groups are also specified.
A similar result had been previously attained for liquid crystal PTOBEE [C26H20O8]n, m=1 in Figure 1, also with cholesteric mesophase, from polycondensation reaction between the racemic glycol DL-1,2-butanediol and TOBC [4], with a similar mesogen as PTOBDME but with ethyl group along the side chain. Its second fraction was isolated as –PTOBEE, with a value of [α]25 589=-2.33 [0.0056 mol/l, toluene]. Its structure and diasteromeric excess were characterized by NMR [8].
Both polymers showed interesting technological properties as thermotropic and lyotropic behaviour, self-assembling in nanocavities in solution, with different conformations depending on the solvent and on the concentration [3], getting adsorbed on metal surfaces with reordering of the polymer in the interface [9] and interacting with biomacromolecules [10-13].
Our main interest is the molecular design and chemical modifications of multifunctional cholesteric liquid crystals, PTOBDME and PTOBEE, in order to obtain new chemical formulations involving macromolecular features with new properties, holding their helical structure and macromolecular features. The first feature we considered to be introduced was cationic charge, by entrance of Nitrogen atoms, which will also favour the creation of hydrogen bonds, through intra and intermolecular interactions, giving secondary structures with long range supramolecular order, able to interact with molecules of interest. The functional groups selected to be introduced in precursor PTOBDME and PTOBEE monomers, were amide groups para-substituting both ester groups in the central benzene ring of the terephthalate unit, along the main chain.
The final formulations of the new polyesteramide monomers, named PNOBDME (C34H38N2O6)n and PNOBEE (C26H22N2O6)n, are shown in Figure 2a and 2b respectively. The hydrogen and carbon atoms have been numbered as precursors PTOBDME [2,3] and PTOBEE [4,8], respectively. Their mesogens keep some similarities with Kevlar, wholly aromatic polyamide, difficult to process because it's not soluble in typical solvents [14]. Instead, PNOBDME and PNOBEE contain flexible aliphatic chains that would decrease their stiffness.
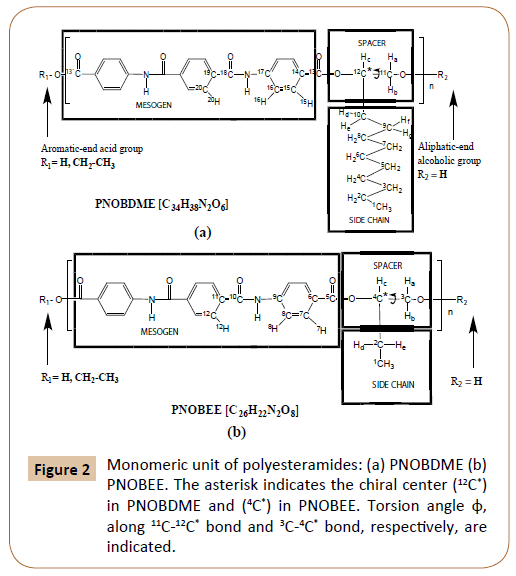
Figure 2: Monomeric unit of polyesteramides: (a) PNOBDME (b) PNOBEE. The asterisk indicates the chiral center (12C*) in PNOBDME and (4C*) in PNOBEE. Torsion angle φ, along 11C-12C* bond and 3C-4* bond, respectively, are indicated.
The intermediate compound of the monomeric mesogen, NOBA (C22H16N2O6), was referred in the National Cancer Institute Databases with potential AIDS and cancer activity [15].
Molecular Mechanics conformational analysis, predict helical structure models for PNOBDME and PNOBEE, as designed in Figure 2. Instead no helical polymer models were attained in the computational calculations when the amide group enter along the lateral side chain.
We report, the synthesis of polyesteramides PNOBDME [C34H38N2O6]n and PNOBEE (C26H22N2O6)n. The structure of the polymers so obtained is confirmed by 1H, 13C, COSY and HSQC NMR. The spectra are quite similar to those of precursor PTOBDME and PTOBEE, as it was expected, and the shifts were assigned according to our previous notation [2,8]. Their thermal stability is studied by TG and DSC analysis.
Molecular Mechanics Simulation of PNOBDME
Molecular Mechanics modelling of PNOBDME monomer was attained with the help of Materials Studio Windows v.2018 [16]. UNIVERSAL Force Field was loaded, both atomic mass and charge were considered. The monomer model is shown in Figure 3a, with its geometry optimised by minimising the energy to 95 Kcal/ mol. Monomer polymerization was simulated by considering the 11C atom, in Figure 2a, as head atom, the O atom bonded to 13´C as tail atom and 12C as chiral centre. Homopolymerization was then performed with Head-to-Tail orientation, torsion angle between monomers fixed to 180°. Syndiotactic tacticity was finally imposed to the polymer chain. A helical polymer model along the main chain was obtained, Figure 3b, whose perpendicular cross section is shown in Figure 3c.
Figure 3: Molecular simulation of PNOBDME: (a) Minimum energy monomer (b) Syndiotactic [PNOBDME]10 (c) Polymer cross sectional view.
Materials
Synthesis of PNOBDME [Poly[oxy(1,2- dodecane)-oxy-carbonyl-1,4-phenylene-aminecarbonyl- 1,4-phenylene-carbonyl-amine-1,4- phenylene-carbonyl], (C34H38N2O6)n
The new synthetic way is based on our previous experience for the obtention of cholesteric PTOBDME and a method by Sek et al. [17,18] reported for polycondensation reaction to obtain polyestereamides. In this case, we obtained an intermediate acid chloride yield lower than the obtained for the precursor polyesters.
PNOBDME, III in Figure 4, was obtained through polycondensation reaction between 4-4´-(terephthaloyl-diaminedibenzoic chloride) NOBC, II in Figure 4, and the racemic mixture of DL- 1,2-dodecanediol. Notation similar to precursor cholesteric liquid crystal PTOBDME [2,3] obtained by similar method, has been used.
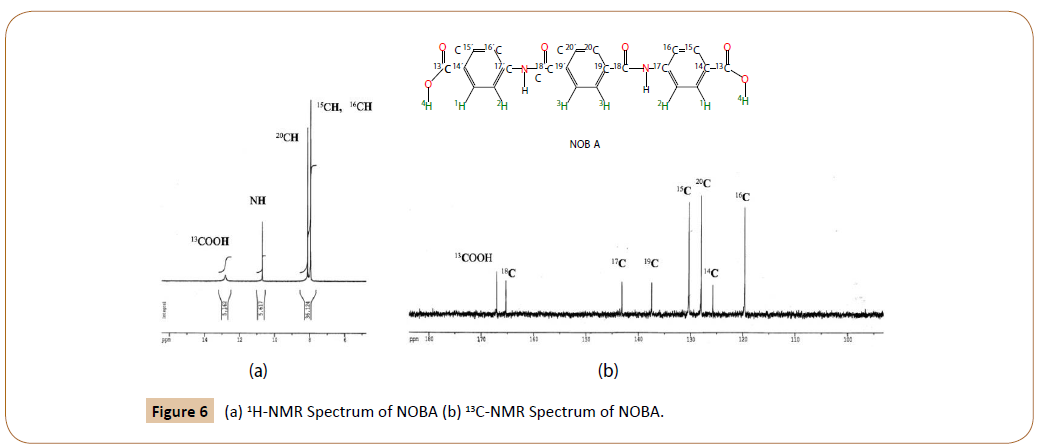
Figure 4: Scheme of polycondensation reaction of PNOBDME.
Starting materials: Terephthaloyl chloride from Sigma-Aldrich Chemie GmBH (Steinheim, Germany); Carbon tetrachloride from Panreac Química (Montcada i Rexach, Barcelona, Spain); NaOH from Panreac Química (Montcada i Rexach, Barcelona, Spain); 4-Aminobenzoic acid from Sigma-Aldrich Chemie GmBH (Steinheim, Germany); Hydrochloric acid from Normapur VWRInternational (Fontenay-sous-Bois, France); Thionyl chloride from Sigma-Aldrich Chemie GmBH (Steinheim, Germany); Chloroform from SDS Votre Partenaire Chimie (Peypin, France); DL-1,2-dodecanediol from Flucka Chemie GmBH (Buchs, Switzerland); Diphenyl oxide from Sigma-Aldrich Chemie GmBH (Steinheim, Germany); Nitrogen from Praxair (Madrid, Spain); Toluene from Merck KGaA (Darmstadt, Germany).
Preparation of NOBA (I in Figure 4): Solutions of 0.1 mol terephthaloyl chloride in 200 ml carbon tetrachloride and 0.2 mol NaOH in water, were added while stirring at room temperature in the course of 15 minutes, to a solution 0.22 mol of 4-Aminobenzoic acid and 0.2 mol NaOH, in 400 ml water mili-Q grade. Stirring was continued for a further 12 hr. A sediment was separated out, filtered, washed several times with 40 ml of cold water, dried, comminuted and transferred to a vessel where it was mixed for 3 hours with 300 ml of hydrochloric acid. The product was filtered, washed several times with 40 ml of cold water, dried and comminuted. Yield 28 gr (70%).
Preparation of NOBC (II in Figure 4): In the course of 25 minutes 15 gr NOBA were added to 350 ml thionyl chloride, while stirring rapidly at room temperature.
The solution was boiled with the reflux condenser. When the liberation of HCl ended and most of the sediment had dissolved, the hot solution was filtered and cooled down to 0°C for a day. The obtained product that separated out was filtered, vacuum dried and recrystallized in chloroform. Yield: 7.2 gr (48%).
Preparation of PNOBDME: A mixture of 0.017 mol NOBC and 0.017 mol DL-1,2-dodecanediol, was added to 44 ml of diphenyl oxide. Purge with dry nitrogen, was used for 25 min at room temperature and then, while maintaining the gas current, the flask was transferred to a bath containing a high-temperature heat-transfer agent. The polycondensation was carried out for 3 hr. 30 min. at 200°C. The reaction finished when the liberation of HCl ended. The result of the polycondensation reaction was poured into 500 ml of toluene, decanting PNOBDME, which was filtered, washed three times with ethanol and vacuum dried. A second fraction of PNOBDME precipitated of the filtrated toluene after 22 weeks which also filtered, washed with ethanol and vacuum dried.
Yield first fraction: 2.6 gr (25.5%);
Yield first and second fraction: 3.1 gr (30.4%).
Synthesis of PNOBEE [Poly[oxy(1,2-buthylene)- oxy-carbonyl-1,4-phenylene-amine-carbonyl- 1,4-phenylene-carbonyl-amine-1,4-phenylenecarbonyl]: (C26H22N2O6)n
PNOBEE, III in Figure 5, was obtained through polycondensation reaction between 4-4´-(terephthaloyldiaminedibenzoic chloride) NOBC, II in Figure 5, and the racemic mixture of DL-1,2-butanediol. Notation of cholesteric liquid crystal precursor PTOBEE has been used.
Figure 5: Scheme of polycondensation reaction of PNOBEE.
NOBC [4-4´-(terephthaloyldiaminedibenzoic chloride)], II in Figure 5, was synthesized by reaction of NOBA [4-4´-(terephthaloyldiaminedibenzoic acid)], I in Figure 5, with SOCL2 and recrystallizated in chloroform; previously NOBA was obtained by interface condensation between terephthaloyl chloride and 4-Aminobenzoic acid.
Starting material: DL-1,2-butanediol from Flucka Chemie GmBH (Buchs, Switzerland); Chloronaphthalene from Sigma- Aldrich Chemie GmBH (Steinheim, Germany); Nitrogen from Praxair (Madrid, Spain); Toluene from Merck KGaA (Darmstadt, Germany).
Preparation of PNOBEE: A mixture of 0.015 mol NOBC and 0.015 mol DL-1,2-butanediol, was added to 39 ml of chloronaphthalene. Purge with dry nitrogen, was used for 25 min at room temperature and then, while maintaining the gas current, the flask was transferred to a bath containing a hightemperature heat-transfer agent. The polycondensation was carried out for 180 minutes at 200°C.The reaction finished when the liberation of HCl ended. The result of the polycondensation reaction was poured into 500 ml of toluene, decanting PNOBEE, which was filtered, washed with ethanol and vacuum dried. A second fraction of PNOBEE precipitated of the filtrated toluene after 22 weeks which also filtered, washed with ethanol and vacuum dried.
Yield: 2.9 gr (46.5%).
Characterization techniques
The structures of NOBA and NOBC (I and II in Figures 4 and 5) are confirmed by conventional NMR techniques: 1H-RMN, 13C-NMR, COSY (Homonuclear Correlation Spectroscopy), TOCSY (Total Correlation Spectroscopy), NOESY (Nuclear Overhauser Effect Spectroscopy, through-space correlation method) and HSQC (Heteronucle ar Single-Quantum Correlation spectroscopy) registered in DMSO-d6 at 25°C in a Bruker 300MHz NMR spectrometer.
The structures of PNOBDME and PNOBEE have been confirmed by 1H-RMN, 13C-NMR, COSY, HSQC and HMBC (Heteronuclear Multiple Bond Correlation for correlations between carbons and protons that are separated by two, three, and, sometimes four bonds, in conjugated systems. Direct one-bond correlations being suppressed) obtained in VARIAN 400 MHz and 500 MHz spectrometers, also at room temperature. The solvent used in all cases was DMSO-d6 from Merck KGaA (Darmstadt, Germany).
1H chemical shifts were referenced to the residual solvent signal at δ=2.50 ppm (DMSO-d6) relative to tetramethylsilane (TMS). All the spectra were processed and analyzed with MestReNova v.11.0.3-18688 software [19,20].
Thermal stability measurements were studied on a Mettler TA4000-TG50 at heating rate of 10°C/min with nitrogen purge between 30-600°C. Thermal behaviour was determined by differential scanning calorimetry (DSC) in a Mettler TA4000/ DSC30/TC11 calorimeter, with series of heating/cooling cycles in a temperature range between 0-230°C.
Microcalorimetry was evaluated in a MicroCal Inc., Model: MCSDSC, within a range of temperature 4-120 °C, at a heating rate of 10-20°C/hora, volume of sample 1.5 ml.
The optical activity of the polymer was mesasured as optical rotatory dispersion (ORD) at 25°C in DMSO from Scharlau Chemie, in a Perkin Elmer 241 MC polarimeter with wavelengths: λNa=589 nm, slit=5 mm, integration time=50 s; λHg=574 nm, slit=14 mm, integration time=50s; λHg=546 nm, slit=30 mm, integration time=50 s; λHg=435 nm, slit=5 mm, integration time=50s; λHg=365 nm, slit=2.5 mm, integration time=50 s.
The morphology or the samples was observed by Environmental Scanning Electron Microscope (ESEM), PHILIPS XL30.
Results and Discussion
Structural characterization of NOBA and NOBC by NMR
1H-NMR of NOBA in DMSO-d6 at 25°C: Figure 6a shows the 1H-RMN spectrum of NOBA. The chemical shifts were assigned, according to the notation in Figure 2a and Figure 4-I, as follows.
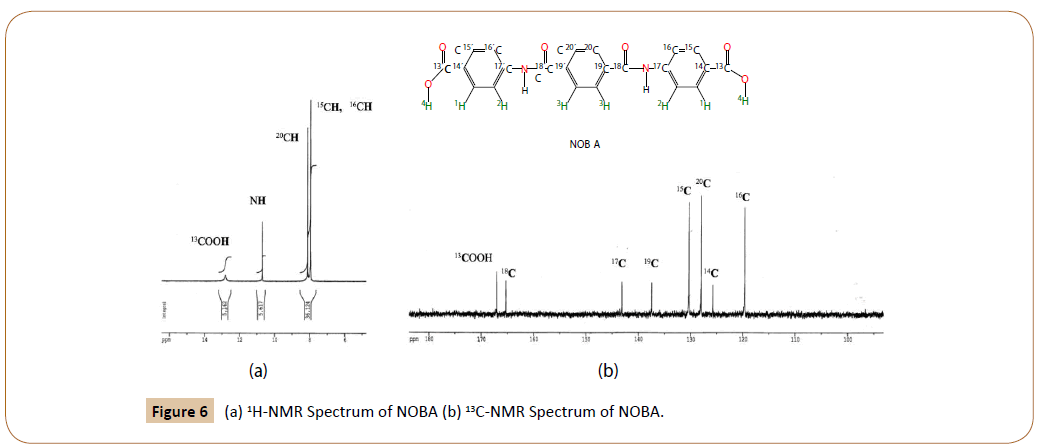
Figure 6: (a) 1H-NMR Spectrum of NOBA (b) 13C-NMR Spectrum of NOBA.
δ (in ppm from tetramethylsilane): 12.8 (12.74) (s, 2H, C13OO ); 10.7 (10.31) (s, 2H, 18CON-17C); 8.11(8.18) (s, 4H, C20); 7.95 (8.30) (m, 4H, C16); 7.95 (m, 4H, C15). Predicted values are depicted tilted in parenthesis.
Besides the protons due to ended carboxilic groups, and to amide groups, two strong signals are observed in the aromatic zone of the 1H-NMR spectrum of NOBA, for to the benzene protons, 20C, 15C and 16C. The last two indistinguishable at 7.95 ppm. The experimental results are in agreement with the chemical shifts calculated by MestReNova v.11.0.3-18688 [19,20].
13 C-RMN of NOBA in DMSO-d6 at 25°C: The 13C-RMN of NOBA is given in Figure 6b. Their experimental chemical shifts are in complete agreement with those predicted (tilted in parenthesis).
δ (in ppm from tetramethylsilane): 167.3 (169.3) (2C 13 OOH); 165.6 (164.7) (2C 18=ONH); 143.4 (143.2) (2C NH-17); 137.7 (134.2) (2C 19); 130.6 (130.5) (4C 15H); 128.3 (127.6) (4C 20H); 126.1 (125.8) (2C 14-COOH); 119.9 (115.8) (4C 16H).
COSY OF NOBA in DMSO-d6 at 25°C: The assignments of peaks in the COSY spectrum of NOBA are given in Table 1.
Table 1: COSY-NMR Assignment for NOBA.
| 1H 1H |
20H 8.11 |
15H, 16H 7.95 |
| 20H 8.11 |
1.5 |
|
| 15H, 16H 7.95 |
|
4.9 |
HSQC of NOBA in DMSO-d6 at 25°C: The HSQC experiment (heteronuclear single quantum correlation) of NOBA appears in Figure 7. The corresponding peaks assignment is shown in Table 2.In the HSQC spectrum the correlation between each aromatic C atom with their corresponding H atoms can be seen. Signals due to 15H and 16H, overlapped in the 1H spectra, appear in the HSQC splitted for the two carbon atoms 15C and 16C respectively. The assymetric shape of both protons allows their differentiation. While 16H slightly shifts towards lower ppm value, 15H shifts to higher ppm.
Table 2: HSQC signals of NOBA.
| 1H-NMR 13C-NMR |
20H 8.11 |
15H, 16H 7.95 |
| 15C 130.6 |
|
2.6 |
| 20C 128.3 |
1.4 |
|
| 16C 119.9 |
|
5.2 |
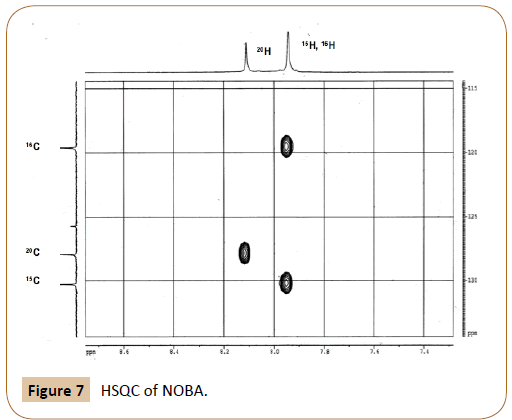
Figure 7: HSQC of NOBA.
The integral ratio of aromatic peaks, (15H+16H) : 20H, is observed to be 2:1 in the 1H spectrum, in agreement with the HSQC esperiment. The structure of NOBC, Figure 4-II, has also been confirmed by NMR experiments. Data are not given as they do not provide further information than NOBA to the present contribution.
Structural characterization of polyesteramide PNOBDME by NMR
The structure of PNOBDME, as described in Figure 2a, has been characterized by: 1H-RMN, 13C-NMR, COSY, TOCSY, NOESY and HSQC, in DMSO-d6. In Figure 8a the 1H-NMR spectrum is given, compared to that of PTOBDME, in Figure 8b. Figure 9 exhibits the 13C-NMR spectrum.
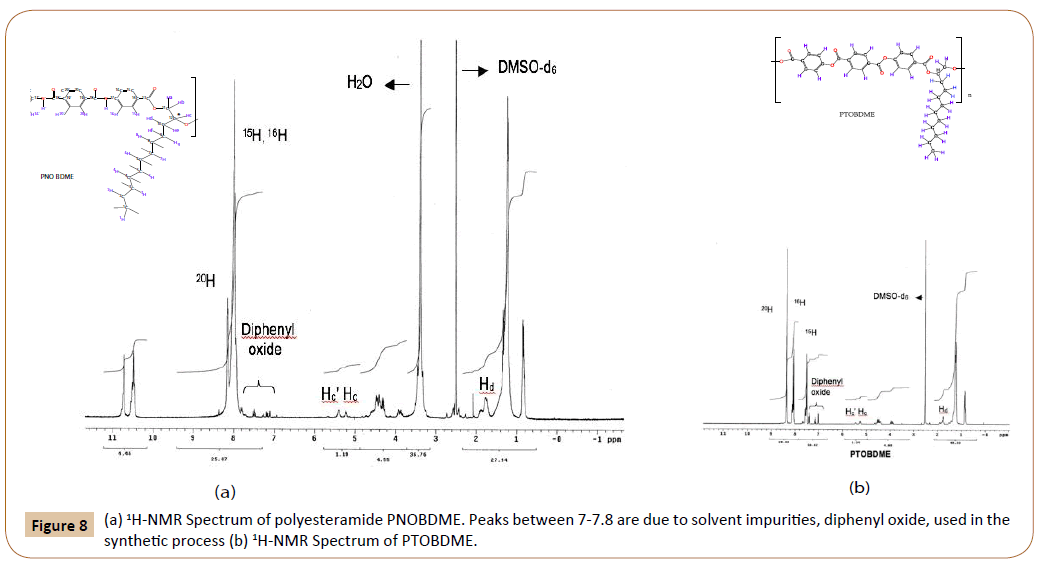
Figure 8: (a) 1H-NMR Spectrum of polyesteramide PNOBDME. Peaks between 7-7.8 are due to solvent impurities, diphenyl oxide, used in the synthetic process (b) 1H-NMR Spectrum of PTOBDME.
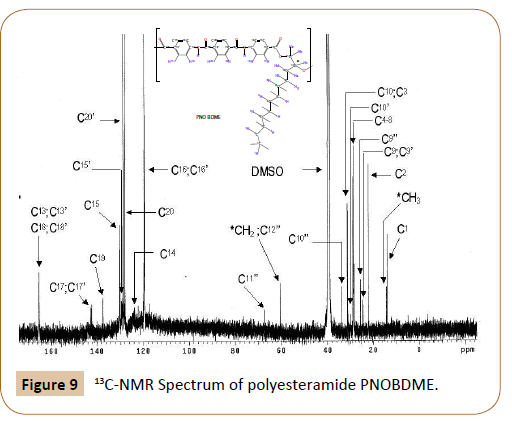
Figure 9: 13C-NMR Spectrum of polyesteramide PNOBDME.
1H-RMN: (400MHz, DMSO-d6, 25°C): δ(ppm) 10,7 (s, 2H C18ON-C); 10,45 (m, 2H C18ON-C); 8,14 (s, 4H, HNCO-C-C20HC- CONH); 7,98 (m, 4H, COO-C-C15-CH-C-NHCO); 7,98 (m, 4H, COO-C-CH-C16-CNHCO); 5,39 (m 1H, C=OO-CH’aH’b-C12c’-R1R2); 5,22 (m 1H, C=OO-CHaHb-C12c-R1R2); 4,54 (dd 1H, J=12 Hz J=4Hz C=OO-C11’aH’b-CH’-R1R2); 4,44 (dd 1H, J=11,5 Hz J= 8Hz C=OOC 11H’a’b-CH’-R1R2); 3,91 (dd 1H, J= 12Hz J=4Hz C=OO-C11aHb-CHR 1R2); 3,83 (dd 1H, J= 12Hz J=5Hz C=OO-C11Hab-CH-R1R2); 1,85 (m 2H, CH2-C102CH-R1R2); 1,74 (m 2H, CH2-C102-CH’-R1R2); 1,50 (m 2H, (m 2H, C92-CH2-CH-R1R2); 1,40 (m 2H, C92-CH2CH’-R1R2); 1,24 (m 14H, C82-C72-C62-C52-C42-C32-C22-CH3); 1,21 (m 14H, C82-C72-C62-C52-C42-C32-C22-C3); 0,86 (t 3H, CH2- C13); 0,82 (t 3H, CH2-C13).
13C-RMN: (400MHz, DMSO-d6, 25°C): δ(ppm) 165,2 (2C 13=OO o 2xC 18=ONH); 137,4 (2C HNCO-C-CH-CH-19-CONH); 130,3 (4C C=ONH-C-CH-15H-C-COO); 130,1 (4C C=ONH-C-CH-15HC- COO);128,7 (4C C=ONH-C-CH-20H-C-C=ONH); 128,0 (4C C=ONH-C-CH-20H-C-C=ONH); 119,6 (4C C=ONH-C-16H-CH-CCOOH); 119,4 (4C C=ONH-C-16H-CH-C-COOH); 31,3 (1C R1R2CH10H2CH2); 29,0 28,8, 28,7 and 28,4 (5C C9H2-8H2 7H2-6H2-5H2- 4H2 -CH2-CH2-CH3); 25,6 22,12 (2C 3H2-2H2-CH3); 14,0 (1C 1H3).
The complete assignment of the 1H and 13C-NMR chemical shifts for the monomeric unit and the end groups of PNOBDME, are given in Table 3, together with their theoretical values calculated by MestReNova [19,20]. Similar notations as those assigned to precursor cholesteric liquid crystal polyesters PTOBDME [2] have been used.
Table 3: 1H and 13C-NMR Chemical Shifts (ppm) observed for chiral polyesteramide PNOBDMEand Theoretically calculated values.
| System ( ‘ ) |
System ( ) |
Theoretical Shifts |
| Atom |
1H |
Atom |
13C |
Atom |
1H |
Atom |
13C |
Atom |
1H |
Atom |
13C |
| 20’H |
8.03 |
20’C |
128.7 |
20H |
8.13 |
20C |
127.9 |
20H |
8.18 |
20C |
127.6 |
| |
|
19’C |
142.4 |
|
|
19C |
137.2;139.1 |
|
|
19C |
134.2 |
| N’H’ |
10.48 |
18’C |
165.3 |
NH |
10.71 |
18C |
165.3 |
NH |
10.25 |
18C |
164.7 |
| |
|
17’C |
144.2 |
|
|
17C |
144.2 |
|
|
17C |
142.2 |
| 16’H |
7.975 |
16’C |
119.7 |
16H |
7.985 |
16C |
119.6 |
16H |
7.95 |
16C |
118.7 |
| 15’H |
7.962 |
15’C |
129.8 |
15H |
8.00 |
15C |
130.3 |
15H |
7.98 |
15C |
130.1 |
| |
|
14’C |
124.7 |
|
|
14C |
123.5 |
|
|
14C |
125.7 |
| |
|
13’C |
165.0 |
|
|
13C |
165.0 |
|
|
13C |
165.9 |
| Hc’ |
5.39 |
12’C |
73.2 |
Hc |
5.22 |
12C |
73.7 |
Hc |
4.55 |
12C |
73.6 |
| Ha’,Hb’ |
4.54;4.44 |
11’C |
65.8 |
Ha,Hb |
3.91;3.83 |
11C |
46.7 |
Ha,Hb |
4.80;4.55 |
11C |
64.3 |
| Hd’,He’ |
1.79 |
10’C |
30.7 |
Hd,He |
1.74 |
10C |
31.8 |
Hd,He |
1.71 |
10C |
30.7 |
| Hf’,Hg’ |
1.42 |
9’C |
24.6 |
Hf,Hg |
1.34 |
9C |
24.2 |
Hf,Hg |
1.29 |
9C |
25.3 |
| 8-5’H |
1.25 |
8-5’C |
28.6 |
8-5H |
1.25 |
8-5C |
28.6 |
8-5H |
1.29 |
8-5C |
29.6 |
| 4’H |
1.25 |
4’C |
28.4 |
4H |
1.25 |
4C |
28.4 |
4H |
1.26 |
4C |
29.3 |
| 3’H |
1.25 |
3’C |
31.3 |
3H |
1.25 |
3C |
31.3 |
3H |
1.26 |
3C |
31.9 |
| 2’H |
1.25 |
2’C |
22.1 |
2H |
1.25 |
2C |
22.1 |
2H |
1.26 |
2C |
22.7 |
| 1’H |
0.85 |
1’C |
13.9 |
1H |
0.86 |
1C |
13.9 |
1H |
0.88 |
1C |
14.1 |
| Experimental signals aliphatic end group |
Theoretical Shifts End group ( ‘‘ ) |
| Hc’’ |
4.35 |
12’’C |
60.4 |
Hc’’ |
3.81 |
12’’C |
70.8 |
| Ha’’,H b’’ |
4.54;4.44 |
11’’C |
67.5 |
Ha’’,Hb’’ |
4.53;4.28 |
11’’C |
70.8 |
| Hd’’;He’’ |
1.89;1.77 |
10’’C |
34.6 |
Hd’’;He’’ |
1.44 |
10’’C |
34.0 |
| Hf’’, Hg’’ |
1.51;1.42 |
9’’C |
26.0 |
Hf’’;Hg’’ |
1.29 |
9’’C |
25.6 |
| 8-5’’H |
1.21 |
8-5’’C |
28.6 |
8-5’’H |
1.29 |
7-5’’C |
29.6 |
| 4’’H |
1.21 |
4’’C |
28.4 |
4’’H |
1.26 |
4’’C |
29.3 |
| 3’’H |
1.21 |
3’’C |
31.3 |
3’’H |
1.26 |
3’’C |
31.8 |
| 2’’H |
1.21 |
2’’C |
22.1 |
2’’H |
1.26 |
2’’C |
22.7 |
| 1’’H |
0.85 |
1’’C |
13.9 |
1’’H |
0.86 |
1’’C |
14.1 |
| Experimental aromatic ester end group signals |
|
| CH2 * |
4.25 |
CH2 * |
60.6 |
|
| CH3 ** |
1.33 |
CH3 * |
14.2 |
|
The proton spectrum can be divided in three zones which structurally would correspond to the mesogen including aromatic and amide protons between 11.0-7.00 ppm, the flexible side chain formed by aliphatic protons between 2.0-0.5 ppm, detailed in Figure 8a, and the spacer with the CHn protons directly attachment to O atoms, between mesogen and side chain, with signals from 5.5-3.5 ppm.
The main feature of the proton spectrum is the presence of higher number of peaks than those expected for the monomeric unit. Hydrogen atoms Ha and Hb are diastereotopic, since they are bonded to 11C atom, allocated in α with respect to the asymmetric carbon atom 12C*, hence their signals, indistinguishable by 1H-NMR, splits in two easily differentiated. The same effect is observed for Hd and He, bonded to 10C, and for Hf and Hg, both bonded to 9C.
The presence of two independent 1H-NMR sets of signals are observed in the spectrum, one marqued with (‘) and another without apostrophe (). They are attributed to two conformers gg and gt of the spacer within the repeating unit respectively. The same effect have been reported for PTOBDME and PTOBEE, and accordingly similar nomenclature is used to identify the signals. A third set of signals, marqued with (‘’), is assigned to the aliphatic end group.
The number of peaks and chemical shifts in the aromatic zone of the 1H-NMR spectra of PNOBDME are different from those observed for polyester PTOBDME, due to the presence of the central ring of terephthalamide instead of terephtalate. The main difference between both spectra are two peaks at 10.71 ppm and 10.48 ppm, observed in the polyesteramide spectrum, designated as protons NH and N‘H‘, theoretically expected at 10.73, splitted either by the presence of two diasteroisomers, or by differences between the two amides environment within the monomer.
In the same mesogen zone two strong peaks are observed for polyesteramide PNOBDME, as in the case of NOBA, at 8.13 ppm, due to benzene protons 20H, and a multiplet centered at 7.95 ppm (broad and overlapped) assigned to aromatic protons (15H+16H) respectively, which match the calculated values (8.18 ppm for 20H) and (7.98 ppm for 15H and 7.95 ppm for 16H). However the proportion between integrals of signals 8.13:7.95 was 1:5, instead of 1:2. On the contrary the three benzene protons are clearly distinguished in the case of polyester PTOBDME, see Figure 8b.
Detail of the zone corresponding to the spacer in the 1H spectrum of PNOBDME can be seen in Figure 10. Multiplets observed at 5.39 and 5.22, are interpreted as protons Hc’, Hc of the two diasteroisomers, hence the diasteroisomer excess could be easily evaluated by their integral ratio. The peak observed at 4.35 ppm is, designated as Hc’’ in the aliphatic-OH end group. A triplet at 4.25 ppm, is assigned to the OCH2CH3 ester in the aromatic end group.
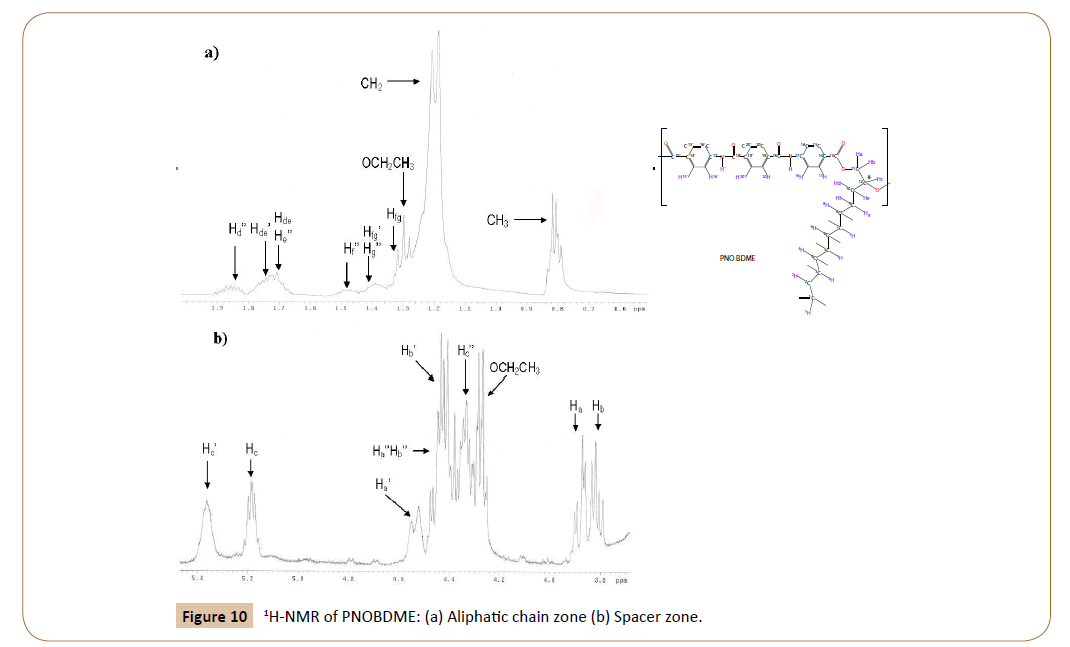
Figure 10: 1H-NMR of PNOBDME: (a) Aliphatic chain zone (b) Spacer zone.
Similarly to Hc protons, three independent pairs of HaHb signals, due to the splitting of diastereotopic hydrogen atoms are also observed, two for the monomer marked with (’) and without it () and one for the aliphatic-OH end group marked with (‘’). The double doublet at 4.54 ppm, and the very complex signal at 4.44 ppm are attributed to Ha’ and Hb’ respectively, and the pair of double doublets at 3.91, 3.83 ppm are interpreted as Ha and Hb. Signal at 4,44 would be formed by one double doublet overlapped with a pair of double doublets.
The integral ratio between peaks Hc’ (5.39 ppm) and Ha’ (4.54 ppm) gives a ratio 1:1. Peaks Hc (5.22 ppm), Ha (3.91 ppm) and Hb (3.83 ppm) present a ratio 1:1:1. The TOCSY experiment, will confirm these assignations and will resolve the overlapped signal at 4.44 ppm. The aliphatic zone, in Figure 8a, exhibits multiplets centered at 1.89, 1.77, 1.51, 1.42, 1.25 and 0.86. The last two are directly assigned to (CH2) and CH3, among the first four, only two were predicted. They are resolved also by TOCY. All these signals were also observed for PTOBDME.
The 1H-1H TOCSY 2D experiment, in Figure 11, shows the correlations between the proton signals Hc’, Hc and Hc’’ with their respective coupling networks, hence confirming the presence of three independent set of signals.
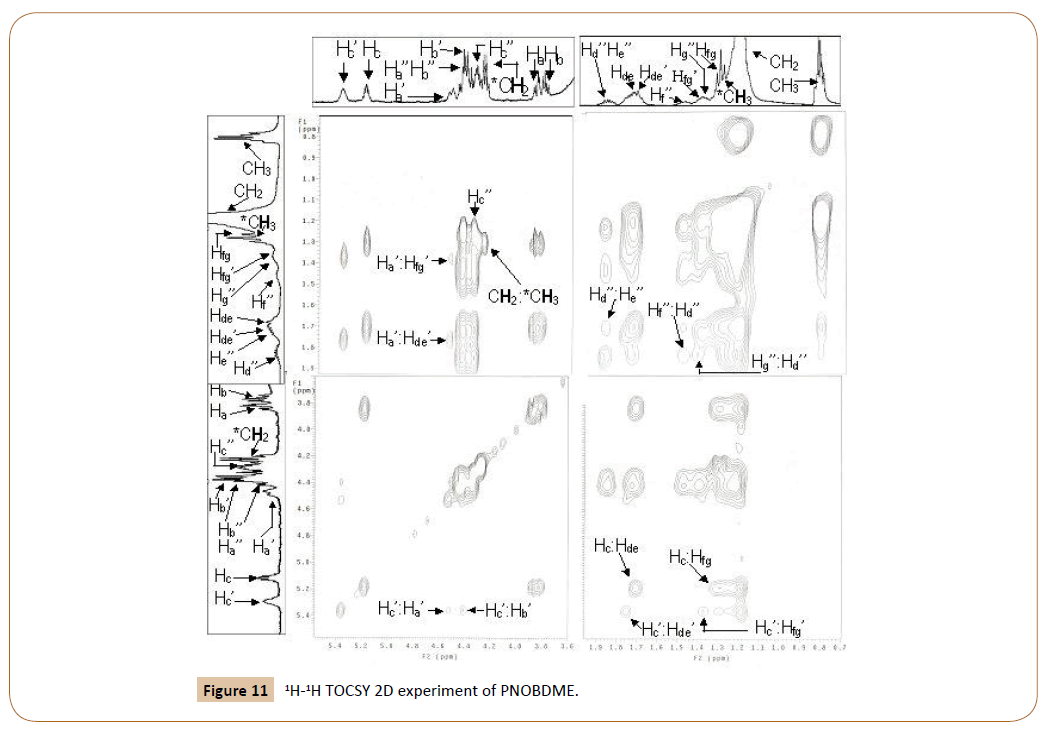
Figure 11: 1H-1H TOCSY 2D experiment of PNOBDME.
Besides, the multiplets overlappings due to spin-spin coupling, can be resolved: at 4.44 ppm in signals Ha’’, Hb’’ and Hb’; at 1.77 ppm distinguishing signals HdHe, Hd’He’ and He’’; at 1.44 ppm as due to signals Hf’Hg’ and Hg’’. Even a new signal at 1.34 corresponding to HfHg could be observed.
The experiment COSY confirmed the assignment with the correlation of double doublets at 4.54 ppm (Ha’) and 4.44 ppm (Hb’) with multiplet Hc’ at 5.39 ppm, and this with 1.79 ppm (Hd’He’), and this with 1.42 ppm (Hf’ Hg’). The same correlation is found with double doublet at 3.91 ppm (Ha) and 3.83 ppm (Hb) with 5.22 ppm (Hc), and this with 1.74 ppm (HdHe), and finally with 1.34 ppm (HfHg). COSY did not let identify the end group overlapping signals.
Correlation between aromatic and amide protons of PNOBDME can be elucidated by 1D-NOESY experiment, in Figure 12. When irradiated at 10.71 ppm, the peak NH shows positive NOE with 20H (8.13 ppm) and with 16H (7.985 ppm). Irradiated at 10.48 ppm, N´H´ shows positive NOE with 20’H (8.03 ppm) and with 16’H (7.975 ppm). The 1D-NOESY irradiated at 1.74, HdHe showed a broad positive NOE with 15H (8.00 ppm).
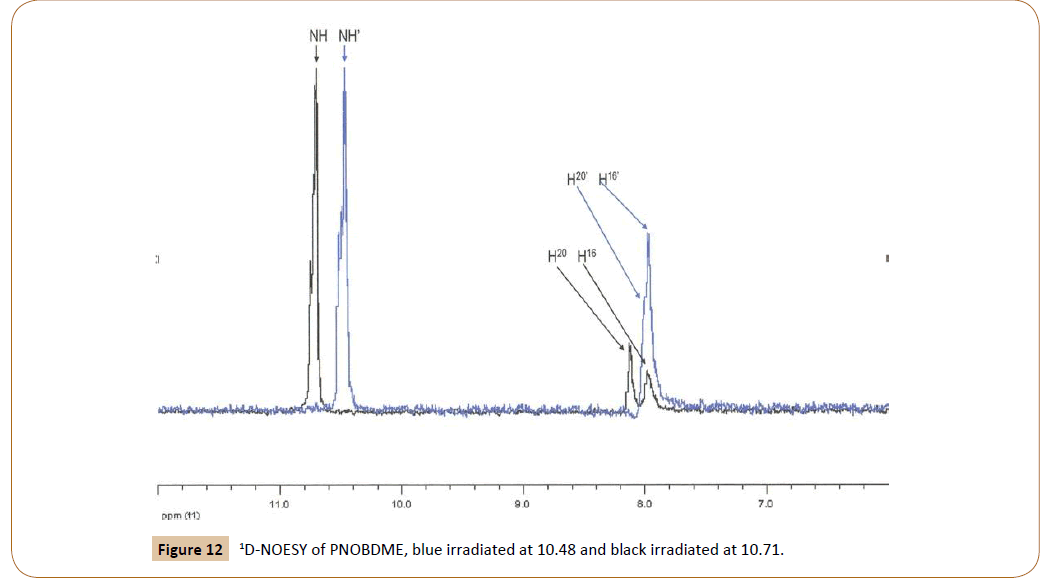
Figure 12: 1D-NOESY of PNOBDME, blue irradiated at 10.48 and black irradiated at 10.71.
These correlations of the aromatic protons with the amide protons and aliphatic would explain the (1:5) proportion observed between signal at 8.13 and overlapped signal centered at 7.97, previously mentioned. More precise differentiation and assignation between of 16H and 16’H and also 15H and 15’H is hard to be performed with this technique, due to overlapping.
Similarly to the changes in the proportion of integral signals Hc :Hc’, between the first and second fraction of PNOBDME, different amide protons ratio NH: N‘H‘ can be distinguished in different polymer fractions.
The assignment of carbons directly bonded to protons is carried out by the HSQC experiment, in Figure 13. Correlation between protons Ha’(4.54 ppm) and Hb’(4.44 ppm) with the same carbon atom 11’C (65.8 ppm) is confirmed. Within proton multiplet around 4.44 ppm, carbon atom 11’’C (67.5 ppm) is connected with signals Ha’’ and Hb’’ (4.44 ppm), undiscernable in the proton experiments. The correlation between Ha (3.91 ppm) and Hb (3.83 ppm) with carbon atom 11C at (46.7 ppm) is also observed.
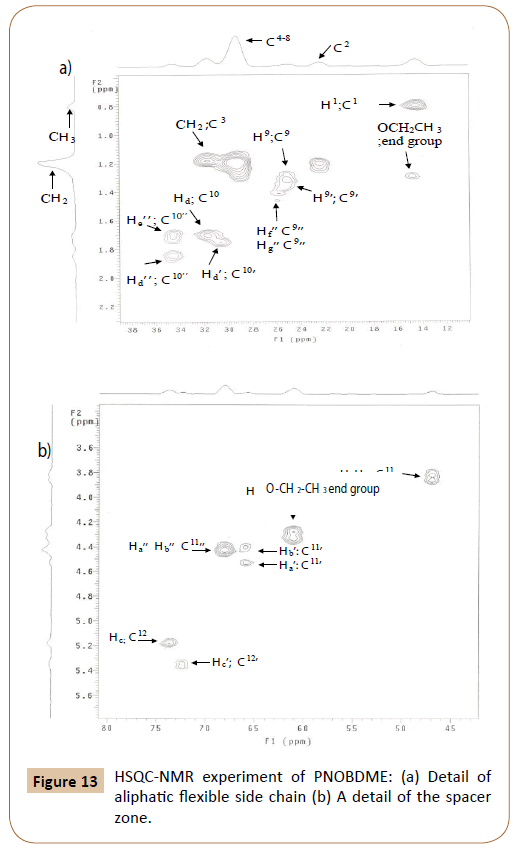
Figure 13: HSQC-NMR experiment of PNOBDME: (a) Detail of aliphatic flexible side chain (b) A detail of the spacer zone.
The complex signal of proton centered at 1.77, solved in the TOCSY experiment, is also resolved in HSQC, by three correlation signals between Hd’He’ (1.79 ppm) with carbon 10’C at (30.7 ppm) and HdHe (1.74 ppm) with carbon 10C (at 31.8 ppm); and He’’ (1.77 ppm) with carbon 10’’C (34.6 ppm) which is also correlated with Hd’’(1.89 ppm).
Multiplet around 1.44 can be solved by distinguishing correlation between protons Hf’Hg’(1.42 ppm) with carbon 9’C (24.6 ppm) and HfHg (1.34 ppm) with 9C (24.2 ppm). Adittionally carbon 9’’C (26.0 ppm) also correlates with Hf’’(1.51 ppm) and Hg’’(1.42 ppm), in agreement with the TOCSY results.
In the aromatic zone, the assignation of 20’H (8.03 ppm) and 20H (8.13 ppm) is confirmed and these signals presented correlation with 20’C (128.7 ppm) and 20C (127.9 ppm) respectively. Two broaden correlations are observed between 15’H (8.0 ppm) and 15’C (130.3 ppm) and between 16H (7.980 ppm) and 16C (119.6 ppm).
With the help of HMBC experiment, in Figure 14, with correlations carbon-proton separated by two, three, and, even four bonds apart, the HSQC broaden correlations between aromatic 15H and 15C, and 16H and 16C can be resolved and related to the sets of signals (‘) and without it ( ). Additionally, carbonyl and cuaternary carbons atoms are also confirmed by HMBC.
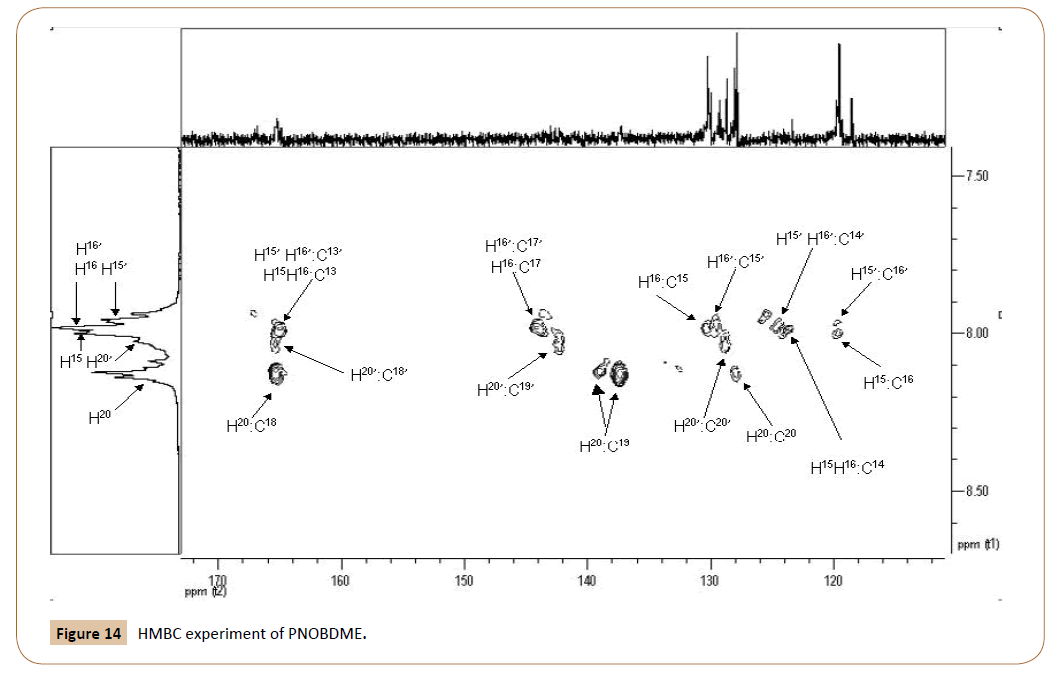
Figure 14: HMBC experiment of PNOBDME.
In HMBC the following cross signals are observed: 16C (119.7 ppm) correlates with NH (10.71 ppm) and also with 15H (8.00 ppm); Signal 16‘C (119.6 ppm) causes correlation with N‘H‘ (10.48 ppm) and also with 15’H (7.962 ppm); Signal 15H (8.00 ppm) correlates with 14C ( 123.5 ppm) and with 17C (144.2 ppm) too; Signal 16H (7.985 ppm) correlates with 14C (123.5 ppm) and 17C (144.2 ppm) and 15C (130.3 ppm); Signal 15’H (7.962 ppm) also presented another correlation with 14’C (124.7 ppm); Correlation between 16’H signals (7.975 ppm) and 15’C (129.6 ppm) was confirmed and another cross signals of 16’H with 14’C (124.7 ppm); 16’H also showed correlation with 17C (144.2 ppm) as 16H; 20H (8.13 ppm) correlates with 20C (127.9 ppm) and with two carbon atoms at 19C (137.2 ppm) and (139.1 ppm). It also correlates with 18C (165.3 ppm); 20’H at 8.03 showed correlation with 20’C (128.7 ppm), with 19’C (142.35 ppm) and 18C (165.3 ppm), the last carbon atom not resolved; The signal at 165.3 ppm, also showed two more cross signal with NH at 10.71 ppm and NH’ at 10.48 ppm; 13C carbonyl carbon was observed at 165.0 with broaden and not resolved cross signal with H16, H16’, H15, H15’. Carbonyl carbon of ester aromatic end group was observed at 167.0.
Structural characterization of polyesteramide PNOBEE by NMR
The structure of PNOBEE, as designed in Figure 2b, has been characterized by: 1H-RMN, 13C-NMR, COSY, TOCSY, NOESY and HSQC, in DMSO-d6.
The complete assignment of the 1H and 13C-NMR chemical shifts for the monomeric unit and the end groups of PNOBEE, resolved in a similar way to that of PNOBDME, is summarized in Table 4, together with their theoretical values calculated by MestReNova [19,20]. Similar notations to those assigned to precursor cholesteric liquid crystal polyesters PTOBEE [4,8] have been used.
Table 4: 1H and 13C-NMR Chemical Shifts (ppm) observed and calculated for the repeating unit and aliphatic end group of chiral polyesteramide PNOBEE.
| Set of signal of systems ( ’ ) and (’’) |
Set of signals system without apostrophe ( ) |
Calculated chemical shifts |
| Atom |
1H(ppm) |
Ato |
13C(ppm) |
Atom |
1H(ppm) |
Atom |
13C(ppm) |
Atom |
Atom |
| |
DMSO |
|
DMSO |
|
DMSO |
|
DMSO |
1H |
13C |
| 12’H |
8.03 |
12’C |
129.2 |
12H |
8.14 |
12C |
128.4 |
8.18 |
127.6 |
| |
|
11’C |
129.4 |
|
|
11C |
131.6 |
|
137.6 |
| N’H’ |
10.48 |
10’C |
163.3 |
NH |
10.72 |
10C |
163.3 |
10.25 |
164.7 |
| |
|
9’C |
143.2 |
|
|
9C |
142.8 |
|
140.1 |
| 8’H |
7.99 |
8’C |
119.9 |
8H |
7.99 |
8C |
120.1 |
7.95 |
121.5 |
| 7’H |
7.98 |
7’C |
130.8 |
7H |
7.98 |
7C |
130.8 |
7.88 |
130.1 |
| |
|
6’C |
128.7 |
|
|
6C |
125.8 |
|
125.7 |
| |
|
5’C |
|
|
|
5C |
|
|
165.9 |
| Hc’ |
5.32 |
4’C |
73.0 |
Hc |
5.15 |
4C |
74.2 |
4.55 |
72.5 |
| Ha’,Hb’ |
4.55, 4.47 |
3’C |
|
Ha, Hb |
3.93, 3.87 |
3C |
46.5 |
4.80, 4.55 |
67.2 |
| Hd’ |
1.80 |
2’C |
24.0 |
Hd |
1.78 |
2C |
24.9 |
1.75 |
23.5 |
| He’ |
1.01 |
1’C |
10.0 |
He |
0.92 |
1C |
9.9 |
0.96 |
7.8 |
| Experimental signals aliphatic end group |
Theoretical Shifts End group ( ‘‘ ) |
| Hc’’ |
4.32 |
4’’C |
62.5 |
|
|
|
|
3.81 |
73.0 |
| Ha’’, Hb’’ |
4.47 * |
3’’C |
67.7 |
|
|
|
|
4.53, 4.28 |
70.5 |
| Hd’’, He’’ |
1.95, 1.76 |
2’’C |
27.9 |
|
|
|
|
1.48 |
26.8 |
| Hf’’ |
1.03* |
1’’C |
11.1 |
|
|
|
|
0.96 |
7.6 |
Overlapped signal
End group O-CH2-CH3: 4.28 ppm (1H-NMR) and 60.2 ppm (13C-NMR); CH3: 1.33 ppm (1H-NMR) and 14.4 ppm (13C-NMR)
In the 1H-RMN spectrum of PNOBEE, the two amidic protons NH and N´H´are observed as singlets at 10.48 ppm and 10.72 ppm, respectively. At 8.14 ppm and 8.03 ppm aromatic protons 12H and 12´H are identified, while 7H and 8H signal are broadly overlapped at 7.98 ppm, similarly to PNOBDME. The integral relation between signals at 8.14 ppm and 7.98 ppm is 1:3 instead of 1:2, since signal at 8.03 ppm is partially overlapped with signal at 7.98. The complete assigment of this signals was realized with other NMR experiments.
In the proton spacer zone, two multiplets observed at 5.32 ppm and 5.15 ppm, are assigned to protons Hc’ and Hc, respectively, within the monomeric unit, according to the terminology previously used for PNOBDME. A double doublet at 4.55 ppm is assigned to Ha’. A broad and overlapped signal centered at 4.50 ppm should correspond with overlapping of double doublet Hb’ and the double doublets Ha’’Hb’’ in the aliphatic end-group. A multiplet observed at 4.32 ppm is assigned to Hc’’of the aliphatic end group and cuadruplet at 4.28 ppm to CH2 of ethyl ester end group. Finally double doublet at 3.93 ppm and 3.87 ppm are assigned to Ha and Hb.
The observed aliphatic signals corresponding with the lateral side chain are: A multiplet at 1.89 ppm and a broaden overlapped signal at 1.78 ppm interpreted as Hd, totally assigned with the help of COSY and TOCSY experiments. Triplet at 1.33 ppm is assigned to methyl of ethyl ester end group. While triplets at 1,03, 1,01 and 0,92 corresponding to Hd were also assigned with COSY and TOCSY experiments to He’’, He’ and He, respectively.
In the COSY experiment, the expected correlation between 12H (8.14 ppm) and 8H (7.99 ppm) was overlapped and it was indistinguible. Signal Hc’ (5.32 ppm) shows correlation with Ha’ (4.55 ppm), with signal Hb’ (4.47 ppm) and with signal Hd’(1.80 ppm). Signal Hc (5.15 ppm) correlates with Ha (3.93 ppm), Hb (3.87 ppm) and with Hd (1.78 ppm). Signal corresponding to Hc’’(4.35 ppm) correlates with Hd’’ (1.95 ppm), with He’’ (1.76 ppm) and with Ha’’Hb’’ overlapped at (4.47 ppm). Signal at 4.28 ppm due to CH2 ethyl in ester end group shows correlation with triplet at 1.33 ppm due to CH3 in the same end group. Signal Hd’’ (1.95 ppm) and He’’ (1.76 ppm) show correlation with Hf’’ (1.03 ppm). In the TOCSY spectrum, of the aromatic zone correlation of amidic proton NH (10.72 ppm) with 12H (8.14 ppm) and 8H (7.99 ppm) is observed. Also between amidic proton N´H´ (10.48 ppm) and the overlapped signal of 12´H (8.03 ppm) and 8´H (7.99 ppm).
The signal Hc’(5.32 ppm) correlates with Hd’ (1.80 ppm) and He’ (1.01 ppm). The set of signals of aliphatic-OH end group was also resolved by the correlation of Hc’’ (4.35 ppm) with Ha’’ Hb’’ (4.47 ppm), with Hd’’ (1.95 ppm), with He’’ (1.76 ppm) and with Hf ’’ (1.03 ppm).
In the NOESY-2D experiment the same correlations as in TOCSY- 2D were observed, only correlation between Hc’ (5.35 ppm) with 7’H (7.98 ppm) and Hb’ (4.47 ppm) with 8’H (7.99 ppm). The correlations between Hc (5.15 ppm) and 8H and Ha and Hb with 7H were not observed. This could be indicative of a closer structure for system (‘) than for ( ) system.
After of proton assignment, carbon atoms bonded directly to hydrogens were identified by the HSQC experiment. 12’C (129.2 ppm) was related with 12’H (8.03 ppm), and 12C (128.4 ppm) with 12H (8.14 ppm); 8’C (119.9 ppm) and 8 C (120.1 ppm) with 8’H and 8H (7.98 ppm); 7C (130.8 ppm) is related with 7H (7.98 ppm); Hc’ (5.32 ppm) shows correlation with 4’C (73.0 ppm), while Hc (5.15 ppm) with 4C (74.2 ppm); Ha (3.93 ppm) and Hb (3.87 ppm) correlates with carbon 3C (46.5 pppm). 2C (24.9 ppm) is related with Hd (1.78 ppm) and 1C (9.9 ppm) with He (0.92 ppm); 1’C (10.0 ppm) with He’ (1.01 ppm). Signals due to OH-aliphatic end group: Hc’’ (4.32 ppm) is related with 4’’C (62.5 ppm); Ha’’Hb’’ (4.47 ppm) with 3’’C (67.7 ppm); Hd’’ (1.95 ppm) and He’’ (1.76 ppm) with 2’’C (27.9 ppm) and Hf ’’ (1.03 ppm) with 1’’C (11.1 ppm); signal due to ester ethyl group CH2 (4.28 ppm) with 13C (60.2 ppm) and CH3: 1H (1.33 ppm) with 1C (14.4 ppm).
Conformational analysis of PNOBDME and PNOBEE
By using a Karplus type equation [21], the vicinal coupling constants 3JHa-Hc and 3JHb-Hc can be related with the three possible staggered conformers of torsion φ along 11C-12C* bond in PNOBDME, and 3C-4C* in PNOBEE, in the polymer backbone, Figure 15, being m=9 for PNOBDME and m=1 for PNOBEE. In the system designed without apostrophe ( ), the coupling constants 3JHa-Hc (3.7 Hz) and 3JHb-Hc (6.0 Hz) indicate the preference for gt conformer.
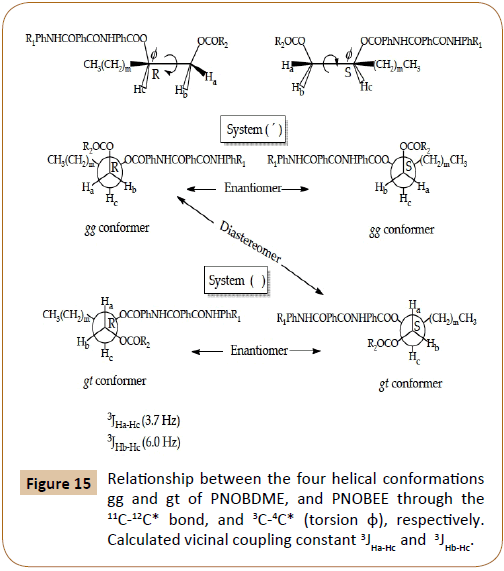
Figure 15: Relationship between the four helical conformations gg and gt of PNOBDME, and PNOBEE through the 11C-12C* bond, and 3C-4C* (torsion φ), respectively. Calculated vicinal coupling constant 3JHa-Hc and 3JHb-Hc.
In the system (‘), 3JHa’-Hc’ can not be measured accurately because the peak is not resolved but it is low enough to let us assure the preference of the gg conformer; 3JHb’-Hc’ can not be measured due to the overlapping of Hb’ signal with those of Ha’’ and Hb’’. The existence of these two independent conformers had also been observed for PTOBDME and PTOBEE and it was also related with the presence of helical structures, the Cotton effect and the sign of the helicity in 1-2 di-o-benzoylated sn-glycerols [22]. The combination of a helix with two screw senses and the two absolute configurations by the presence of the asymmetric carbon atom, provide four diastereomeric structures, two pair of enantiomers which would present two independent set of signals by NMR [23-25].
Thermal Behaviour
Thermal stability and differential scanning calorimetry of PNOBDME
The presence of amide groups within the mesogen of PNOBDME causes a 10% weight loss at 310°C in the thermal gravimetric curve, Figure 16a, increasing of thermal stability range of precursor polyester PTOBDME, with the same weight loss percentage at 280°C [3].
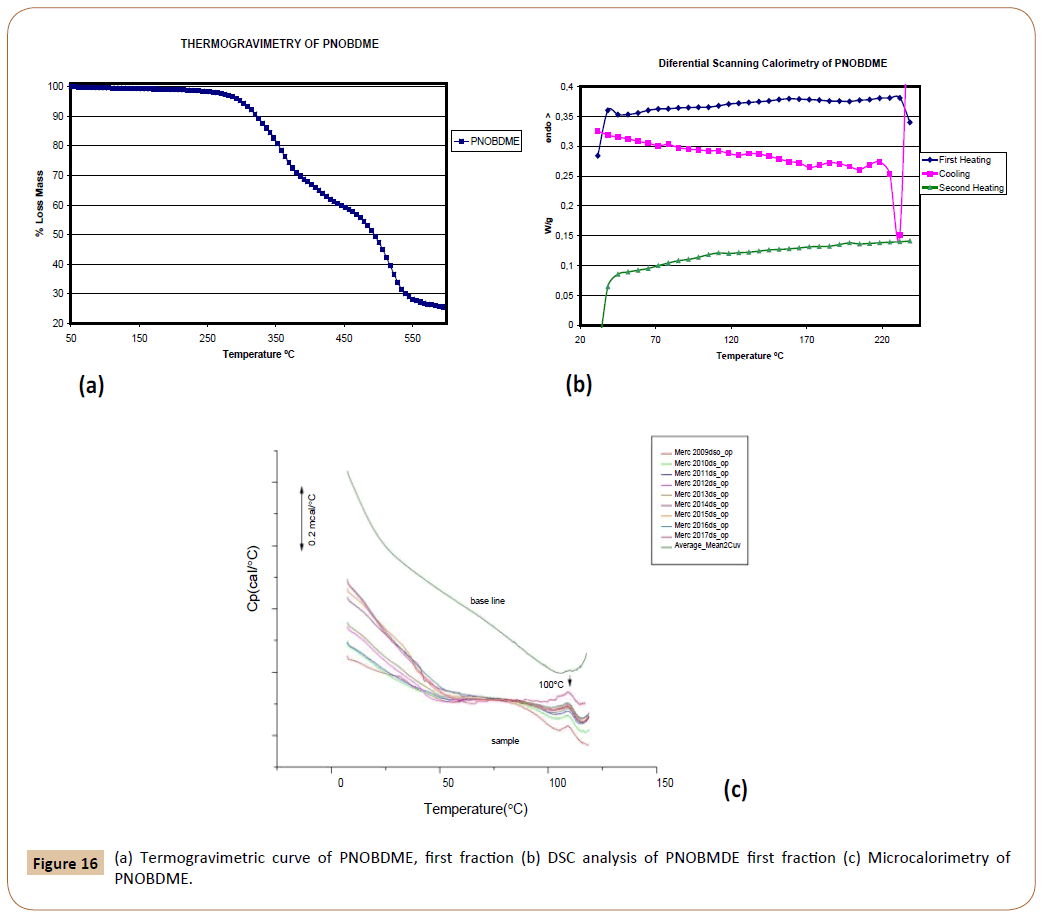
Figure 16: (a) Termogravimetric curve of PNOBDME, first fraction (b) DSC analysis of PNOBMDE first fraction (c) Microcalorimetry of PNOBDME.
The DSC experiment of PNOBDME, performed at 10°C/min rate, Figure 16b, shows in the first heating run a glass transition at 62.5°C together with a small broad endothermic peak centred at 155.7°C. During the cooling an exothermic peak at 183°C is indicative of crystallization from the mesophase state, higher value than that of PTOBDME (149°C). In the second heating glass transition is observed at 71.6°C, and two broad and small endothermic peaks at 108.7 and 188.3°C.
In a subsequent experiment PNOBDME was heated of up to 230°C at 10°C/min, cooled to 190°C and isothermally heated for 2 hours at this temperature, cooled to 30°C at 10°C/min, and finally heated again to 230°C, at 10°C/min. The isothermal treatment at 190°C after cooling from 230°C, should have produced an induced crystallization process, and an endothermic peak due to the polymer transition to mesophase should have been observed, however only a small endothermic peak at 109°C is observed not caused by the isothermal cooling. This endothermic transition at 109°C was also confirmed by Microcalorimetry (Figure 16c).
Thermal stability and differential scanning calorimetry of PNOBEE
PNOBEE thermal stability is given in Figure 17a. A 10% weight loss due to thermal decomposition is observed at 330°C, a higher temperature than that observed for PTOBEE at 280°C [4] and PNOBDME at 310°C. The substitution of the ester group in the mesogen by amide caused the increasing of thermal stability with respect to PTOBEE.
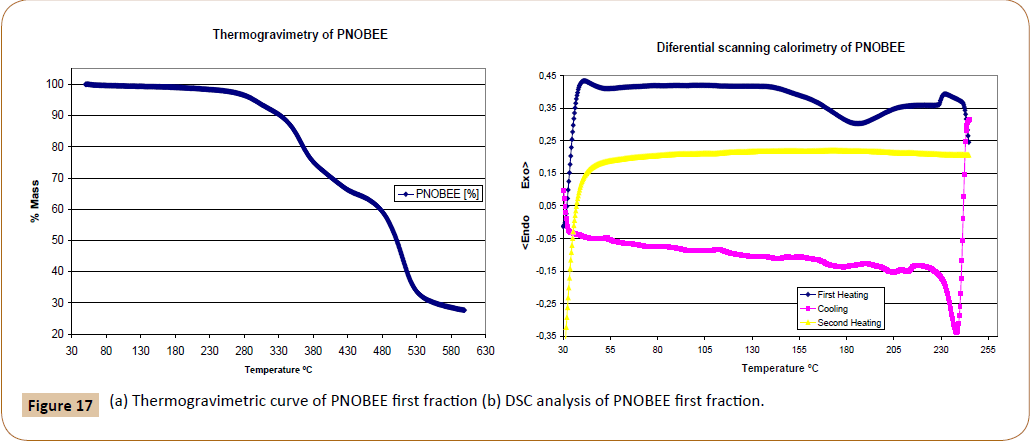
Figure 17: (a) Thermogravimetric curve of PNOBEE first fraction (b) DSC analysis of PNOBEE first fraction.
In the DSC experiment performed at 10°C/min rate, Figure 17b, a glass transition is observed during the first run, around 55°C, and very broad endothermic peak centred at 185,3°C interpreted as the fusion due to transition from crystal to liquid-crystal, another endothermic peak at 233,7°C is observed near the beginning of thermal decomposition; in the cooling run two small exothermic peaks appear at 205,6°C and 183,0°C due to crystallization processes from the mesophase state. In the second heating, no transition is observed. Compared with PTOBEE, with transition to mesophase at 149°C and with exothermic crystal formation at 110°C during isothermal heating, a remarkable difference is observed due to the substitution of ester by amide groups in the mesogen.
Optical Characterization
Optical characterization of PNOBDME
Although synthesized from starting racemic materials PNOBDME showed unexpected chirality. The first fraction of the polymer did not show a net optical activity but values changing from positive to negative, but the second fraction presented a low but constant value at 598 nm, +1.02°; at 579 nm, +1.65°; and at 435 nm, +2.9° and very high optical activity at 365 nm, +600° or +950° depending of temperature. This behaviour was also observed in PTOBDME and PTOBEE.
In Figure 18, Optical Rotatory Dispersion (ORD) values (α) of second fraction of PNOBDME are expressed as Molar Optical Rotation [Φ]=[α] M/100, being M the molecular weight of the polymer repeating unit, as function of time, at 365 nm, at two different temperatures: 25°C and 20°C.
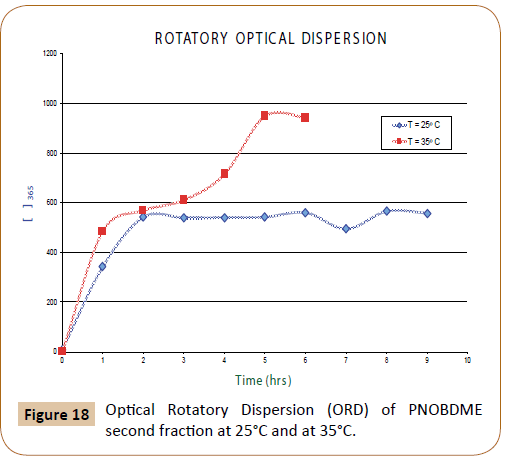
Figure 18: Optical Rotatory Dispersion (ORD) of PNOBDME second fraction at 25°C and at 35°C.
At 25°C three different slopes are observed, with an intermediate zone from 90 to 210 minutes with an ORD value approximately 600° and after 360 minutes it was stabilized in 950°. At 20°C, after 120 minutes the ORD reached a value of 600° that was maintained.
In both cases, once the ORD value was stabilized to 600° and 950° respectively, if the lamp wavelength was changed to 435 nm and quickly returned to 365 nm, the ORD value initially decreased to +8.6, and recovered its value. This phenomenon could be totally reversible. The variation of ORD with time has been described in helical polyguanidines synthesized starting from chiral monomers or starting achiral monomers with chiral catalysts [26-30].
Optical characterization of PNOBEE
At the end of this article the optical activity of PNOBEE has not been studied
Morphology
The morphology of powdered PNOBDME without any previous treatment has been studied by SEM. In Figure 19, four details are shown of the homogeneous spherical clusters of about 5 μm in diameter homogeneously dispersed.
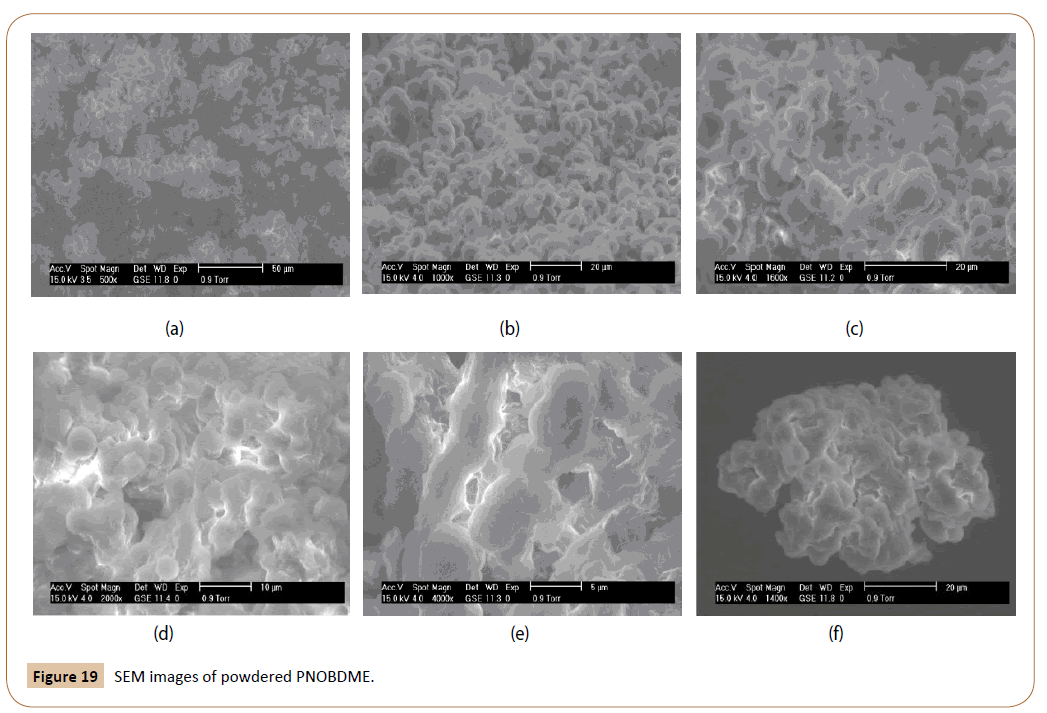
Figure 19: SEM images of powdered PNOBDME.
Conclusions
The synthetic methods of two new multifunctional cholesteric liquid crystal polyesteramides designed as: PNOBDME: (C34H38N2O6)n and PNOBEE (C26H22N2O6)n are reported and their characterization by 1H and 13C-NMR, COSY and HSQC, is stated and compared to their precursor polyesters PTOBDME and PTOBEE.
Molecular models of the new polymers show helical polymeric chains.
The NMR analysis, in agreement with the Molecular Mechanics models, let us to conclude that the enantiomeric polymer chains present stereo regular head-tail, isotactic structure, explained in terms of the higher reactivity of the primary hydroxyl with respect to the secondary one in the glycol through the polycondensation reaction.
According to our previous experience, each enantiomer, with two independent sets of signals observed by 1H and 13C-NMR, differentiated with apostrophe (´) and without it ( ), could be attributed to two diastereomeric conformers: gg and gt, related with two possible staggered conformations of the torsion along the chemical bond, containing the asymmetric carbon atom in the spacer, along the copolymer backbone, with two possible helical screw sense of the polymer chain, for all the studied polymers. Chirality in racemic precursor PTOBDME was proposed to be due to the kinetic resolution of a preferable helical diastereomer, such as Sgt, with respect to the possible four forms, while the R/S ratio of asymmetric carbon atoms remained 50:50.
The thermal behaviour of the synthetized liquid crystal polyesteramides, studied by TG and DSC analysis, show an endothermic peak assigned to the first order transition from crystalline phase to liquid crystal mesophase.
Optical ORD values are provided for polyestereamide PNOBDME. The unexpected chirality is evaluated. The first fraction of the polymer did not show a net optical activity but values changing from positive to negative, but the second fraction presented a low but constant value at 598 nm, +1.02°; at 579 nm, +1.65°; and at 435 nm, +2.9° and very high optical activity at 365 nm, +600° or +950° depending of temperature.
Morphology of powdered PNOBDME is reported by ESEM, showing the homogeneous spherical clusters of about 5 μm in diameter homogeneously dispersed.
The synthetic cholesteric liquid crystal polyestereamides described here are similar to new cationic cholesteric liquid crystal polymers also synthetized in our lab [31].
Acknowledgement
The author thanks CSIC for the financial support to the Project “Nuevos vectores no virales basados en polímero cristal-líquido colestérico (PCLC) y su uso para transfección génica”, PTR1995- 0760-OP de Estímulo a la Transferencia de Resultados de Investigación PETRI. The author thanks Dr. Javier Sanguino for his valuable help.
References
- Ringsdorf H, Schlarb B, Venzmer J (1988) Molecular architecture and function of polymeric oriented systems: models for the study of organization, surface recognition, and dynamics of biomembranes. Ang Chem Int Ed Engl 27: 113-158.
- Méndez MP, Otero JS (2015) Cholesteric Liquid-Crystal Copolyester, Poly [oxycarbonyl-1,4-phenylene-oxy-1,4 terephthaloyl-oxy-1,4-phenylene-carbonyloxy (1,2-dodecane)][C34H36O8]n, Synthesized from Racemic Materials: Kinetics, Structure and Optical Characterization. Int J Eng Res Ind Appl 5: 48-62.
- Fayos J, Sánchez-Cortés S, Marco C, Pérez-Méndez M (2001) Conformational analysis and molecular modeling of cholesteric liquid crystal polyesters based on XRD, Raman, and transition thermal analysis. J Macromol Sci B: Phys 40: 553-576.
- Pérez?Méndez M, Marco C (1997) New synthesis, thermal properties and textures of cholesteric poly [oxy(1,2?butene)oxycarbonyl?1,4?phenyleneoxycarbonyl?1,4?phenylenecarbonyloxy?1,4?phenylenecarbonyl], PTOBEE. Acta Polym 48: 502-506.
- Mendez MMP, Rocha CM (2000) U.S. Patent No. 6,165,382. Washington, DC: U.S. Patent and Trademark Office.
- Bilibin AY, Ten'Kovtsev AV, Piraner ON, Skorokhodov SS (1984) Synthesis of high-molecular weight liquid crystal polyesters based on a polycondensation mesogenic monomer. Polym Sci USSR 26: 2882-2890.
- Skorokhodov SS, Bilibin AY (1989) Rational path of the synthesis of liquid?crystalline high?molecular?weight polyesters and their properties in solution. Macromol Chem Macromol Symp 26: 9-23.
- Perez-Mendez M, Berenguel RM, Garrido L, Martín-Pastor M (2003) Self-association and stereoselectivity in a chiral liquid-crystal colesteric polymer formed under achiral conditions. Macromol 36: 8049-8055.
- Sánchez-Cortés S, Marsal-Berenguel R, Pérez-Méndez M (2004) Adsorption of a Cholesteric Liquid-crystal Polyester on Silver and Gold Nanoparticles and Films Studied by Surface-Enhanced Raman Scattering. Appl Spectrosc 58: 562-569.
- Pérez-Méndez M, Fayos J, Blanch GP, Cortés SS (2011) Biofunctionalization of cholesteric liquid-crystal helical polymers: Nanocarriers. Encycl Nanosci Nanotechnol 11: 547-580.
- Mendez MP, Hammouda B (2013) SAXS and SANS investigation of synthetic cholesteric liquid-crystal polymers for biomedical applications. J Mater Sci Eng 3: 104.
- Méndez MP, Daniel MR, Stephen MK (2014) pH-induced size changes in solutions of cholesteric liquid- crystal polymers studied by SANS. J Phys: Conf Ser 554: 11.
- Méndez MP, Martínez DR, Fayos J (2016) Structure of non-viral vectors based on cholesteric liquid-crystal polymers by SAXS. Int J Adv Eng Technol Manage Appl Sci 3: 27-41.
- Goodwin A (1997) Kevlar-Structure, Properties and Applications. Chem Aust 64: 9-11.
- https://gateway.discoverygate.com/CompLoc/secure/drilldown/top_fs.jsp
- Materials Studio Modeling (2018) BIOVIA Cambridge, UK Inc.
- Sek D, Wolinska A, Janeczek H (1986) Structure-liquid crystalline properties relationship of polyesteramides. J Polym Mater 3: 225-233.
- Goto K, Inoe Y (1996) Poly(amide-ester) and method for its production. Japan Synthetic Rubber Co Ltd, Japan.
- Cobas JC, Sardina FJ (2003) Nuclear magnetic resonance data processing. MestRe?C: A software package for desktop computers. Concepts Magn Reson, Part A 19: 80-96.
- https://resources.mestrelab.com.
- Haasnoot CAG, De Leeuw FA, Altona C (1980) The relationship between proton-proton NMR coupling constants and substituent electronegativities I: An empirical generalization of the Karplus equation. Tetrahedron 36: 2783-2792.
- Uzawa H, Nishida Y, Ohrui H, Meguro H (1990) Application of the dibenzoate chirality method to determine the absolute configuration of glycerols and related acyclic alcohols. J Org Chem 55: 116-122.
- Ute K, Hirose K, Kashimoto H, Hatada K, Vogl O (1991) Haloaldehyde polymers. 51. Helix-sense reversal of isotactic chloral oligomers in solution. J Am Chem Soc 113: 6305-6306.
- Ute K, Oka KI, Okamoto Y, Hatada K, Xi F, et al. (1991) Haloaldehyde polymers LIII. Optical resolution of purely isotactic oligomers of chloral: optical activity of the chloral oligomers assuming one-handed helical conformation in solution. Polym J 23: 1419.
- Ute K, Hirose K, Kashimoto H, Nakayama H, Hatada K, et al. (1993) Helix-inversion equilibrium of isotactic chloral oligomers in solution. Polym J 25: 1175.
- Schlitzer DS, Novak BM (1998) Trapped kinetic states, chiral amplification and molecular chaperoning in synthetic polymers: Chiral induction in polyguanidines through ion pair interactions. J Am Chem Soc 120: 2196-2197.
- Tang HZ, Lu Y, Tian G, Capracotta MD, Novak BM (2004) Stable Helical Polyguanidines: Poly {N-(1-anthryl)-N ‘-[(R)-and/or (S)-3,7-dimethyloctyl] guanidines}. J Am Chem Soc 126: 3722-3723.
- Tian G, Lu Y, Novak BM (2004) Helix-sense selective polymerization of carbodiimides: building permanently optically active polymers from achiral monomers. J Am Chem Soc 126: 4082-4083.
- Müller M, Zentel R (1996) Interplay of chiral side chains and helical main chains in polyisocyanates. Macromol 29: 1609-1617.
- Song S, Asher SA, Krimm S, Shaw KD (1991) Ultraviolet resonance Raman studies of trans and cis peptides: photochemical consequences of the twisted. pi.* excited state. J Am Chem Soc 113: 1155-1163.
- Méndez MP (2018) Synthetic Cationic Cholesteric Liquid Crystal Polymers. Liquid Crystals-Recent Advancements in Fundamental and Device Technologies. InTech, pp: 7-33