Ganga Raju Achary P1, Munisha B2, Singh Deo S2 and Parida KS2*
1Department of Chemistry, ITER, Siksha ‘O’ Anusandhan University, Bhubaneswar 751030, India
2Department of Physics, ITER, Siksha ‘O’ Anusandhan University, Bhubaneswar 751030, India
*Corresponding Author:
Parida KS
Department of Physics, ITER
Siksha ‘O’ Anusandhan University
Bhubaneswar, India
Tel: +9861406462
E-mail: santoshparida@soa.ac.in
Received Date: May 12, 2018; Accepted Date: May 24, 2018; Published Date: May 31, 2018
Citation: Achary PGR, Munisha B, Singh Deo S, Parida KS (2018) Study of Electrical Properties of Nickel Doped Polyurethane Nanocomposites. Polym Sci Vol.4 No.1:7
DOI: 10.4172/2471-9935.100035
Keywords
Polyurethane; Electrical properties; AC conductivity; Nanocomposites
Introduction
It is a big challenge for material researchers to synthesize nanoparticles and nanocomposites with desired configurations in view of subtending all physical properties. Peoples from different fields show a keen interest in making nanocomposites because of huge applications in all branches of science and technology. Polyurethanes (PUs) are unique polymer because of a wide range of physical and chemical properties. With well-coupled monomer materials, PUs can solve the demands of various applications in the different fields. Due to unique properties of polyurethanes, it has been observed that the extensive of use in leathers, foams and coatings industry, medical sciences, plastic industry, thermoplastic elastomers, etc. [1-6]. However, PUs also has some disadvantages, such as low thermal stability and low mechanical strength, etc. [7,8]. To avoid the low faults, material scientists have taken keen interest to manufacture nanocomposites because of its enhanced mechanical properties and industrial applications [9-12]. The research on organic-inorganic nanocomposites has been the center of attraction for material researchers in last few decades. The characteristic of the nanopolymers is completely different from the bulk during the study of electrical, mechanical, optical properties. There are various methods of fabrication of nanocomposites materials, but the synthesis of chemical route offers some advantages over other methods in terms of homogeneity, cheap, time consumption, overall energy saving. The novel nanocomposites can be used as biomaterials, self-cleaning materials and shape memory or smart materials.
The main objective of this paper is to measure the tangent loss factor, ac conductivity, impedance measurements of PU/Ni (25%) nanocomposites synthesized by chemical route. The encouraging results output has obtained, which can provide fundamental data for developing the usage of nickel through different electrical applications.
Experimental Section
The polyurethane polymer is synthesized from the polyethylene glycol (MW-300) and Isophorone diisocyanate. PU/Ni (25%) polymer nanocomposites were prepared by adding 25 weight percent of Ni nanoparticles into the pure polyurethane matrix. In the first step, 25 wt% of high pure nickel nanoparticles (99.99 N) doped in polyurethane as follows, 3 g of polyurethane was weighed and dissolved in a solvent methyl ethyl ketone (MEK) to make a solution and 0.15 g of highly pure nano-sized nickel powder was added. Then a light yellow color solution was formed and heated under vigorous stirring through a mechanical stirrer at 500 rpm at 70°C temperature for 30 minutes for the well homogeneous mixture. The solution was slowly evaporated until a gel was formed. Then the product was poured into Teflon Petridis and then dried at room temperature for 24 hours. Before making pellets, again Petridis was kept in the oven at 80°C for 3 hours for avoiding air bubble. The required dimension of the sample pellets was prepared and put in a sample holder for further characterization.
Results and Discussion
XRD pattern of PU/Ni nanocomposites recorded using CuKα radiation is shown in Figure 1. The nanocomposite synthesized sample exhibits trigonal structure using the PowderX [13] and the average crystallite size is 40 nm calculated using Scherer equation [14].
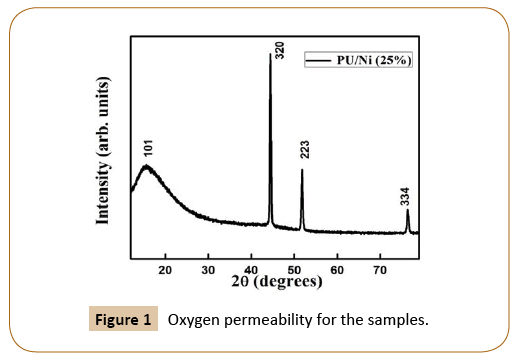
Figure 1: Oxygen permeability for the samples.
Figure 2 represents the change in dielectric constant (ɛr) with temperature of PU/Ni (25%) nanocomposites at 1 kHz, 10 kHz, 100 kHz, 500 kHz and 1000 kHz frequencies. As the temperature increases, there is no change in dielectric constant, but when frequency increases, the dielectric constant decreases. This implies that materials are good for energy storage devices in the high range of frequency.
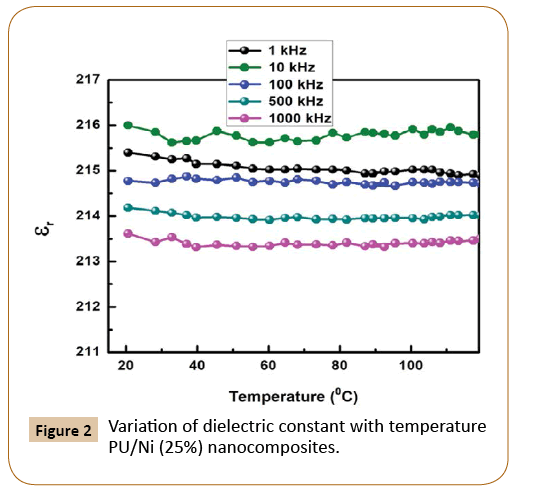
Figure 2: Variation of dielectric constant with temperature PU/Ni (25%) nanocomposites.
Figure 3 represents the variation of tan δ of PU/Ni (25%) nanocomposites with the temperature at 1 kHz, 10 kHz, 100 kHz, 500 kHz and 1000 kHz frequencies. It has been observed that value of tan δ decreases negligibly small with rise of temperature and but with frequency increase the tangent loss decrease. The possible reason of observed results could be assigned to the facts (i) energetic charge carriers (ii) intrinsic defect in the nanocomposites (iii) dominance of conductivity. On account of above-mentioned reasons, both tan δ and ɛr of the prepared material decrease with increase in frequency. This is the common type of behaviors of the ferroelectric materials.
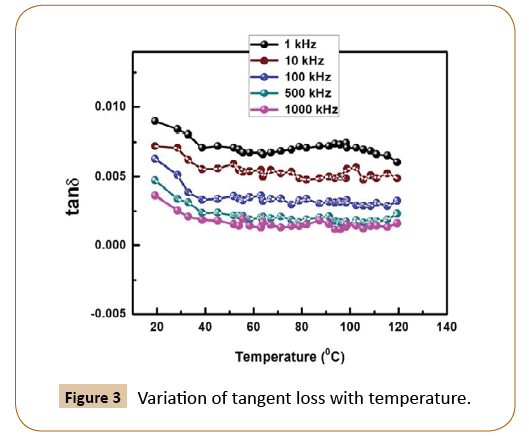
Figure 3: Variation of tangent loss with temperature.
Figure 4 represents ac conductivity of the PU/Ni (25%) nanocomposites with temperature at 1 kHz, 10 kHz, 100 kHz, 500 kHz and 1000 kHz frequencies. It is observed that the conductivity increases with increasing frequency and temperature as the presence of nickel as fillers in insulating polyurethane.
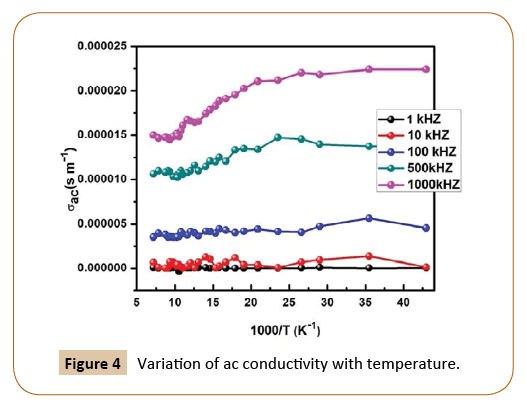
Figure 4: Variation of ac conductivity with temperature.
Figure 5 represents the real impendence (Z’) of the PU/Ni (25%) nanocomposites with frequency at 25°C, 54°C, 74°C, 84°C, 96°C 110°C and 125°C respectively whereas the change in the imaginary component of impedance (Z'') with the frequency of PU/Ni (25%) nanocomposites at same temperatures is shown in Figure 6. Similarly, the plot of Nyquist (Z' vs. Z'') of the nanocomposites is given in Figure 7. It has been observed that with the increase in temperature, both real and imaginary components of the impedance increase. The nature of the Nyquist plot is becoming less semi-circular with rising in temperature, which implies that the prepared material is less semiconducting in nature. The electron mobility could be the reason for the observed properties of the materials at low temperature. On the last, it may conclude that electron hopping and defects are the cause for the observed electrical conduction in the samples.
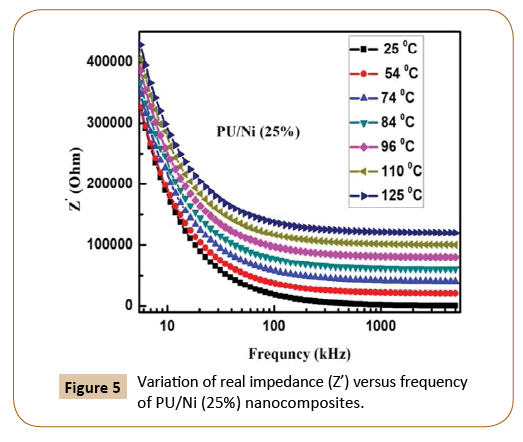
Figure 5: Variation of real impedance (Z’) versus frequency of PU/Ni (25%) nanocomposites.
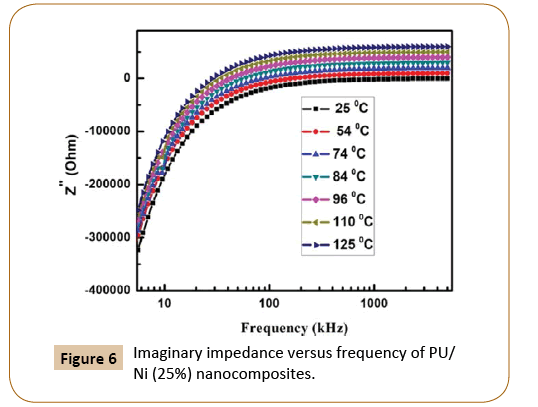
Figure 6: Imaginary impedance versus frequency of PU/ Ni (25%) nanocomposites.
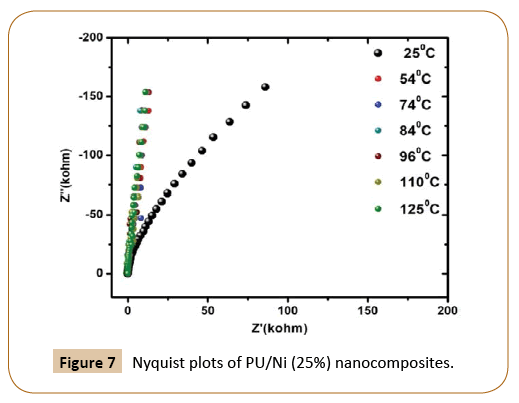
Figure 7: Nyquist plots of PU/Ni (25%) nanocomposites.
The semicircular curves in the plots explain the effect of bulk/ grain, grain boundaries in the resistive/capacitive data of the given material. An electrical equivalent circuit has been designed consists of resistive and capacitive components (R,C, Q) that can calibrate the above said electrical effects. A low-temperature circuit CQR and high-temperature circuit {(CQR) x (CR)} have are given in Figure 8 where C=A(jω)m-1 and Q=A(jω)n-1 are Jonscher’s universal components [15,16]. A ZSIMP WIN version 2 software package is used to model with the equivalent circuit. We know from the literature that in the Debye-type of relaxation, a semicircular arc is formed. The presence of perfect semicircular arc is the degree of accuracy of the preparation of the sample (less impurity phase).There is a method by which we can calculate the phase elements if the sample shows any deviation from Debye-type relaxation. This can be done by adding a constant phase element (CPE) with the parallel RC network. The electrical parameter Admittance (Y) of the constant phase element (CPE) can be written as YCPE=X0(jω)n=Mωm+jNωm, where M=X0Cos(nπ/2) and N=X0Sin(nπ/2) [16]. Where X0 and j are frequency independent quantities whereas depending on temperature, X0 is the measure of the dispersion, and possible value of m=1 for ideal capacitor and m=0 for ideal capacitor [17]. The electrical parameters like bulk resistance (Rb), grain boundary resistance (RGB), and frequency power calculated, after the model fitted at different temperatures indicates that PU/Ni nanocomposites have less semiconducting nature [16].
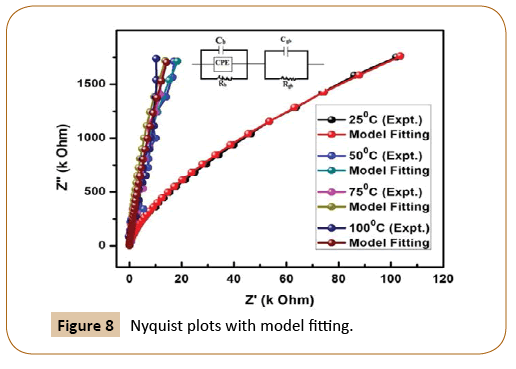
Figure 8: Nyquist plots with model fitting.
List of the fitted data of equivalent circuit (CQR) (CR): bulk (grain) and grain boundary resistance, capacitance boundary resistance and frequency power at 25°C, 50°C, 75°C, and 100°C are represented in Table 1. It is observed from the above table that the bulk resistance (Rb) decreases slowly from 5.594 × 10⁴ Ω at 25°C to 3.376 × 10⁴ Ω at 100°C demand less semiconducting nature of the material. The bulk capacitance (Cb) also decreases from 1.24 × 10⁻¹⁰ F/cm2 to 1.22 × 10⁻¹⁰ F/cm2 during the variation of temperature from at 25°C to 100°C support same results. The frequency power decreases from 5.23 at 25°C to 2.64 at 75°C and then increases to 3.88 at 100°C. The above calculated electrical parameters are suitable for application in the energy storage devices.
| Temp. |
Cb (F/cm2) |
Q (S-sec5/cm2) |
Rb (Ω-cm2) |
Cgb (F/cm2) |
Rgb (Ω-cm2) |
Frequency power (n) |
| 25°C |
8.519 × 10⁻¹⁰ (Expt.)
8.52 × 10⁻¹⁰ (fitting) |
6.554 × 10⁻¹⁰ (Expt.)
6.548 × 10⁻¹⁰ (fitting) |
5.594 × 10⁴ (Expt.)
5.573 × 10⁴ (fitting) |
1.24 × 10⁻¹⁰ (Expt.)
1.24 × 10⁻¹⁰ (fitting) |
7.794 × 10⁷ (expt.)
7.783 × 10⁷ (fitting) |
5.23 |
| 50°C |
8.905 × 10⁻¹⁰ (Expt.)
8.905× 10⁻¹⁰ (fitting) |
4.542 × 10⁻⁹ (Expt.)
4.540 × 10⁻⁸ (fitting) |
4.039 × 10⁴ (Expt.)
4.040 × 10⁴ (fitting) |
1.23 × 10⁻¹⁰ (Expt.)
1.23 × 10⁻¹⁰ (fitting) |
7.824 × 10⁷ (Expt.)
7.827 × 10⁷ (fitting) |
3.35 |
| 75°C |
8.889 × 10⁻¹⁰ (Expt.)
8.889 × 10⁻¹⁰ (fitting) |
4.611 × 10⁻⁷ (Expt.)
4.614 × 10⁻⁸ (fitting) |
3.463 × 10⁴ (Expt.)
3.463 × 10⁴ (fitting) |
1.222 × 10⁻¹⁰ (Expt.)
1.222 × 10⁻¹⁰ (fitting) |
8.516 × 10⁷ (expt.)
8.516 × 10⁷ (fitting) |
2.64 |
| 100°C |
8.242 × 10⁻¹⁰ (Expt.)
8.241 × 10⁻¹⁰ (fitting) |
3.345 × 10⁻⁶ (Expt.)
3.344 × 10⁻⁸ (fitting) |
3.376 × 10⁴ (Expt.)
3.374 × 10⁴ (fitting) |
1.224 × 10⁻¹⁰ (Expt.)
1.224 × 10⁻¹⁰ (fitting) |
7.889 × 10⁷ (Expt.)
7.891 × 10⁷ (fitting) |
3.88 |
Table 1: List of the fitted data of equivalent circuit (CQR) (CR): bulk (grain) and grain boundary resistance, capacitance boundary resistance and frequency power at 25°C, 50°C, 75°C and 100°C.
Figure 9 represents the change of real parts of the modulus (M') with the wide range of frequency in Ni-based nanocomposites at room temperature, whereas the variation of imaginary parts of modulus M'' with frequency is shown in Figure 10. As we know, conduction takes places when an external electric field is applied to the materials due to the mobility of the charge carriers. However, on increasing frequency, M' increases and but with increase in temperature, it decreases. The similar trend is observed in case of imaginary part of electrical modulus as M'' also decreases with the increase in temperature. Now, on account of the above observation, it may be concluded that Ni-based nanocomposites undergo thermally activated relaxation process due to hopping of charge carriers. The symmetrical nature of the modulus plots also justifies the Debye-type behavior in the material, The Cole-Cole like-plot of Ni-based nanocomposites is shown in Figure 11. The semicircular nature of the Z' versus Z'' (Cole-Cole plot) decreases with rising temperature, the good candidate for energy storage devices at low temperature.
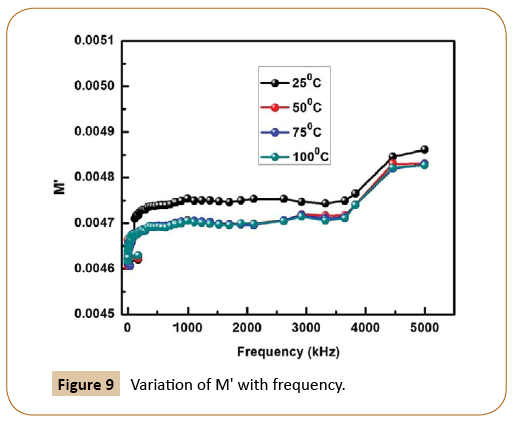
Figure 9: Variation of M' with frequency.
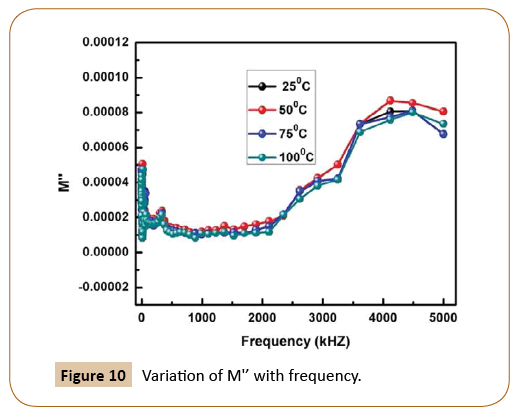
Figure 10: Variation of M'’ with frequency.
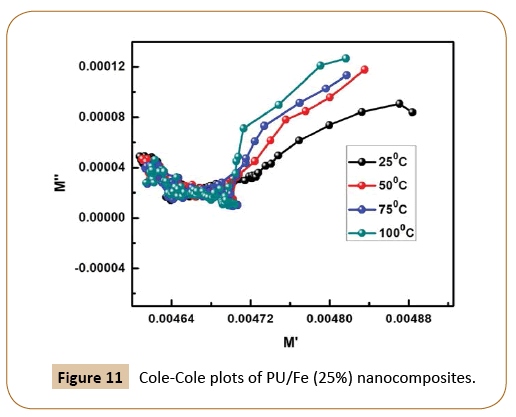
Figure 11: Cole-Cole plots of PU/Fe (25%) nanocomposites.
Conclusion
PU/Ni (25%) polymer nanocomposites were synthesized by adding 25 weight percent of high pure Ni nanoparticles in pure PU matrix. The XRD analysis shows that PU/Ni nanocomposites have prepared with trigonal structure. Studies of the effect of temperature on tangent loss, electrical modulus, ac conductivity and Nyquist plots in PU/Ni nanocomposites have been discussed. Due to the addition of nickel in the polymer forming nanoparticles has a dramatic change in electrical properties. It was observed that with the rise in temperature, PU/Ni nanocomposites show high ac conductivity, less tangent loss, high impedance and less semi-circular nature of Nyquist plot which are the characters of good materials for energy storage devices.
References
- Biercuk MJ, Llaguno MC, Radosavljevic M, Hyun JK, Johnson AT, et al. (2002) Carbon nanotube composites for thermal management. Appl Phys Lett 80: 2767-2769.
- Ounaies Z, Park C, Wise KE, Siochi EJ, Harrison JS (2003) Electrical properties of single wall carbon nanotube reinforced polyimide composites. Compos Sci Technol 63: 1637-1646.
- Weisenberger MC, Grulke EA, Jacques D, Rantell AT, Andrewsa R (2003) Enhanced mechanical properties of polyacrylonitrile/multiwall carbon nanotube composite fibers. J Nanosci Nanotechnol 3: 535-539.
- Dalton AB, Collins S, Munoz E, Razal JM, Ebron VH, et al. (2003) Super-tough carbon-nanotube fibres - These extraordinary composite fibres can be woven into electronic textiles. Nature 423: 703.
- Choa YH, Yang JK, Kim BH, Jeong YK, Lee JS, et al. (2003) Preparation and characterization of metal/ceramic nanoporous nanocomposite powders. J Magn Magn Mater 266: 12-19.
- Gangopadhyay R, De A (2000) Conducting polymer nanocomposites: A brief overview. Chem Mater 12: 608-622.
- Kumar R, Behera RK, Sen S (2015) Effect of Tempering Temperature and Time on Strength and Hardness of Ductile Cast Iron. IOP Conference Series: Materials Science and Engineerin. IOP Publishing 75: 012015.
- Rashidi AM, Moshrefi-Torbati M (2000) Effect of tempering conditions on the mechanical properties of ductile cast iron with dual matrix structure (DMS). Mater Lett 45: 203-207.
- Roy R, Roy RA, Roy DM (1986) Alternative perspectives on “quasi-crystallinity”: non-uniformity and nanocomposites. Mater Lett 4: 323-328.
- Gleter H (1992) Materials with ultrafine microstructures: Retrospectives and perspectives. Nanostruct Mater 1: 1-19.
- Kamigaito O (1991) What can be improved by nanometer composites? J Jpn Soc Powder Powder Metall 38: 315-321.
- Iijima S (1991) Helical microtubes of graphitic carbon. Nature 354: 56-58.
- https://www.ccp14.ac.uk/tutorial/powderx/
- Deceased BC, Stock SR (2001) Elements of X-ray Diffraction.
- Jonscher AK (1999) Dielectric relaxation in solids. J Phys D Appl Phys 32.
- Macdonald JR (1984) Note on the parameterization of the constant-phase admittance element. Solid State Ionics 13: 147-149.
- Ranjan R, Kumar R, Kumar N, Behera B, Choudhary RNP (2011) Impedance and electric modulus analysis of Sm-modified Pb (Zr0. 55Ti0. 45) 1−x/4O3 ceramics. J Alloys Compd 509: 6388-6394.