Keywords
Ebola virus disease; Public health; Guinea; Epidemiology; Vaccination; Social behaviour
Introduction
An area of public health which is concerned with study of the distribution and the determinants of disease frequency is referred to as epidemiology [1]. Ebola virus disease is an epidemic that can spread into a population causing severe loss of human life if not contained. Ebola disease was first reported in Democratic Republic of Congo in 1976. It disappears and reappeared in 1989 [2]. Environmental, cultural, behavioural and physiological factors in Africa allows for the spread of a disease within the population [3]. Most of the African cities are densely populated, thereby making easy transmission of a pathogen. Belief, customs and traditional practices are some of the reasons the virus is spread within the populace in some affected West African countries [4]. Presently, the most affected countries within the region can be categorized into those with intense transmission like Guinea, Liberia and Sierra Leone and those who had an initial case of the disease like, Mali, Nigeria, Senegal, Spain and the United States of America [5]. The focus of this study will be on countries with intense transmission. The outbreak starts from a 2-year old child in Guinea around February of 2014. The disease was spread to the family and out into the population [6]. The country has witnessed the total of 2,167 confirmed case incidence and 1,327 deaths from March to December 2014 [5]. The virus was spread to the neighbouring Sierra Leone in May 2014 with recent report showing 7,312 reported confirmed cases and 1,583 deaths. Liberia who also shares a border with Sierra Leone and Guinea have recorded the first case of Ebola in March of 2014 with total recorded confirmed of about 7,635 cases and 3,145 deaths [5].
Modelling and simulation is one of the methods used to understand a real-world phenomenon like an epidemic outbreak [7]. It helps in analysis of complex systems which can be expensive or difficult to reproduce [8]. Real data from an epidemic can be modelled and to get good insight on a particular situation. The confirmed Ebola cases data for Guinea, Liberia and Sierra Leone which are shown in Figures 1-3 are based on official information reported by ministries of health, through WHO country offices.
Figure 1: Confirmed Ebola virus disease cases reported each week from Guinea.
Figure 2: Confirmed Ebola virus disease cases reported each week from Liberia.
Figure 3: Confirmed Ebola virus disease cases reported each week from Sierra Leone.
The bar charts above are adapted from World Health Organization (WHO) Ebola situation report [5]. They are plotted from both the confirmed weekly situation report data and confirmed data from patient database of these countries. The dark blue bars shows the new and confirmed weekly Ebola cases from situation report while the light blue bars represents that from the patient database of Guinea, Sierra Leone and Liberia.
Methods
The models used for this study are based on the SIRS (Susceptible, Infected, Recovered and Susceptible) model and global stochastic contact model of cellular automata. The parameters were established using the information collected from [9,10]. The SIRS model is an extension of the SIR model. It is a model used in epidemiology [11,12]. This study uses Ordinary Differential Equations (ODE) and computational model using a cellular automaton to solve the SIRS model. The SIRS model can be represented with ordinary differential equation (ODE):
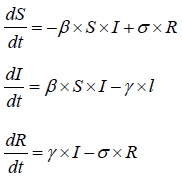
In the above SIRS model the S represents the number of people susceptible or yet to be infected with the disease. I represent the number of people infected and R represents the number of people recovered from the disease. In their paper [12], divide the equation into susceptible equation and recovered equation. The susceptible equation:
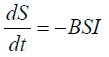
Represent the instantaneous rate of change in number of people that are susceptible when there is an outbreak. Hence, the susceptible population keeps falling. That is becomes negative. Whereas the recovered equation:

Shows the instantaneous change in the number of people that recover from the disease. This is positive because the number of people that recovered will leads to population growth.
The σ symbol in the (ODE) represent the recovered period while the β represent the transmission probability and γ represent the infectious period. The SIRS model presents great opportunity to study infectious disease like Ebola. This study implements cellular automata to simulate the SIRS model.
A cellular automaton is a mathematical discrete model created by John von Neumann and Stanislaw Ulam. It is represented as a grid where each grid represent a cell and as a part of population of cells that switch states based on the state of the neighbouring cell [7]. Computer scientists have come up with interesting results with regards to cellular automata, among which are a number of ground breaking new discoveries [13]. This study uses the global stochastic contact model which is a type of definition of neighbourhood in cellular automata [14]. The interaction between cells in this model is likened to the interaction between people in a homogeneous population. This means that each person has the same likelihood to be contacted by any other person without any constraint. Various researchers have used cellular automation to model epidemic spread [8,15]. However, they failed to include a control measure which is in form of vaccination as a parameter within the model. This can provide understanding on the impact the vaccination can have on the population at some given period of time [8]. Proposed dynamic cellular automaton that reduces computing time in modelling the spread of disease in a patchy population. The study indicates that an epidemic can be contained before it becomes a pandemic by blocking the pathways where the chance of infection spread due to human movement. But it is natural for people within a population to move without any restriction. Therefore restricting movement is somewhat impossible [16]. Proposed a computational model based on cellular automata that include the relevant features like contact rate, social behaviour and spatial distribution which have a major role in epidemic spread process [17]. Have simulated epidemic disease spread using two- dimensional cellular automata. Similarly, White et al. [18] proposed a model based on cellular automata for understanding epidemic spread. Although the study considers the effect of vaccination on the population, the model is not based on real parameters.
In this study, the SIRS model parameters, such as average contact between the infected and susceptible is set to 1 because it only takes a contact with 1 infected person for the disease to be contracted [19]. The recovery period (σ) is set to 21 days given the number of days taken for the two American survivors to be cured with the experimental drug (ZMAPP) treatment [10,20,21]. The incubation period for the disease is 2-21 days [22] from which time the symptoms can appear. This is known as the infectious period (γ). The average infectious period is set to 8 given that the short life expectancy of the Ebola patient is 8 days [9]. The transmission probability (γ) is set to 0.44 because study on Ebola data shows a 44% chance of contracting the disease [9].
The cellular automaton was implemented in python programming language to simulate the SIRS model. The simulation was done on a Windows PC machine with Intel Core i5 processor and 8 GB of RAM. The statistics of each step that comprises of the susceptible infected and the recovered are shown in results and discussion section in Table 1 and Figure 4.
| Step |
Susceptible |
Infected |
Recovered |
| 1 |
224 |
1 |
0 |
| 3 |
218 |
7 |
0 |
| 6 |
159 |
66 |
0 |
| 9 |
28 |
197 |
0 |
| 12 |
2 |
210 |
13 |
| 14 |
0 |
164 |
61 |
| 32 |
1 |
0 |
224 |
| 35 |
29 |
0 |
196 |
| 38 |
156 |
0 |
69 |
| 41 |
217 |
0 |
8 |
| 44 |
255 |
0 |
0 |
Table 1: Statistics from different steps of simulation.
Figure 4: Graphs showing the transition rate between the three populations.
Results and Discussion
The common way to control an epidemic is through vaccination. The effect of vaccination during the time of an epidemic outbreak should be seen in form of drastic decrease in the number of confirmed cases and increase in the susceptible population.
Hence, the infected population will have less contact with susceptible population, thereby reducing the transmission rate of the disease. Table 1 shows the three populations throughout the time until the epidemic is eradicated and all the cells come back to susceptible.
Table 1 shows the statistics of various steps in the simulation. This is in the form of susceptible population, infected population and recovered population. The progression of the outbreak can be observed in steps 3, 6, 9, 12 and 14 as reflected in the infected population. This results in decrease of susceptible population. From that point, there were no infected individuals and the susceptible number of individuals increases. The recovery starts from step 12 down to steps 14, 32, 35, 38 and 41 before it reached a stage were all the infected population has recovered.
The graph in Figure 4 reflects the statistics in Table 1. The curve for susceptible population was initially high given only an individual is infected before it slopes downward when the number of infected individuals increases. The experimental drug effect gradually reduces the infected population until the susceptible population rise and becomes back to normal.
Conclusion
The use of SIRS (Susceptible, Infected, Recovered and Susceptible) model and cellular automata model (global stochastic contact model) with some real parameters like average contact, recovery period, infectious period and transmission probability to simulate the transmission and recovery from Ebola epidemic using an experimental drug has led to understanding the impact the drug will have on a population and the period it will take to contain the epidemic. As of the time of this study, only small dose of the drug arrived West Africa because, the drug is still in experimental stage. Simulation like this can be used to predict the effect the drug will have within a time period. This can assist authorities in understanding the likely outcome of a vaccination and therefore in making decision on distribution of vaccine to designated areas.
References
- Rothman KJ (2012) Epidemiology: an introduction (2nd edn.). Oxford University Press, NY, USA.
- https://palliserlibrary.ca/spm/search/item/102632
- Timmreck (2002) An introduction to epidemiology. In: Timmreck Thomas C (ed.) Jones & Bartlett.
- https://www.who.int/csr/disease/ebola/ebola-6-months/sierra-leone/en/
- https://www.who.int/csr/disease/ebola/situation-reports/en/
- https://www.cnn.com/interactive/2014/12/world/ebola/
- Cuesta H (2013) Practical data analysis. Packt Publishing, Birmingham, UK.
- Athithan S, Shukla VP, Biradar SR (2014) Dynamic cellular automata based epidemic spread model for population in patches with movement. J Comput Environ Sci 2014: 8.
- https://www.thecommonsenseshow.com/2014/10/26/ebola-data-suggests-that-you-have-a-44-chance-of-contracting-the-virus/
- Lyon GM, Mehta AK, Varkey JB, Brantly K, Plyler L, et al. (2014) Clinical care of two patients with ebola virus disease in the United States. N Engl J Med 371: 2402-2409.
- Stuart-Harris CH (1977) Viral infections of humans - epidemiology and control. Proc R Soc Med 70: 748.
- Kermack WO, McKendrick AG (1991) Contributions to the mathematical theory of epidemics-I. 1927. Bull Math Biol 53: 33-55.
- Wolfram S (2002) A new kind of science (1st edn.). Champaign, IL: Wolfram Media.
- Chen D, Moulin B, Wu J (2014) Analyzing and modeling spatial and temporal dynamics of infectious diseases. John Wiley & Sons, USA.
- https://www.dpi.inpe.br/gilberto/cursos/st-society-2013/White2007.pdf
- López L, Burguerner G, Giovanini L (2014) Addressing population heterogeneity and distribution in epidemics models using a cellular automata approach. BMC Res Notes 7: 234.
- Del Rey AM, White SH, Sánchez GR (2006) A model based on cellular automata to simulate epidemic diseases. In: Yacoubi SE, Chopard B, Bandini S (eds.) Cellular Automata. Springer Berlin Heidelberg pp: 304-310.
- White SH, Del Rey AM, Sánchez GR (2007) Modeling epidemics using cellular automata. Appl Math Comput 186: 193-202.
- Groseth A, Feldmann H, Strong JE (2007) The ecology of Ebola virus. Trends Microbiol 15: 408-416.
- Jones S (2014) Ebola pandemic: current facts for preparing & surviving the outbreak. Steve Jones, p: 22.
- Alton J (2014) The Ebola survival handbook: An MD tells you what you need to know now to stay safe (1st edn.). Skyhorse Publishing.
- https://www.who.int/mediacentre/factsheets/fs103/en/