Keywords
Biomarkers; Diabetic retinopathy; Ophthalmic artery; Central retinal artery; Optical coherence tomography; Resistive index; Retinal nerve fiber layer
Abbreviations
SD-OCT: Spectral Domain Optical Coherence Tomography; RNFL: Retinal Nerve Fiber Layer; CST: Central Subfield Thickness; CAT: Cube Average Thickness; RI: Resistive Index; PSV: Peak Systolic Velocity; EDV: End Diastolic Velocity; DR: Diabetic Retinopathy; EZ: Ellipsoid Zone; OA: Ophthalmic Artery; CRA: Central Retinal Artery; DCP: Deep Capillary Plexus.
Introduction
Diabetic Retinopathy (DR), a leading cause of morbidity and disability, is a sight-threatening microvascular complication of diabetes. The prevalence of DR varies from 28.8% in people with diabetes for <5 years to 77.8% in people with diabetes for 15 or more years [1].
The four outermost layers of the retina: Retinal Pigment Epithelium (RPE), layer of rods and cones, External Limiting Membrane (ELM), outer nuclear layer are supplied by the Short Posterior Ciliary Arteries (SPCA). The six inner layers are supplied by Central Retinal Artery (CRA). Both the CRA and SPCA are branches of the Ophthalmic Artery (OA) [2].
Spectral-Domain Optical Coherence Tomography (SD-OCT) is a noninvasive reliable imaging tool for in vivo cross-sectional retinal histology [3]. The second outermost band initially recognized as Inner Segment-Outer Segment junction (IS-OS) of photoreceptor in SD-OCT represents the mitochondria-rich Ellipsoid Zone (EZ) of the photoreceptors [4]. EZ disruption based on OCT of macula has been shown to be correlated significantly with severity of DR and decreased visual acuity [5].
Color Doppler and gray scale sonography imaging is a noninvasive imaging technique that enables measurement of direction and velocity of blood flow in the vessels. The peak systolic (PSV), enddiastolic (EDV), and mean blood flow velocities over the cardiac cycle are calculated by a built-in software. Resistive Index (RI) computed by PSV and EDV reflects vascular resistance peripheral to the measuring location [6].
Our study evaluates the association of RI of OA and CRA with severity of DR including those with proliferative retinopathy.
Methods
The study was conducted in a tertiary care center (King George’s Medical University, Lucknow, India) after approval from the institutional review board according to the tenets of the Declaration of Helsinki. An informed voluntary consent was obtained from all the study subjects. Sample size was calculated using 95% confidence interval.
Sixty-nine consecutive subjects with type 2 diabetes mellitus in the retina clinic and 22 healthy control subjects in the ophthalmology outpatient clinic between age 40 years and 70 years were included. The subjects were divided into three groups according to Early Treatment Diabetic Retinopathy Study (ETDRS) classification [7,8]: diabetes mellitus with no retinopathy (No DR) (n=22); Non-Proliferative Diabetic Retinopathy (NPDR) (n=25); and Proliferative Diabetic Retinopathy (PDR) (n=22). Healthy control subjects with no diabetes mellitus were also studied (n=22).
Best Corrected Visual Acuity (BCVA) was measured on the logarithm of the minimum angle of resolution (logMAR) scale. All of the study subjects underwent stereoscopic fundus evaluation using slitlamp biomicroscopy and indirect ophthalmoscopy. Fundus fluorescein angiography was performed for all study subjects. Exclusion criteria were history of other ocular or systemic diseases affecting the retinal vascular pathology, history of any previous intravitreal injection(s), history of ophthalmic surgical or laser intervention, history of taking vitamin supplements, antioxidants, any medications causing change in blood flow (calcium channel blockers, pentoxifylline, statins, antiplatelet agents, anticoagulants) and signal strength of less than 5 on OCT due to media haze.
Blood was drawn to investigate the effect of serum constituents that might influence vascular resistance. Serum urea was measured by kinetic enzymatic method with urease and glutamate dehydrogenase. Serum creatinine was measured by modified Jaffe method without deproteinization. Glycated hemoglobin was measured on auto analyzer using standard protocol.
Macular thickness analysis was performed using the macular cube scan feature of spectral domain optical coherence tomography (Cirrus High Definition OCT; Carl Zeiss MeditecInc, Dublin, CA, U.S.A). Diabetic macular edema was assessed in terms of Central Subfield Thickness (CST) and Cube Average Thickness (CAT) [9]. CST was defined as the retinal thickness of the central 1-mmdiameter circle of the ETDRS grid. Cube Average Thickness (CAT) was defined as an overall average thickness for the internal limiting membrane-retinal pigment epithelium tissue layer over the entire 6 x 6 mm square scanned area. Retinal nerve fiber layer thickness was also measured. On horizontal and vertical SD-OCT scans, retinal photoreceptor EZ disruption was graded into three categories including Grade 0: Intact photoreceptor ellipsoid zone, Grade 1: Focal disruption (photoreceptor EZ disruption indicating subfoveal localized involvement), and Grade 2: Global disruption (photoreceptor EZ disruption indicating generalized involvement within the macular cube) [5].
Blood flow within the CRA and OA was measured using color doppler and gray scale sonography imaging (Philips Affiniti 70G Ultrasound System, Vista, CA, USA). Vascular resistance against blood flow was calculated employingthe following formula: RI= (PSV-EDV)/PSV where, RI is resistance index, PSV is peak systolic velocity, and EDV is end-diastolic velocity.
Statistics
Data were expressed as mean ± standard error of the mean (SE). Interobserver correlation for EZ disruption was computed using Spearman rank correlation. Groups were compared by one-way analysis of variance (ANOVA). The significance of mean difference between the groups was done by Newman-Keuls test after ascertaining normality by Shapiro-Wilk’s test and homogeneity of variance between groups by Levene’s test. Categorical (discrete) groups were compared by chi-square (χ2) test. Pearson correlation analysis was done to assess association between the study variables. Diagnostic accuracy (sensitivity and specificity) of RI of OA and CRA was assessed using receiver operating characteristics (ROC) curve analysis. Independent predictor(s) for severity of diabetic retinopathy was assessed by using univariate and multivariate ordinal logistic regression analysis. A two-tailed (α=2) p<0.05 was considered statistically significant. Analyses were performed on SPSS software (Windows version 17.0).
Results
Table 1 summarizes the results of ANOVA of biochemical and bio imaging parameters. The difference in age among the study groups (F=1.66, P=0.183) was not statistically significant. Chi square test showed similar sex proportions among the study groups (χ2=2.05, P=0.562). However, ANOVA showed significant difference in logMAR BCVA (F=105.76, p<0.001). HbA1C levels (F=55.85, P<0.001), serum urea (F=4.25, P=0.008) and creatinine (F=46.37, P=0.008) among the study groups. SD-OCT based bio imaging parameters, CST, CAT, and RNFL thickness were analyzed in the study groups. ANOVA revealed significant difference in CST (F=37.11, P<0.001), CAT (F=50.69, P<0.001) and RNFL thickness (F=61.11, P<0.001). Interobserver correlation for EZ disruption was observed to be r=0.78 (P=0.001). Chi square test revealed significant increase in grades of EZ disruption with the severity of diabetic retinopathy (χ2=60.60, p<0.001).
| Variables |
Controls
(n=22) (%) |
NO DR
(n=22) (%) |
NPDR
(n=25) (%) |
PDR
(n=22) (%) |
F/χ2 Value |
p value |
| Age (yrs) |
60.23 ± 1.34 |
58.68 ± 1.54 |
58.28 ± 2.32 |
63.41 ± 1.99 |
1.53 |
0.213 |
Sex:
Female
Male |
8 (36.4)
14 (63.6) |
9 (40.9)
13 (59.1) |
7 (28.0)
18 (72.0) |
5 (22.7)
17 (77.3) |
2.05 |
0.562 |
| HbA1c (%) |
5.35 ± 0.11 |
7.91 ± 0.19 |
8.42 ± 0.28 |
8.88 ± 0.18 |
55.85 |
<0.001 |
| S. urea (mg/dl) |
33.26 ± 0.88 |
38.03 ± 2.12 |
37.96 ± 0.99 |
39.89 ± 1.13 |
4.25 |
0.008 |
| S. creatinine (mg/dl) |
0.96 ± 0.02 |
1.12 ± 0.03 |
1.11 ± 0.03 |
1.61 ± 0.07 |
46.37 |
<0.001 |
| BCVA (LogMAR) |
0.09 ± 0.02 |
0.34 ± 0.14 |
0.72 ± 0.07 |
1.18 ± 0.02 |
105.76 |
<0.001 |
| CST (μm) |
247.91 ± 2.62 |
251.73 ± 4.37 |
304.72 ± 22.52 |
455.91 ± 19.36 |
37.11 |
<0.001 |
| CAT (μm) |
255.64 ± 1.08 |
273.41 ± 7.57 |
301.04 ± 9.37 |
371.27 ± 6.23 |
50.69 |
<0.001 |
| RNFL (μm) |
89.36 ± 0.33 |
85.59 ± 0.89 |
86.04 ± 0.92 |
72.32 ± 1.37 |
61.11 |
<0.001 |
EZ:
Disruption absent
Disruption present |
22 (100.0)
0 (0.0) |
21 (95.5)
1 (4.5) |
14 (56.0)
11 (44.0) |
0 (0.0)
22 (100.0) |
60.6 |
<0.001 |
| RI-OA |
0.61 ± 0.01 |
0.79 ± 0.01 |
0.81 ± 0.02 |
1.02 ± 0.09 |
14.24 |
<0.001 |
| RI-CRA |
0.64 ± 0.01 |
0.77 ± 0.01 |
0.75 ± 0.02 |
0.99 ± 0.09 |
10.2 |
<0.001 |
NO DR=No diabetic retinopathy; NPDR=Non proliferative diabetic retinopathy; PDR=Proliferative diabetic retinopathy; BCVA=Best corrected visual acuity; HBA1c=Glycosylated haemoglobin; CST=Central subfield thickness; CAT=Cube average thickness; RNFL=Retinal nerve fiber layer; EZ=Ellipsoid zone; RI-OA=Resistive index of ophthalmic artery; RI-CRA=Resistive index of central retinal artery.
Table 1: Results of analysis of variance for biochemical and bioimaging parameters of the study groups.
Color doppler-based vascular resistive index were analyzed in OA and CRA. ANOVA revealed a significant increase in RI of OA (F=14.24, P<0.001) and CRA (F=10.20, P<0.001) with increased severity of diabetic retinopathy.
The univariate ordinal logistic regression analysis found HbA1c, serum urea, serum creatinine, BCVA, CST, CAT, RNFL thinning, EZ disruption, and RI of OA and CRA, as significant predictors of severity of diabetic retinopathy (p<0.01).
In multivariate analysis, RI of OA further showed a significant association with the severity of diabetic retinopathy (OR=0.00, P=0.001) suggesting that RI of OA serves as a significant and an independent predictor of severity of diabetic retinopathy. However on multivariate regression analysis, RI of CRA did not show a significant association with the severity of DR (p=0.868) (Table 2).
| Predictors |
Univariate analysis |
Multivariate analysis |
| OR (95% CI) |
p value |
OR (95% CI) |
p value |
| Age |
0.98 (0.94-1.02) |
0.323 |
1.01 (0.91-1.13) |
0.831 |
Sex:
Female
Male |
Ref
0.61 (0.28-1.36) |
0.226 |
Ref
2.74 (0.44-17.19) |
0.282 |
| HbA1c |
0.29 (0.20-0.42) |
<0.001 |
0.47 (0.17-1.31) |
0.15 |
| S. urea |
0.91 (0.86-0.97) |
0.004 |
1.17 (1.01-1.36) |
0.038 |
| S. creatinine |
0.00 (0.00-0.00) |
<0.001 |
0.58 (0.00-128.07) |
0.843 |
| BCVA |
0.00 (0.00-0.00) |
<0.001 |
0.14 (0.00-51.35) |
0.512 |
| CST |
0.98 (0.98-0.99) |
<0.001 |
1.00 (0.99-1.01) |
0.889 |
| CAT |
0.94 (0.93-0.96) |
<0.001 |
1.02 (0.98-1.07) |
0.363 |
| RNFL |
1.46 (1.30-1.63) |
<0.001 |
1.06 (0.87-1.29) |
0.541 |
EZ:
Disruption absent
Disruption present |
Ref
0.00 (0.00-0.04) |
<0.001 |
Ref
0.14 (0.00-27.87) |
0.468 |
| RI-OA |
0.00 (0.00-0.00) |
<0.001 |
0.00 (0.00-0.00) |
0.001 |
| RI-CRA |
0.00 (0.00-0.00) |
<0.001 |
1.94 (0.00-5055.96) |
0.868 |
OR=Odds ratio; CI=Confidence interval; NO DR=No diabetic retinopathy; NPDR=Non proliferative diabetic retinopathy; PDR=Proliferative diabetic retinopathy; BCVA=Best corrected visual acuity; HBA1c=Glycosylated haemoglobin; CST=Central subfield thickness
CAT=Cube average thickness; RNFL=Retinal nerve fiber layer; EZ=Ellipsoid zone; RI-OA=Resistive index of ophthalmic artery; RI-CRA=Resistive index of central retinal artery.
Table 2: Identification of independent predictors of severity of diabetic retinopathy using univariate and multivariate ordinal logistic regression analysis (n=91).
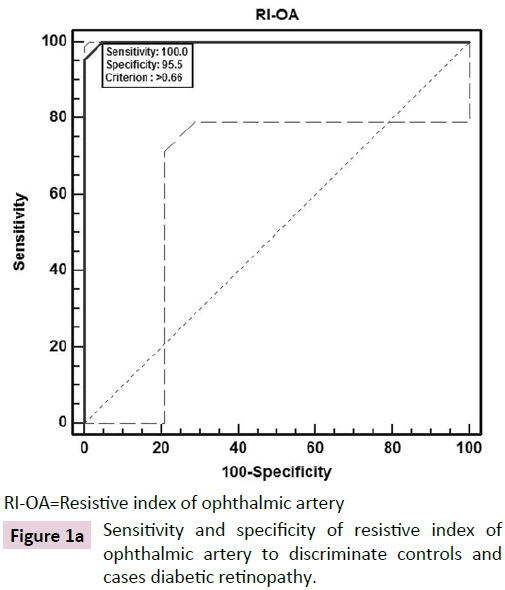
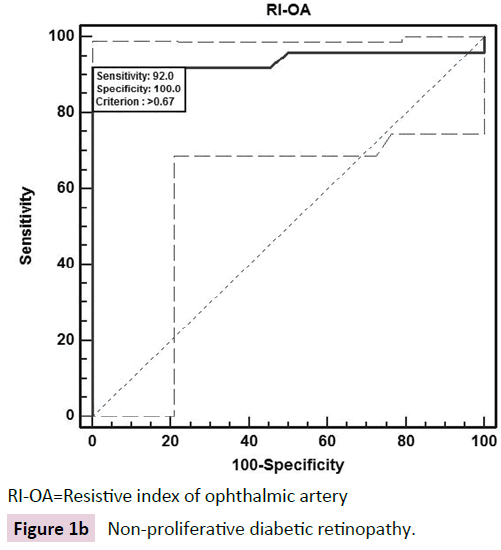
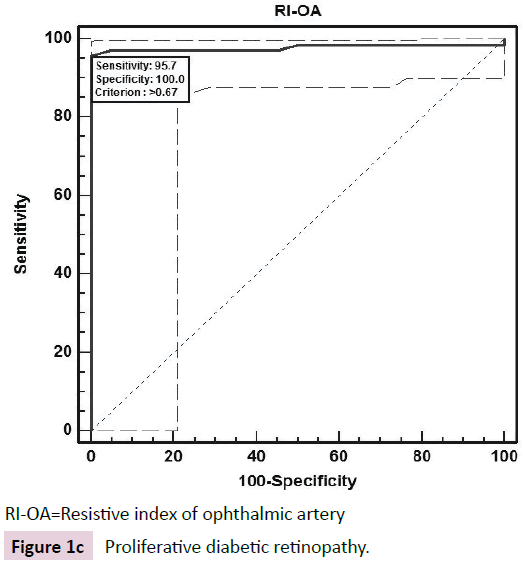
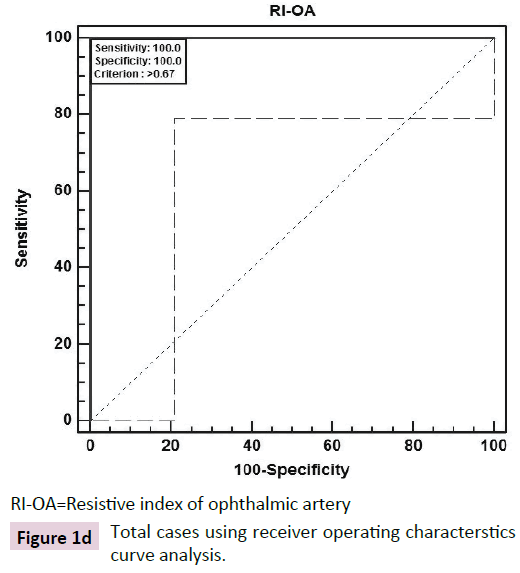
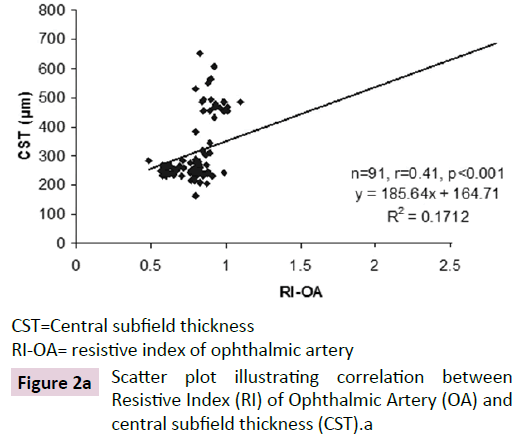
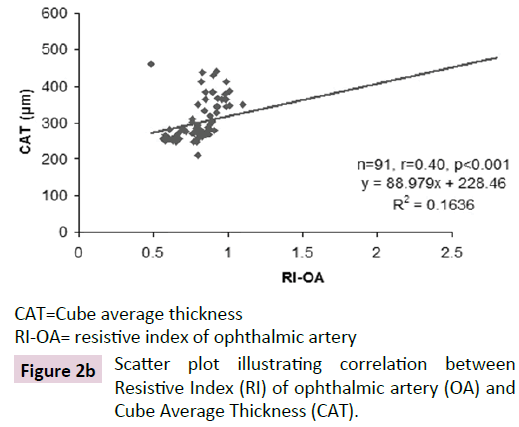
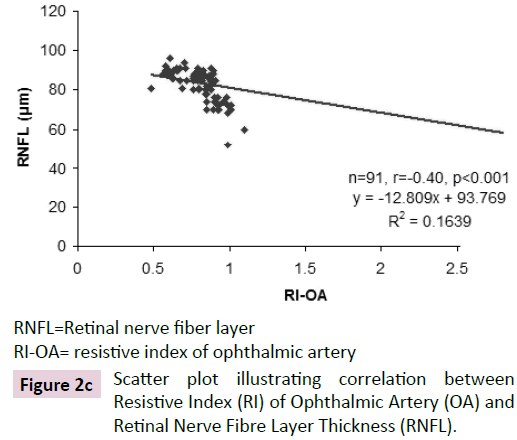
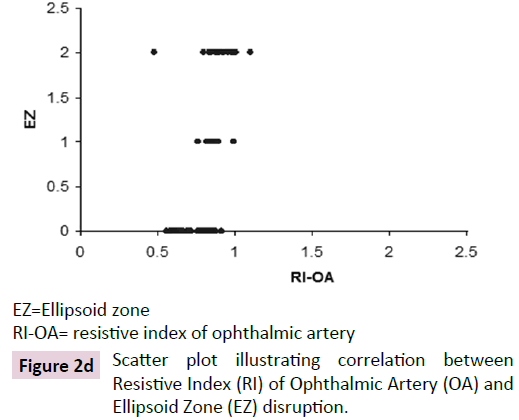
The ROC curve analysis showed diagnostic accuracy of RI of CRA [Area under curve (AUC) =0.841-0.999, p<0.001] in discriminating controls and cases. The ROC curve analysis (Figure 1a-d) also revealed significant diagnostic accuracy of RI of OA (AUC=0.941- 1.000, p<0.001) in discriminating controls and cases. At cut off value of >0.66-0.67, RI of OA had high sensitivity (92.00-100.00%) and high specificity (95.45-100.00%) with 95.7-100.0% positive predictive value and 91.7-100.0% negative predictive value. At >0.67 cut off value, RI of OA had 95.65% sensitivity (95% CI=87.8-99.0) and 100.00% specificity (95% CI=84.4-100.0) with 100.0% positive predictive value and 88.0% negative predictive value as shown in Table 3. The analysis concluded that RI of OA may be used as a diagnostic predictor for severity of DR. RI of OA was found to correlate positively with CST, CAT, and grades of EZ disruption (p<0.001) and negatively with RNFL thickness (p<0.001) on Pearson correlation analyses (Figure 2a-d). Pearson correlation analysis also revealed positive correlation of RI of CRA with CST, CAT and EZ disruption and negatively with RNFL thickness.
| Group |
Criterion
(cut off) value |
Sensitivity (95% CI) |
Specificity (95% CI) |
+PV |
-PV |
AUC |
Z value |
P value |
| NO DR |
>0.66 |
100.00 (84.4-100.0) |
95.45 (77.1-99.2) |
95.7 |
100 |
0.999 |
100.69 |
<0.001 |
| NPDR |
>0.67 |
92.00 (73.9-98.8) |
100.00 (84.4-100.0) |
100 |
91.7 |
0.941 |
12.39 |
<0.001 |
| PDR |
>0.67 |
100.00 (84.4-100.0) |
100.00 (84.4-100.0) |
100 |
100 |
1 |
NA |
<0.001 |
| Total |
>0.67 |
95.65 (87.8-99.0) |
100.00 (84.4-100.0) |
100 |
88 |
0.978 |
35.67 |
<0.001 |
NO DR=No diabetic retinopathy; NPDR=Non proliferative diabetic retinopathy; PDR=Proliferative diabetic retinopathy
+PV=Positive predictive value; PV=Negative predictive value; AUC=Area under curve.
Table 3: Diagnostic accuracy of resistive index of ophthalmic artery to discriminate controls and cases using receiver operating characterstics curve analysis.
RI-OA=Resistive index of ophthalmic artery
Figure 1a: Sensitivity and specificity of resistive index of ophthalmic artery to discriminate controls and cases diabetic retinopathy.
RI-OA=Resistive index of ophthalmic artery
Figure 1b: Non-proliferative diabetic retinopathy.
RI-OA=Resistive index of ophthalmic artery
Figure 1c: Proliferative diabetic retinopathy.
RI-OA=Resistive index of ophthalmic artery
Figure 1d: Total cases using receiver operating characterstics curve analysis.
CST=Central subfield thickness
RI-OA= resistive index of ophthalmic artery
Figure 2a: Scatter plot illustrating correlation between Resistive Index (RI) of Ophthalmic Artery (OA) and central subfield thickness (CST).a
CAT=Cube average thickness
RI-OA= resistive index of ophthalmic artery
Figure 2b: Scatter plot illustrating correlation between Resistive Index (RI) of ophthalmic artery (OA) and Cube Average Thickness (CAT).
RNFL=Retinal nerve fiber layer
RI-OA= resistive index of ophthalmic artery
Figure 2c: Scatter plot illustrating correlation between Resistive Index (RI) of Ophthalmic Artery (OA) and Retinal Nerve Fibre Layer Thickness (RNFL).
EZ=Ellipsoid zone
RI-OA= resistive index of ophthalmic artery
Figure 2d: Scatter plot illustrating correlation between Resistive Index (RI) of Ophthalmic Artery (OA) and Ellipsoid Zone (EZ) disruption.
Discussion
We evaluated the association of RI, a parameter of vascular resistance, in CRA and OA with the severity of DR including patients with proliferative diabetic retinopathy. A previous study showing similar correlation excluded proliferative diabetic retinopathy due to too few patients in the study [10]. In our study, a significant positive correlation was observed between RI of CRA and OA with the severity of DR. Increase in RI in OA and CRA was found to be associated with increased grades of EZ disruption, increased CST and CAT, and decrease in RNFL thickness on SD-OCT. A positive correlation between RI of OA and CRA with logMAR BCVA was also observed.
RI has been characterized as a marker of vascular resistance and is dependent on vascular resistance. RI increases with increasing resistance with vascular compliance taken into account [11]. In DR, the thickening of the basement membrane and pericyte loss in the walls of blood vessels are the earliest anatomical changes to occur and may contribute to increased vascular resistance [12,13]. Other factors that can contribute to endothelial damage and resulting increased vascular resistance include increased expression of ICAM-1 [14], advanced glycation end products [15], oxidative stress [5], and decreased capillary perfusion. Increased blood viscosity, decreased red cell deformability, and increased platelet aggregation are the rheological changes that are observed in at the capillary level [16,17].
As a result of endothelial damage, fluid extravasates from the capillaries leading to diabetic macular edema, capillary closure, and decreased capillary blood flow. These changes lead to decreased blood supply to the retina with resultant retinal ischemia and increased Vascular Endothelial Growth Factor (VEGF) release [18-20]. Retinal ischemia also results in increased blood flow in adjacent retinal capillaries. As a result, shear stress in the vessel wall increases due to increased flow, increased viscosity, and capillary closure [21]. Tooke hypothesized that increased glycation and thickening of the basement membrane results in "locking" of the vessel [22]. This tends to increase shear stress since the vessel diameter is unable to change leading to mechanical injury to the vascular endothelium. Capillary pressure is increased in diabetes mellitus as in the presence of dilated vasculature the systemic blood pressure is more easily transmitted to the microcirculation. The circumferential stress that is responsible for mechanical damage to the endothelium of the vessel wall is directly proportional to the perfusion pressure and radius and inversely proportional to the thickness of the vessel wall [23]. Hence, vessel wall of larger vessels of the retinal circulation suffer more circumferential stress damage. As a result, the vessel has tendency to dilate. As per Laplace law, the tension in the vessel wall resisting distension pressure is inversely proportional to the radius of the vessel. The vessel wall tension required to counteract distending pressure is not achieved in a dilated vessel, hence there is a tendency towards dilatation with subsequent hyper perfusion [24]. In addition, several factors, namely, abnormal auto regulation of the retinal circulation [25], increased conductance as an auto regulatory response to retinal ischemia [26], endothelin-1 resistance, inhibition of calcium influx channel in smooth muscle cells and increased activity of nitric oxide synthase also lead to hyper perfusion. As these changes occur in retinal vasculature, the RI increases. In the present study, we found that an increase in RI of OA and CRA correlated with severity of DR.
In our study, increase in RI of CRA and OA, related to the vascular endothelium damage, and were found to correlate significantly with increased CST, CAT and decrease in RNFL thickness. A significant correlation was also observed with EZ disruption. Recent Optical Coherence Tomography Angiography (OCTA) studies have highlighted that Deep Capillary Plexus (DCP) provides around 10-15% of oxygen to photoreceptor inner segment, particularly during dark adaptation [27]. DCP is located on outer side of the inner nuclear layer. It receives its branches from CRA. In the setting of systemic hypoxia, blood supply to outer retina through inner retinal vessels becomes even more significant, as choroidal vasculature has no auto regulatory mechanism, so it fails to adapt in such a setting [28]. The CRA, through DCP, contributes to the vascular supply of outer retina. On OCTA, DCP ischemia has been found to be associated with disruption of the outer retina, including thinning of the outer nuclear layer and photoreceptor disruption [29].
Inner segment of photoreceptors is metabolically active and is dependent upon choroid for its blood supply. As the RI of OA increases the resultant decrease in blood supply is unable to meet the metabolic demand of inner segment of photoreceptors which leads to EZ disruption.
Univariate ordinal logistic regression analysis showed a significant association between RI of OA and CRA with severity of DR. However, we found RI of OA as a significant independent predictor of severity of DR on multivariate ordinal logistic regression. Area under ROC curve also showed RI of OA as a sensitive and specific biomarker for severity of diabetic retinopathy. Cut off values of RI of OA may be used to predict the progression of DR and may serve as a significant bio imaging biomarker tool to predict the progression of disease before it becomes clinically evident.
RI in OA has been shown to be increased in carotid and coronary atherosclerosis [30]. RI of OA is a simple, noninvasive, physicianfriendly, easy to compute and comprehend bio imaging biomarker for severity of DR, and possibly overall increased cardiovascular risk.
References
- Klein R, Klein BEK, Moss SE, Davis MD, DeMets DL (1984) The Wisconsin Epidemiologic Study of Diabetic Retinopathy III. Prevalence and Risk of Diabetic Retinopathy When Age at Diagnosis Is 30 or More Years. Arch Ophthalmol 102: 527-532.
- Wybar K (1977) Wolff’s Anatomy of the Eye and Orbit. The British J Ophthalmology. 61: 302.
- Fernandez EJ, Hermann B, Povazay B, Unterhuber A, Sattmann H, et al. (2008) Ultrahigh resolution optical coherence tomography and pancorrection for cellular imaging of the living human retina. Opt Express. 16: 11083-11094.
- Spaide RF, Curcio CA (2011) Anatomical correlates to the bands seen in the outer retina by optical coherence tomography: Literature Review and Model. Retina (Philadelphia, Pa). 31: 1609-1619.
- Sharma S, Saxena S, Srivastav K, Shukla RK, Mishra N, et al. (2015) Nitric oxide and oxidative stress is associated with severity of diabetic retinopathy and retinal structural alterations. Clin Exp Ophthalmol 43: 429-436.
- Lieb WE, Flaharty PM, Sergott RC, Medlock RD, Brown GC, et al. (1991) Color Doppler imaging provides accurate assessment of orbital blood flow in occlusive carotid artery disease. Ophthalmol 98: 548-552.
- Early Treatment Diabetic Retinopathy Study Research Group (1991) Early Treatment Diabetic Retinopathy Study design and baseline patient characteristics: ETDRS report number 7. Ophthalmol 98: 741-756.
- ETDRS Research Group (1991) Grading diabetic retinopathy from stereoscopic color fundus photographs-an extension of the modified Airlie House classification. ETDRS report number 10. Early Treatment Diabetic Retinopathy Study Research Group. Ophthalmol 98: 786-806.
- Virgili G, Menchini F, Casazza G, Hogg R, Das RR, et al. (2015) Optical coherence tomography (OCT) for detection of macular oedema in patients with diabetic retinopathy. Cochrane Database of Systematic Reviews 2015.
- Karami M, Janghorbani M, Dehghani A, Khaksar K, Kaviani A (2012) Orbital Doppler Evaluation of Blood Flow Velocities in Patients with Diabetic Retinopathy. The Review of Diabetic Studies: RDS 9: 104-111.
- Bude RO, Rubin JM (1999) Relationship between the resistive index and vascular compliance and resistance. Radiology 211: 411-417.
- Kuwabara T, Cogan DG (1963) Retinal vascular patterns VI: mural cells of the retinal capillaries. Arch Ophthalmol 69: 492-502.
- Takahashi K, Brooks RA, Kanse SM, Ghatei MA, Kohner EM (1989) Endothelin I is produced by cultured bovine retinal endothelial cells and endothelin receptors are present on associated pericytes. Diabetes 38: 1200-1202.
- Jain A, Saxena S, Khanna VK, Shukla RK, Meyer CH (2013) Status of serum VEGF and ICAM-1 and its association with external limiting membrane and inner segment-outer segment junction disruption in type 2 diabetes mellitus. Molecular Vision 19: 1760-1768.
- Strozecki P, Kurowski R, Flisinski M, Stefanska A, Odrowaz-Sypniewska G, et al. (2013) Advanced glycation end products and arterial stiffness in diabetic and non-diabetic patients with chronic kidney disease. Pol Arch Med Wewn 123: 609-616.
- McMillan DE (1983) The effect of diabetes on blood flow properties. Diabetes 32: 56-63.
- Juhan I, Vague P, Buonocore M, Moulin JP, Jouve R (1982) Abnormalities of erythrocyte deformability and platelet aggregation in insulin-dependent diabetics corrected by insulin in vivo and in vitro. Lancet 535-537.
- Patz A Retinal neovascularization (1984) Early contributions of Professor Michaelson and recent observations. British J Ophthalmol 68: 42-46.
- Crawford TN, Alfaro DV, Kerrison JB, Jablon EP (2009) Diabetic retinopathy and angiogenesis. Curr Diabetes Rev 5: 8-13.
- Funatsu H, Yamashita H, Noma H, Shimizu E, Yamashita T, et al. (2001) Stimulation and inhibition of angiogenesis in diabetic retinopathy. Jpn J Ophthalmol 45: 577-584.
- Fry DL (1969) Certain histological and chemical responses of the vascular interface to acutely induced mechanical stress in the aorta of the dog. Circulation Research 24: 93-108.
- Tooke JE (1986) Microvascular haemodynamics in diabetes mellitus. Clin Sci 70: 119-125.
- Burton AC (1954) Relation of structure to function of the tissues of the walls of blood vessels. Physiol Rev 34: 619-642.
- Hwang TS, Jia Y, Gao SS, Bailey ST, Lauer AK, et al. (2015) Optical Coherence Tomography Angiography Features of Diabetic Retinopathy. Retina (Philadelphia, Pa.) 35: 2371-2376.
- Grunwald JE, DuPont J, Riva CE (1996) Retinal haemodynamics in patients with early diabetes mellitus. Bri J Ophthalmol 80: 327-331.
- Grunwald JE, Riva CE, Martin DB, Quint AR, Epstein PA (1987) Effect of an insulin-induced decrease in blood glucose on the human diabetic retinal circulation. Ophthalmol 94: 1614-16120.
- Birol G, Wang S, Budzynski E, Wangsa-Wirawan ND, Linsenmeier RA (2007) Oxygen distribution and consumption in the macaque retina. Am J Physiol Heart Circ Physiol 293: H1696-H1704.
- Yi J, Liu W, Chen S, Backman V, Sheibani N, et al. (2015) Visible light optical coherence tomography measures retinal oxygen metabolic response to systemic oxygenation. Light Sci Appl.
- Scarinci F, Jampol LM, Linsenmeier RA, Fawzi AA (2015) Association of diabetic macular nonperfusion with outer retinal disruption on optical coherence tomography. JAMA Ophthalmol 133: 1036-1044.
- Hong SP, Park YW, Lee CW, Park JW, Bae KR, et al. (2014) Usefulness of the doppler flow of the ophthalmic artery in the evaluation of carotid and coronary atherosclerosis. Korean Circ J 44: 406-414.