Key Words
Coefficient of variation; District; SMR
Introduction
Standardized Mortality Ratio is one of the basic methodologies used in small area estimation technique and is simply a ratio of observed to the expected deaths and could be used to provide estimates of local area such as district or sub-county whose estimates at that level may not be derived by direct estimation from the available survey data. Small area estimation is statistical techniques involving the estimation for small sub-populations, generally used when the sub-population of interest is included in a larger survey. For example a national survey may derive estimates for regional cluster statistics but not for district level but using small area estimation indicators for the latter could be estimated. Small area estimates in general may be useful for government agencies to allocate resources or identify hazardous areas related to high under-five mortality so that appropriate action may be taken [1-3]. Mapping mortality and disease rates to display geographic variability is an increasingly common epidemiological tool and falls under a broad subject of small area estimation. Understanding spatial clustering of childhood or/and under-five mortality can provide a guide in targeting interventions in a more strategic approach to the population where mortality is highest and the interventions are most likely to make an impact [4].
National surveys are widely used to provide estimates for the entire population parameters of interest but also for subpopulations (domains) such as regions, rural or urban, sex and age groups. However, such subpopulations are generally too large to provide a sense of particular lower level localities (small areas) like district or counties or sub-counties where the actual problem can easily be located. Intervention can easily be accomplished when a small locality has been identified with a particular problem. Small area estimation provides a solution to using survey data to furnish estimates at such lower localities. The idea is that small area estimation techniques in particular “borrow strength” by using values of the variable of interest, y, from related areas to increase “effective” sample size. The value of, y, is by itself “small” to provide a reliable direct estimate for a particular locality. For example, the number of under-five deaths, y, derived from a national survey data may be too small to provide estimate of under-five mortality for a particular district. However, using small area estimation, the value of, y, can help derive a reliable estimate for relative risk of under-five mortality for the district. Relative Risk is the ratio of the incidence of disease in the exposed population to the incidence in the non-exposed population [5]. It is a ratio of two probabilities. In utilizing small area estimation techniques, the values, y, are brought into the estimation process through a model that provides a link to the related areas. A study by Asiimwe et al., [6] show that use of Poisson-gamma and log-normal models offer reliable with less ‘noise’ in the estimates for small area under-5 mortality data though these methodologies appear to be more complex. The simplest form is to use SMR which is a ratio of the observed value, y, to the expected deaths to provide an estimate of the relative risk of under-five mortality for a given locality. However, literature has shown that use of SMR is subject to unreliable results but no empirical study has verified that this is so.
Materials and Method
The study utilized data obtained from Uganda Demographic and Health Surveys of 1995, 2001 and 2006. This section provides discussion on the three data sets that were used in the study; their sources and weakness. A summary of the key characteristics of the three UDHS surveys of 1995, 2001 and 2006 are given in Table 1.
| Year of Survey Data |
Number of Districts |
Number of Households Sampled |
| 1995 |
37 |
7,550 |
| 2001 |
34 |
7,885 |
| 2006 |
56 |
8,870 |
Table 1 Summary of the key characteristics of the 1995, 2001 and 2006 UDHS data sets.
The UDHS survey of 1995 covered a total of 37 districts and due to armed conflict; the district of Kitgum located in the northern part of the country was not covered. By the time of the survey, Uganda had a total of 38 districts. A sample of 303 Primary Sampling Units (PSUs) consisting of Enumeration Areas (EAs) were selected from a sampling frame of the 1991 Population and Housing Census and covered a total of 7,070 women in the reproductive age group of 15–49 years. An EA in most cases is equivalent to a village but where the size of the village is big two or more EAs are created. The survey also obtained data from a total of 7,550 households and 1,996 men in a reproductive age group of 15- 54 years. The country was clustered into four regions consisting of Central, Eastern, Northern and Western. To permit calculation of contraceptive prevalence rates under a USAID-funded project called DISH (Delivery of Improved Services for Health) a sample design allowed for over sampling of households in the nine districts. These districts were Kasese, Mbarara, Masaka, Rakai, Luwero, Masindi, Jinja, Kamuli and Kampala. Over sampling allowed for a reliable sample size that would purposively allow derive estimates for such areas or districts.
The UDHS data of 2001 covered a total of 34 districts and again due to armed conflict; the districts of Kasese and Bundibugyo in Western Region as well as Gulu and Kitgum in the Northern region were excluded from the survey. A sample of 298 PSUs consisting of EAs were selected from a sampling frame of the 1991 Population and Housing Census and covered a total of 7,246 women in the reproductive age group of 15-49 years. The survey equally obtained data from a total of 7,885 households and 1,962 men in a reproductive age group of 15-54 years. The country was also clustered into four regions consisting of Central, Eastern, Northern and Western. To permit calculation of contraceptive prevalence rates under DISH project the nine districts were again over sampled. Over sampling of EAs were also carried out for the districts (Kabale, Kisoro and Rukungiri) under the project called CREHP (Community Reproductive Health Project).
As compared to the UDHS of 1995 and 2001, the survey of 2006 covered all the 56 districts of the country providing a better estimate of SMR. Although the number of districts in the country have continued to increase to currently more than 110, by the time of the 2006 survey there were only 56. A total sample of 321 primary sampling units (PSU) consisting of enumeration areas (EAs) were selected from a sampling frame of the clusters sampled in the 2005-2006 Uganda National Household Survey and an additional 47 EAs were over sampled from the North Eastern Region (Kotido, Moroto and Nakapiripirit) and IDP camps in the districts of Gulu, Kitgum, Lira and Pader [7]. The over sampled areas were aimed at obtaining specific baseline indicators due to armed conflict that ravaged the region for over 20 years prior to the survey. The country was clustered into nine regions compared to the four covered in the prior surveys. The nine regions included; Central 1, Central 2, Kampala, Eastern, East Central, North, West Nile, Western and South Western (Figure 1). In general, a total of 8,531 women in the reproductive age group of 15–49 years were interviewed. The survey equally obtained data from a total of 8,870 households and 2,503 men in the reproductive age group of 15-54 years.
Figure 1: Map of Uganda showing clusters used in UDHS 2006.
In each of the UDHS surveys of 1995, 2001 and 2006, data on the number of children dead reported by women in a reproductive age group of 15-49 years were collected.
Data was accessed with permission from Demographic and Health Survey website. This research work used under-five mortality rather than other mortality measures like infant or child mortality due to the fact that significantly larger and more samples are obtainable. Additionally, the indicator is in line with the MDGs target to reduce under-five mortality by two-thirds between 1990 and 2015. The data used in the estimation of the under-five mortality rates were collected on the birth history of women aged 15-49 years. For children who had died, the women were asked to provide the age at death. The data used for computation of under-five mortality is susceptible to some errors. Firstly, only surviving women aged 15-49 years were interviewed; therefore, no data are available for children of women who had died. Another possible error in data collection is underreporting of events (births and deaths), especially in cases where deaths occur early in infancy. Attempts to address under reporting of age at deaths were done by recording days if the death took place within one month after birth, in months if the child died within 24 months, and in years if the child was two years or older [8].
The author used the Standardized Mortality Ratio (SMR) and is defined as;
 (1)
(1)
Where yi and ei denote the number of deaths and the expected number of deaths respectively from the disease during the study period. Generally the expected number of cases ei is assumed known (Bailey, 2001).
The standard deviation (s.d) for the relative risk under the SMR is given as [9].
 (2)
(2)
where yi refer to the number of observed cases of under-five deaths in a given district, i.
The standard error (s.e) for the relative risk under the SMR is given as;
 (3)
(3)
where ei refers to the expected number of deaths in a given district.
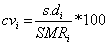
Coefficient of variation is defined as;
 (4)
(4)
Results
Using the 1995 UDHS data, SMR had lower CVs (<100%). This may largely be attributed to the fact that the number of districts was still few by 1995 and the observed counts were fairly substantial. By 1995, there were a total of 38 districts although the demographic and health survey covered 37 due to armed conflict in one of the district. Compared to 2006 where we had a total of 56 districts and even if the sample size had slightly increased, SMR showed a more reliable and stable estimates with fewer districts for either 1995 or 2001. The highest CV was 59.8% obtained for Kabale district.
SMR results using the 2001 UDHS data showed very high variability (>100%) in three districts of Kapchorwa, Kotido and Hoima as shown in Table 2. Overall, other district’s coefficient of variation was relatively low indicating low level of ‘noise’ in the SMR computations. Despite high CVs in the three districts, overall the other districts showed lower CVs and again this might be attributed to the fact that the numbers of districts were still few (34) and subsequently a large number of observations per district to reduce the noise.
| No. |
District |
2006 |
2001 |
1995 |
| SMR |
Standard Deviation (SMR) |
CV% for SMR |
SMR |
Standard Deviation (SMR) |
CV% for SMR |
SMR |
Standard Deviation (SMR) |
CV% for SMR |
| 1 |
Adjumani |
0.1 |
0.316 |
248.9 |
- |
- |
- |
- |
- |
- |
| 2 |
Apac |
0.6 |
0.076 |
13.1 |
0.59 |
0.090 |
14.5 |
0.46 |
0.107 |
23.2 |
| 3 |
Arua |
0.8 |
0.061 |
7.3 |
0.57 |
0.080 |
14.2 |
0.67 |
0.075 |
11.3 |
| 4 |
Bugiri |
0.5 |
0.139 |
31.0 |
- |
- |
- |
- |
- |
- |
| 5 |
Bundibugyo |
0.9 |
0.132 |
15.5 |
- |
- |
- |
1.62 |
0.136 |
8.4 |
| 6 |
Bushenyi |
0.5 |
0.080 |
14.9 |
0.63 |
0.080 |
12.9 |
0.63 |
0.087 |
13.7 |
| 7 |
Busia |
0.6 |
0.169 |
30.6 |
- |
- |
- |
- |
- |
- |
| 8 |
Gulu |
1.0 |
0.069 |
6.9 |
- |
- |
- |
0.63 |
0.106 |
16.7 |
| 9 |
Hoima |
0.5 |
0.132 |
25.4 |
0.17 |
0.230 |
135.8 |
0.66 |
0.164 |
25.0 |
| 10 |
Iganga |
1.0 |
0.072 |
7.5 |
1.00 |
0.070 |
7.2 |
0.60 |
0.068 |
11.4 |
| 11 |
Jinja |
0.2 |
0.196 |
82.3 |
0.50 |
0.140 |
27.4 |
0.68 |
0.115 |
16.8 |
| 12 |
Kabale |
0.4 |
0.124 |
34.8 |
0.57 |
0.110 |
19.1 |
0.29 |
0.171 |
59.8 |
| 13 |
Kabarole |
0.2 |
0.196 |
85.8 |
1.30 |
0.080 |
6.2 |
0.63 |
0.086 |
13.7 |
| 14 |
Kaberamaido |
0.3 |
0.333 |
124.3 |
- |
- |
- |
- |
- |
- |
| 15 |
Kalangala |
0.6 |
0.378 |
65.7 |
2.06 |
0.240 |
11.5 |
4.16 |
0.218 |
5.2 |
| 16 |
Kampala |
0.5 |
0.089 |
17.2 |
0.35 |
0.100 |
27.3 |
0.62 |
0.082 |
13.3 |
| 17 |
Kamuli |
1.0 |
0.072 |
7.5 |
0.99 |
0.070 |
7.3 |
1.19 |
0.067 |
5.6 |
| 18 |
Kamwenge |
0.9 |
0.116 |
13.2 |
- |
- |
- |
- |
- |
- |
| 19 |
Kanungu |
0.4 |
0.186 |
52.3 |
- |
- |
- |
- |
- |
- |
| 20 |
Kapchorwa |
0.4 |
0.229 |
58.6 |
0.06 |
0.580 |
1003.0 |
0.45 |
0.224 |
50.1 |
| 21 |
Kasese |
0.4 |
0.123 |
31.1 |
- |
- |
- |
0.35 |
0.171 |
49.3 |
| 22 |
Katakwi |
0.4 |
0.192 |
54.2 |
- |
- |
- |
- |
- |
- |
| 23 |
Kayunga |
0.3 |
0.192 |
59.4 |
- |
- |
- |
- |
- |
- |
| 24 |
Kibaale |
0.6 |
0.114 |
19.2 |
0.53 |
0.120 |
22.3 |
1.11 |
0.120 |
10.8 |
| 25 |
Kiboga |
0.5 |
0.177 |
36.0 |
0.90 |
0.140 |
15.4 |
1.24 |
0.136 |
11.0 |
| 26 |
Kisoro |
0.1 |
0.354 |
388.1 |
1.56 |
0.090 |
6.0 |
0.92 |
0.143 |
15.5 |
| 27 |
Kitgum |
0.9 |
0.096 |
11.0 |
- |
- |
- |
- |
- |
- |
| 28 |
Kotido |
1.1 |
0.064 |
6.0 |
0.11 |
0.210 |
189.7 |
1.22 |
0.186 |
15.2 |
| 29 |
Kumi |
0.3 |
0.171 |
50.0 |
0.65 |
0.120 |
18.6 |
1.04 |
0.103 |
9.9 |
| 30 |
Kyenjojo |
0.6 |
0.121 |
21.4 |
- |
- |
- |
- |
- |
- |
| 31 |
Lira |
0.5 |
0.082 |
18.2 |
0.49 |
0.090 |
18.6 |
0.70 |
0.083 |
11.9 |
| 32 |
Luwero |
0.4 |
0.143 |
39.6 |
0.49 |
0.130 |
26.5 |
0.61 |
0.108 |
17.6 |
| 33 |
Masaka |
0.5 |
0.085 |
16.4 |
0.98 |
0.070 |
7.5 |
0.88 |
0.066 |
7.5 |
| 34 |
Masindi |
0.5 |
0.113 |
21.0 |
0.20 |
0.180 |
91.9 |
0.38 |
0.189 |
50.2 |
| 35 |
Mayuge |
0.1 |
0.354 |
404.5 |
- |
- |
- |
- |
- |
- |
| 36 |
Mbale |
0.9 |
0.077 |
8.5 |
0.74 |
0.080 |
11.3 |
0.61 |
0.078 |
12.8 |
| 37 |
Mbarara |
0.4 |
0.075 |
18.4 |
0.62 |
0.070 |
10.8 |
1.11 |
0.058 |
5.2 |
| 38 |
Moroto |
1.5 |
0.095 |
6.2 |
0.80 |
0.140 |
17.7 |
0.46 |
0.174 |
38.1 |
| 39 |
Moyo |
0.2 |
0.277 |
161.6 |
1.04 |
0.120 |
11.7 |
0.58 |
0.154 |
26.7 |
| 40 |
Mpigi |
0.3 |
0.156 |
54.3 |
1.08 |
0.100 |
8.8 |
0.54 |
0.081 |
15.0 |
| 41 |
Mubende |
0.9 |
0.075 |
8.3 |
1.02 |
0.080 |
7.3 |
0.94 |
0.083 |
8.8 |
| 42 |
Mukono |
0.5 |
0.098 |
21.3 |
0.55 |
0.100 |
17.3 |
0.47 |
0.092 |
19.7 |
| 43 |
Nakapiripirit |
1.0 |
0.128 |
12.4 |
- |
- |
- |
- |
- |
- |
| 44 |
Nakasongola |
0.6 |
0.209 |
32.8 |
- |
- |
- |
- |
- |
- |
| 45 |
Nebbi |
0.5 |
0.107 |
20.8 |
0.66 |
0.100 |
15.6 |
0.62 |
0.035 |
5.7 |
| 46 |
Ntungamo |
0.3 |
0.139 |
40.4 |
- |
- |
- |
- |
- |
- |
| 47 |
Pader |
1.0 |
0.085 |
8.8 |
- |
- |
- |
- |
- |
- |
| 48 |
Pallisa |
0.5 |
0.124 |
25.3 |
0.50 |
0.120 |
23.4 |
0.70 |
0.102 |
14.6 |
| 49 |
Rakai |
0.7 |
0.095 |
14.1 |
0.76 |
0.110 |
13.8 |
0.70 |
0.110 |
15.7 |
| 50 |
Rukungiri |
0.3 |
0.165 |
50.2 |
1.68 |
0.080 |
4.8 |
0.44 |
0.143 |
32.5 |
| 51 |
Sembabule |
1.1 |
0.123 |
11.7 |
- |
- |
- |
- |
- |
- |
| 52 |
Sironko |
0.4 |
0.196 |
54.5 |
- |
- |
- |
- |
- |
- |
| 53 |
Soroti |
0.4 |
0.171 |
47.5 |
0.70 |
0.120 |
17.0 |
0.64 |
0.097 |
15.1 |
| 54 |
Tororo |
0.6 |
0.113 |
19.8 |
0.62 |
0.110 |
17.0 |
0.64 |
0.086 |
13.5 |
| 55 |
Wakiso |
0.2 |
0.126 |
63.5 |
- |
- |
- |
- |
- |
- |
| 56 |
Yumbe |
0.2 |
0.250 |
153.2 |
- |
- |
- |
- |
- |
- |
| The symbol “-“ indicates that the district was not yet created |
Table 2 Variability arising from use of SMR as shown by Coefficient of Variation (CV%) using 2006, 2001 and 1995 UDHS data.
Results obtained from the standard deviation of SMR show high values for the districts of Adjumani, Kaberamaido, Kisoro, Mayuge, Moyo and Yumbe. The coefficient of variation (CV) for these districts were relatively very high (>100%) as shown in Table 2 depicting unreliability in utilization of SMR to estimate relative risk of under-five mortality. The ‘noise’ from SMR results can be attributed to the fact that more districts (56) were introduced that reduced the sample size per district.
Discussion
Coefficient of variation (CV) using SMR for the 1995 UDHS data showed little variability or simply the standard deviations were small. In all the cases for the 37 districts none of them exceeded 60% when using CV. These results further show that when few districts are involved in estimation of SMR and when substantial data points are provided, SMR estimates appear to be a good estimate of relative risk of under-five mortality.
SMR results using the 2001 UDHS data showed very high variability (>100%) in three districts of Kapchorwa, Kotido and Hoima as shown in Table 2. Overall, other district’s coefficient of variation was relatively low indicating low level of ‘noise’ in the SMR computations. Again this may largely be attributed to the fact that the number of districts was still few by 2001 and the observed count (yi) was fairly substantial.
SMR results using the 2006 UDHS data showed very high CV for the districts of Adjumani, Kaberamaido, Kisoro, Mayuge, Moyo and Yumbe. The coefficient of variation (CV) for these districts were relatively very high (>100%) depicting unreliability in utilization of SMR to estimate relative risk of under-five mortality.
Conclusion
There were 37, 34 and then 56 districts in the UDHS data of 1995, 2001 and 2006 respectively. Since there were fewer districts in the UDHS of 1995 and 2001, there were more observations per districts for these periods. More observations allowed for less volatility in SMR measure compared to the UDHS data of 2006. With UDHS data of 2006 less observation per districts were giving raise to increase ‘noise’ in the SMR results.
Recommendation
The author therefore recommend that before utilization of SMR, there is need to explore empirically the reliability of the results using simple techniques such as coefficient of variation. We also recommend use of alternative Bayesian approaches like Besang, York, Mollie, Poisson-gamma or the Log-normal models to smoothen the estimates.
Acknowledgement
I am grateful to United States Agency for International Development (USAID) for providing online data sets that I used in this study.
References
- Wakefield J (2007) Disease Mapping and Spatial Regression with Count Data. Biostatistics 8: 158-183.
- Meza JL (2002) Empirical Bayes estimation smoothing of relative risks in disease mapping. Journal of Statistical Planning and Inference 112: 43 – 62.
- Lawson AB, Biggeri AB, Boehning D, Lesaffre E, Viel JF, et al. (2000) Disease Mapping Models: An Empirical Evaluation. Stat Med 19: 2217-2241.
- Lutambi AM, Alexander M, Jensen C, Mahutanga C, Nathan R (2010) Spatial-temporal clusters in Ifakara HDSS in South-eastern Tanzania. Glob Health Action 3
- Lawson AB, Williams FLR (2001) An introduction Guide to Disease Mapping. UK: John Wiley & Sons Ltd, West Sussex.
- Asiimwe JB, Jehopio P, Atuhaire LK, Mbonye AK (2011) Examining small area estimation techniques for public health intervention: Lessons from application to under-five mortality data in Uganda. J Public Health Policy 32: 1-15.
- UBOS (2005) Uganda National Household Survey 2005/2006-Report on the Socio-Economic Survey. Uganda Bureau of Statistics (UBOS), Entebbe, Uganda.
- UBOS and ORC Macro (2007) Uganda Demographic and Health Survey 2006. Uganda Bureau of Statistics, Kampala, Uganda.
- Soe MM, Sullivan KM (2006) Standardized Mortality Ratio and Confidence Interval.