Keywords
Blends; Low density polyethylene; Linear low density polyethylene; High density polyethylene; Recycling code; Melt processing
Introduction
Plastics recycling is an important element of Circular Economy because the mechanical recycled materials, obtained from postconsumer goods can be converted into new products frequently substituting virgin plastics, after explicit technological steps (like grinding, washing, separating, drying, re-granulating and compounding) [1,2].
Because the thermoplastic polymers are generally non-miscible, the recycled blends resulted from different post-consumer polymeric goods will have always poor mechanical properties, reason which makes, at first sight, the mechanical recycled materials unsuitable for many applications. Therefore without a good separation per polymer or at least per polymer groups, or without a good compatibilization solution, the mechanical recycled materials may be impossible and far from what it can be [3-7]. Consequently, in view of mechanical recycling, the polymer identification must be done, even when the polymeric postconsumer goods do not have the recycling code.
The known marking system for thermoplastic polymers is generally accepted and applied, since the 1980s and it is represented by recycling codes for each polymer as a triangle with inside numbers for each type [8-11]. However the plastics goods molded from polymeric blends or compounds do not fit into this numbering system and consequently, the polymeric material’s identification cannot be done. Plastic products like films, tarps, pipes, toys, computer keyboards and a multitude of other goods simply do not have the recycling code.
Actually thousands of miscellaneous plastic resins or mixtures of resins, being unmarked, cannot be selectively collected and therefore cannot be mechanically recycled in a convenient manner [8]. That is why, the finding of type and, possible of concentration for each polymer from such compounds/blends would contribute to the more efficient and low-cost recycled materials from post-consumer goods.
If the post-consumer goods do not wear the recycling code, then different identification techniques must be used to find the polymers from each compound used to obtain such goods. The following methods allow the accurate identification of individual polymers are: infrared spectroscopy, Raman spectroscopy, mass spectroscopy, X-ray spectroscopy, laser impulse technology, short wave near infrared spectroscopy, Fourier transform mid-infrared spectroscopy (FT-MIR) [12-17]. Differential scanning calorimetry (DSC) has been proved also an effective, reliable and fast method for identification and quantification of polymers such as PE and PP in waste and/or recycled plastics. The onset temperature of the melting peak and the peak maximum are used to define the melting range of the polymer helps in polymer identification [17].
The article aim was to identify, in view of mechanical recycling, the individual polymers from some package films coming from food industry (coded as P1 and P2), application where blends and compounds are mainly used, in the last decade, to obtain mono or multilayered films.
Materials and Methods
In view of identification, it was recorded the FTIR spectra and the DSC thermogrames and it were measured the density and melt flow index for the folowing polymeric materials:
• The two films P1 and P2 which must be identify;
• The two films molded from two new blends (coded as P3 and P4) obtained with a classical laboratory Brabenderroller procedure;
• The known polyolefins (POs) currently used as food package films: low density polyethylene (LD-PE), two lowlow density linear polyethylene (LLD-PE1 and LLD-PE2) and two high density polyethylene (HD-PE1, HD-PE2).
The two new blends P3 and P4 contain each of them 80% LD-PE% with 0.913 g/cm3 and, in the case of the P3 blend 20% HD-PE with 0.951 g/cm3 and for the P4 those 20% LLD-PE with 0.92 g/cm3. Blend. The Brabender-roller procedure consisted in mixing, for 10 minutes, in Brabender at temperatures greater with 15-20°C as the melting temperatures identified by DSC for each PO, and then roll profiling into films of 0.1 mm thickness, at a temperature of about 20°C lower than the Brabender blending temperature.
Characterization
FTIR analysis was performed on a DIGILAB Scimitar FT-IR spectrometer, equipped with ZnSe crystal, via the Attenuated Total Reflectance (ATR) method. KBr pellets have been employed. The recording was carried out at 4 cm-1 resolution, using the average spectrum resulted from 5 spectra recorded for each compound. The spectrum was processed based on a Grams/32 software.
Thermal behavior was studied by Differential Scanning Calorimetry (DSC) using Netzsch DSC 204 Fl Phoenix equipment. The samples were subjected to analysis from 0°C to 200°C using a heating rate of 10°C/min (first run), then cooled to 0°C with a cooling rate of 10°C/min(second run) and finally heated to 200°C using a rate of 10°C/min under nitrogen atmosphere (20 mL/min flow rate) (third run). The DSC exothermic peak appeared after the first run gives information about melting before removing of thermal history, the DSC endotherm formed after the second run describes the sample crystallization occurring at its cooling and the DSC exotherm appeared after the third run gives information on the sample melting after removing its thermal history.
The films density was measured with a PRECISA hydrostatic balance according to the density quit no.350-8515/350-8556. The melt flow properties (MFI) were determined [18], using a DYNISCO 4000 LMI indexer equipped with a nozzle of 2.09/8 mm (diameter/length) and working at 190°C and 2,16 kg.
Results and Discussions
The all the FTIR spectra of the analyzed P1, P2 film (Figure 1a and 1b) indicate that the materials used to obtain these films were by polyolefinic type. Consequently, these spectra are almost identical with those of the other analyzed films namely P3, P4 (Figure 1c and 1d) and different POs (Figure 1e, 1g and 1h). In all these spectra, the same peaks which present slight differences regarding shape and height appear (Figure 1f), probably because the different functional groups are in proportions depending on the material type. These spectra indicate that the two films which must be identified by polyolefinic type. It is well known that the amount of branching makes the differences between the FTIR spectra of LDPE, HD-PE and LLD-PE especially if LLD-PE is compared with LD-PE [10,11]. When one compares the LLDPE with HDPE, because lacks any noticeable difference between their structures, their FTIR spectra are almost the same. In the case of the comparison of the LLDPE with LDPE, due to the additional branching in LLDPE and LDPE possible some differences in thickness/length of peaks from the LLDPE spectrum and those of LDPE do exist. Therefore using only the FTIR spectra it is impossible to be specified which type of polyolefins or polyolefinic blends, the P1 and P2 films belong.
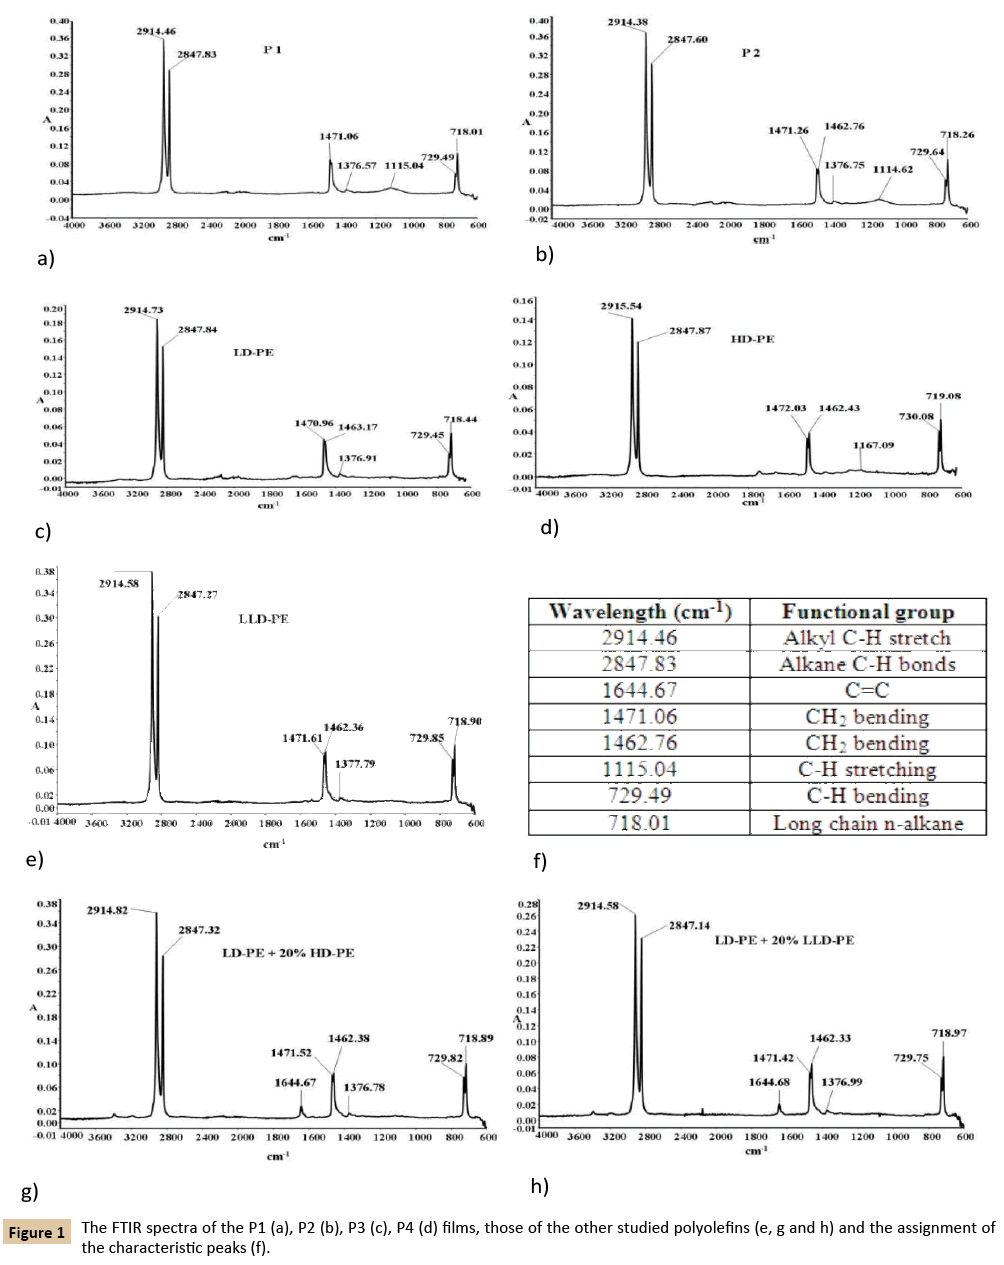
Figure 1: The FTIR spectra of the P1 (a), P2 (b), P3 (c), P4 (d) films, those of the other studied polyolefins (e, g and h) and the assignment of the characteristic peaks (f).
The thermal behavior of the P1 and P2 films are described by the DSC thermograms presented in Figure 2. The shape of the DSC thermograms after the three runs show that these two films have different own thermal behavior which means different polymeric materials (Figure 2a and 2b). Depending on the number of the DSC heating stage, each analyzed films behave differently at melting (P1 - Figure 2c and 2d; P2 - Figure 2e and 2f). If after the first heating stage the P1 film melts with two deep and narrow melting peaks, one with maximum at 106.47°C and another at 109.78°C (Figure 2c) after the third run (second heating stage) this film melts almost in the same temperature range, with only on slightly broadened and a little bit shorter melting peak with maximum at 110.16°C (Figure 2d). After the first heating stage (first run) on the DSC curve of the P2 Film (Figure 2e and 2f) appears a sharper melt with two overlapped peaks with maximum, one at 105.80°C and another at 112.22°C (Figure 2e) and, after the second heating (third run) the melting of this film is described also by two overlaid peaks, one with maximum at 108.55°C and another at 119.29°C (Figure 2f). In all situations, the melting begins almost at the same onset temperature. The observed differences between the DSC thermograms after the first and the third runs are the consequence of the fact that during the first run melts the material influenced by its own thermal history generated by the processing conditions during molding as films and those after the third run shows the material melting without this influence because its thermal history was eliminated during the first run.
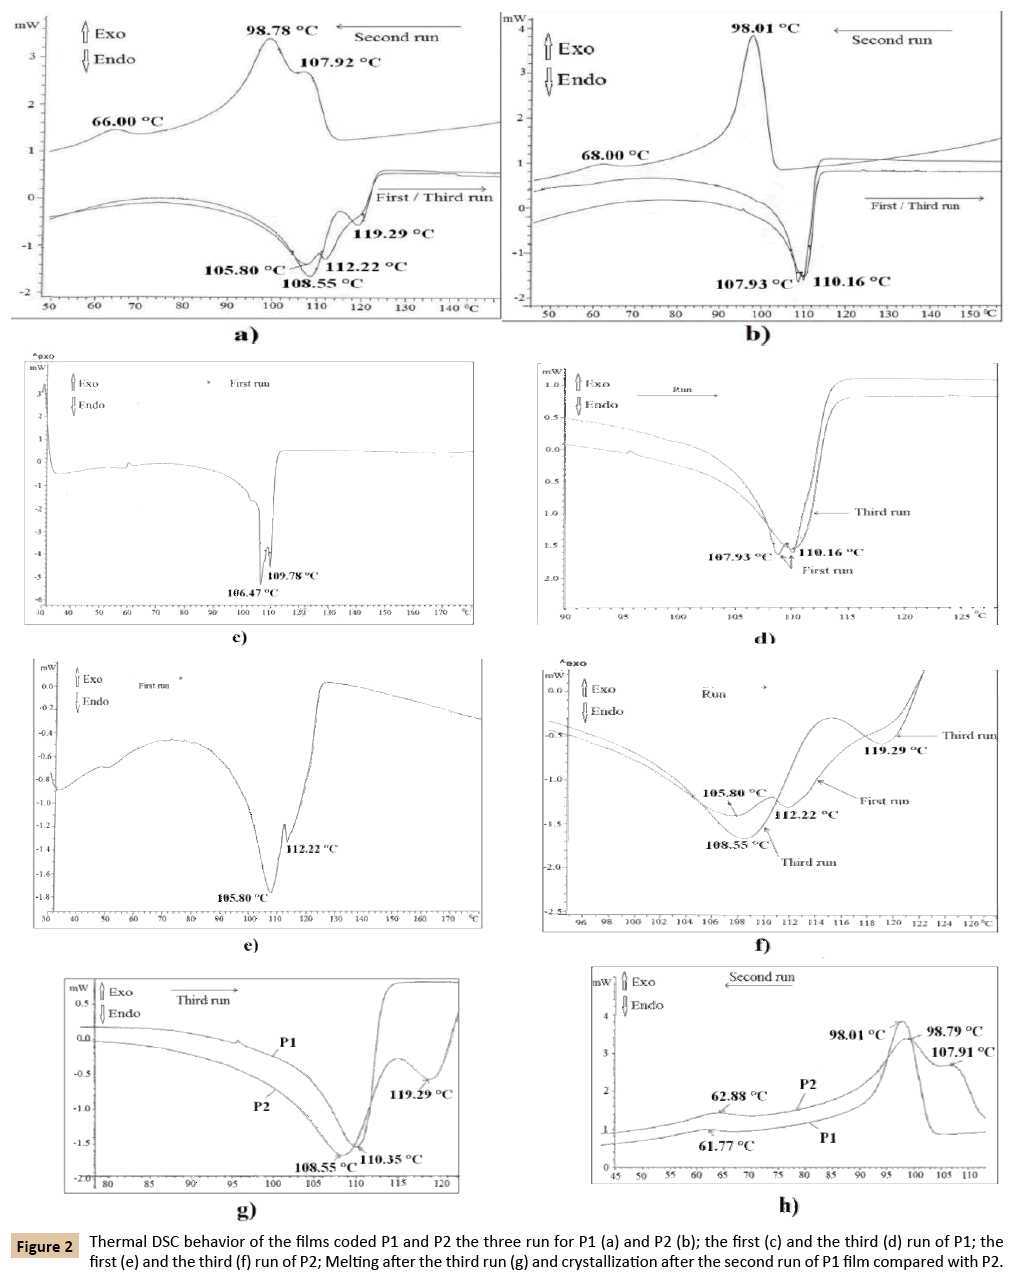
Figure 2: Thermal DSC behavior of the films coded P1 and P2 the three run for P1 (a) and P2 (b); the first (c) and the third (d) run of P1; the first (e) and the third (f) run of P2; Melting after the third run (g) and crystallization after the second run of P1 film compared with P2.
Because after the third run the DSC curves have different profile, one with a single melting peak with maximum at 110.35°C for P1 film and another with two overlapped peaks, one with maximum at 108.55°C and another at 119.29°C in case of P2 film (Figure 2g) it can it can be concluded that the two films P1 and P2 were obtained from different polyolefinic materials. This assumption is strengthened also by the crystallization profile represented by the exothermal peaks generated during the second run of the DSC procedure (Figure 2h).
The main exothermal process of these two films described by the second run (Figure 2a, 2b and 2h) occurs in a single stage described by the peaks with maximum at 98.01°C for P1 film and with two overlapped peaks with two maximums, one at 107.91°C and another at 98.79°C in case of P2 film. For both films, there is still another small exothermal peak, with a maximum at about 61°C-62°C generated probably by the crystallization of decomposed initiator residue which was used in synthesis process.
The thermograms of the P3 and P4 films have two overlapped distinct, endothermal peaks (Figure 3a), two main overlapped exothermal peaks and also a secondary one at a lower temperature (Figure 3b). The two endothermal maximum are registered at about 109.24°C and 123.15°C in the case of P3 film and at 108.80°C and 118.22°C for P4 film (Figure 3a). In the case of the P3 films, the two main exothermal peaks are registered at 110.86°C and 97.20°C and the second one at 61.41°C (Figure 3b). The similar exothermal peaks of the P4 film are registered at 104.48°C and 97.20°C as the main peaks and at 61.55°C the secondary those. The endothermal peaks registered at a temperature higher than 100°C is narrower and higher for the blend which contains LD-PE and HD-PE (P3 - Figure 3b) and of smaller sizes for those based on LD-PE and LLD-PE (P4 - Figure 3b).
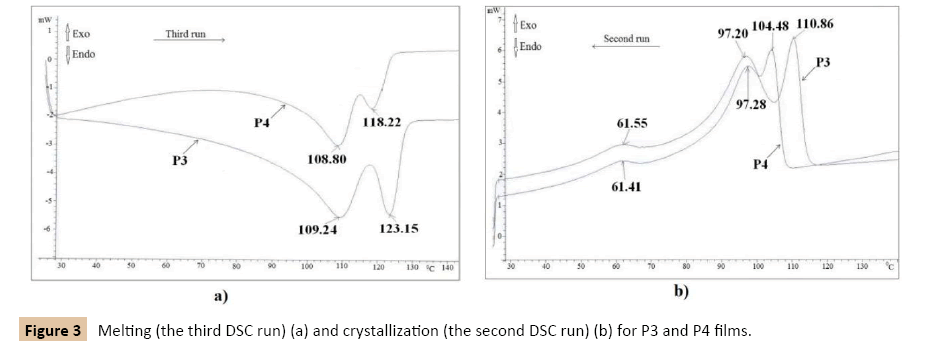
Figure 3: Melting (the third DSC run) (a) and crystallization (the second DSC run) (b) for P3 and P4 films.
The following obtained results show a high dependence of melting and crystallization temperatures, of density and melt flow index on the type of polyolefins. The maximum of the endothermal peak (Figure 4a) occurs at increasing temperatures, from LD-PE to HD-PE via LLD-PE because in this order increase the density of these main POs. LD-PE with a density of 0.913 g/ cm3 and MFI of 1.88 g/10 min melts at 111.15°C. LLD-PE1 which has 0.93 g/cm3 density and 0.624 g/10 min MFI melts at 125.50°C and LLD-PE2 with a density of 0.92 g/cm3 and MFI of 0.83 g/10 min melts at 122.78°C. HD-PE1 with a density of 0.958 g/cm3 and MFI 0.232 g/10 min melts at 131.98°C and HD-PE2 with a density of 0.951 g/cm3 and MFI of 0.504 g/10 min melts at 126.79°C. In reverse order decreases the temperature of the exothermal peak which describes the crystallization as follows: HD-PE, LLD-PE and LD-PE. Crystallization temperature is of 116.39°C for HD-PE with a density of 0.958 g/cm3 and of 115.35°C for HD-PE with a density of 0.951 g/cm3. This temperature is of 107.63°C for LLD-PE with a density of 0.92 g/cm3 and 106.36°C for LLD-PE with a density of 0.93 g/cm3. LD-PE with a density of 0.915 g/cm3 crystallizes at 95.75°C. All studied polyolefins present also a second smaller peak of crystallization with a maximum which varies in a small range from 58°C for LD-PE, 63°C for LLD-PE and 66°C for HD-PE (Figure 4b). All the above presented results were summarized in Table 1.
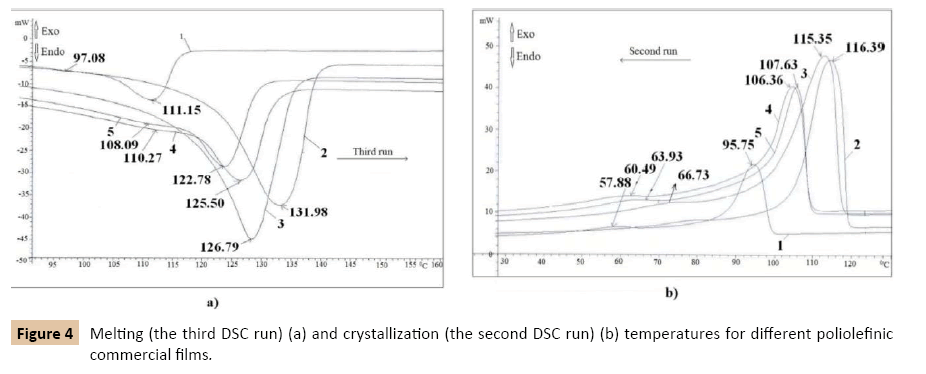
Figure 4: Melting (the third DSC run) (a) and crystallization (the second DSC run) (b) temperatures for different poliolefinic commercial films.
Table 1: Thermal behavior and some physical properties of analyzed polyolefins.
| Samplecode |
MeltingxT, °C, main peak |
Crystallization2xT, °C, main peak |
Density, g/10 min |
MFI,g/10min |
| P1 |
110.35 (Figure 2) |
98.01 (Figure 2) |
0.91 |
|
| P2 |
108.55-119.29 (Figure 2) |
107.91(shoulder)-98.01(Figure 2) |
0.916 |
|
| P3 |
109.24-123.15 (Figure 3) |
110.86-97.28(Figure 3) |
0.93 |
|
| P4 |
108.80-118.22 (Figure 3) |
104.48-97.20 (Figure 3) |
0.915 |
|
| LD-PE |
111.15 (Figure 4) |
95.75 (Figure 4) |
0.915 |
1.88 |
| HD-PE1 |
131.98 (Figure 4) |
116.39 (Figure 4) |
0.958 |
0.232 |
| HD-PE2 |
126.79 (Figure 4) |
115.35 (Figure 4) |
0.951 |
0.504 |
| LLD-PE1 |
125.50 (Figure 4) |
107.63 (Figure 4) |
0.93 |
0.624 |
| LLD-PE2 |
122.78 (Figure 4) |
106.36 (Figure 4) |
0.92 |
0,830 |
xAfter the third run; x2After the second run.
Physical properties of polyethylenes as density, crystallinity and melting temperatures as well mechanical properties mainly depend on molecular weight, molecular weight distribution and branching degree of macromolecules [19-28]. The density of polyethylene is lower as the branching is higher and the branches are shorter. Higher density is associated with lower number of branches [27]. Commonly, the PE density is ranked as 0.86-0.97 g/cm3, the crystallinity varies between 25-85% and melting temperatures have values from 108°C to 180°C [29,30]. The macromolecules of polyethylenes and their copolymers can develop branches, bigger or smaller in direct relation of the used co-monomers (the more used octane, butene, hexane, butenehexene mixture) and the used polymerization methods (Figure 5) [23,27]. Due to its very low level of branching HD-PE is sometimes referred as linear polyethylene with high crystallinity and density.
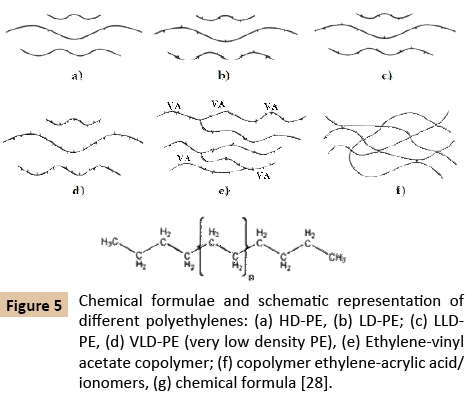
Figure 5: Chemical formulae and schematic representation of different polyethylenes: (a) HD-PE, (b) LD-PE; (c) LLDPE, (d) VLD-PE (very low density PE), (e) Ethylene-vinyl acetate copolymer; (f) copolymer ethylene-acrylic acid/ionomers, (g) chemical formula [28].
In LD-PE the ethyl and butyl branches are frequently clustered together, separated by lengthy runs of unbranched backbone. The long-chain branches can themselves in turn be branched. LLD-PE consists of molecules with the linear backbone to which are attached short alkyl groups at random intervals. The branches can be ethyl, butyl, hexyl or other alkyl groups, both linear and branched [23,27-29].
Molecular weight affects the polymer's crystallinity and is reflected by MFI in an inverse proportionality relationship. The MFI reveals the melt fluidity and generally is used as a preliminary approximation of melt processability [30,31].
The thermal history influences the mechanical properties of polymeric materials mainly because of crystallization [32-34]. If a polymeric sample was cooled in three different conditions, very slowly, shocked cooled, shocked cooled and annealed than the glass transition and crystallization behavior depends on the own cooling conditions of each sample [32]. The sample that was slowly cooled shows only a small step at the glass transition and no cold crystallization-sufficient time was available for the sample to crystallize and so the content of the amorphous material is low. The shock-cooled sample shows a large glass transition step. This indicates that the amorphous content is high. Furthermore, a cold crystallization peak is observed because the sample did not have sufficient time to crystallize. In practice, heating-coolingheating experiments are used to eliminate the thermal history of materials after its melt processing into different goods and to determine the real thermal behavior of material [34].
The first heating provides information on the materials after its melt processing and the second heating (third run) gives information only on the material glass transition (Tg) and its melting temperature (Tm) [35], without the effect of processing [34,36]. In order to compare the thermal behavior of polymeric materials is necessary to eliminate the influence of thermal history. If the DSC thermal behavior was recorded after a cycle of heating (first run) – cooling (second run) – heating (third run) than the obtained thermograms reveal the material melting with (first run), without (third runs) thermal history and on its crystallization (second run).
All the above presented data explain very well all the experimentally obtained results. LD-PE has the lowest density, melting and crystallization temperature because is a highly branched polymer (Figure 5). The more the branching degree decreases with both the density and crystalline increase. For this reason, the two analyzed LLD-PE have a little higher density, melting and crystallization temperatures. As consequence of its lower branching degree, the HD-PE has the biggest density, melting temperature, and crystallization temperature. If LD-PE with Tm of 111.15°C was compounded with HD-PE with a melting point of 126.79°C the resulted blend (P4) melts into a wide range with two maximum one at 123.15°C very close to the Tm of HDPE and other at 109.24°C which is Tm of the used LD-PE. This blend has also two crystallization temperatures and other physical properties very close to the crystallization temperature of the two polymers from the blend. If LD-PE with Tm of 111.15°C was compounded with LLD-PE with a melting point of 122.78°C the resulted blend (P3) melts into a wide range with two maximum one at 118.22°C very close to the Tm of LLDPE and the other at 109.24°C which is even the Tm of LD-PE. This blend has also two crystallization temperatures which are much closer to the crystallization temperature of the two polymers from the blend. Considering the MFI values and its relationship with molecular weight is easy to be observed that the molecular weight of the studied samples increases in the following order LD-PE
The film coded as P1 seems to behave, after the second heating (third run) as LD-PE because its density and melting temperature have values from a range of variation which characterizes this polymer. P1 melts within a single and narrow endotherm peak with a maximum at about 100.35°C and crystallizes with a single main crystallization peak with a maximum at 98.01°C. If the identification of this film would have made considering the first DSC run then the conclusion would have been different, respectively that P1 behaves as a polyolefin blend.
The second film coded as P2 seems to be obtained from a compound of LD-PE with LLD-PE because it melts within a wide exotherm with two maximum, one at 108.55°C value which is the Tm of LD-PE and the other at 119.29°C, the temperature at which LLD-PE melts. At crystallization, the P2 film presents also an exotherme with two maximum peaks at a temperature at which crystallize the two polymers from the blend. The same conclusion was obtained from all the other measured properties. If the identification of this film would have made considering the first DSC run then would have been impossible to identify the type of the polyolefins used in obtaining of this film.
Conclusions
The paper reveals as a novelty, that in the case of post-consumer goods which have not been marked at fabrication with the recycling code, the identification of polymer from blends used to obtain these goods must rely on combined methods of measuring physical properties which mainly make the difference between the different classes of polymers. FTIR alone cannot be used in different polyolefins identifications because the main structural differences regarding the number and type of branching generate small changes of FTIR spectrum. Also, the use of DSC by a simple thermograms recording cannot be used to identify the polymers from blends and compounds because of the material thermal history which changes the material morphology (crystallinity in the case of POS) and so glass transition, melting and crystallization temperatures.
The differences between the melting and crystallization temperatures before and after elimination of the material’s thermal history are directly connected with morphological differences generated by previous thermal treatments of the polymeric material as melt processing into finished products. In order to identify polymers from various compound melt processed into goods for different application, the DSC analysis must be performed after removing the material thermal history induced by processing into finished product. FTIR and DSC analyze after removing the material’s thermal history, associated with other methods of measuring those physical properties which highlight the main differences between the polyolefin materials as density and melt flow index, proved to be a good method for identifying the polyolefins used to obtain the materials which were melt processed as films for food packages.
References
- https://www.plasticsrecyclers.eu/mechanical-recycling.
- https://www.plasticsrecyclers.eu/events/plastics-recyclers-annual-meeting-2017.
- Hopewell J, Dvorak R, Kosior E (2009) Plastics recycling: challenges and opportunities. Philosophical Transactions of the Royal Society of London B: Biological Sciences 364: 2115-2126.
- Rusu M, Staicu Doina (1989) Valorificarea resurselor polimerice secundare. ISBN 973-31-0004-8,Tehnica, Buc.
- Scheirs J (1998) Polymer recycling: science, technology and applications. John! Wiley & Sons Ltd, Journals, Baffins Lane, Chichester, Sussex PO 19 1 UD, UK, 591.
- Burillo G, Clough RL, Czvikovszky T, Guven O, Le Moel A, et al. (2002) Polymer recycling: potential application of radiation technology. Radiation Physics and Chemistry 64: 41-51.
- Tim Shestek (2009) Successes and Chalanges for Palstic Recycling, Americal Chemistry Council.
- https://www.lotfi.net/recycle/plastic.html.
- HegbergBruce (1992) Mixed Plastics Recycling Technology. ISBN 0-8155-1297-X, USA, Noyes Data corporations.
- Sarı A (2004) Form-stable paraffin/high density polyethylene composites as solid–liquid phase change material for thermal energy storage: preparation and thermal properties. Energy Conversion and Management 45: 2033-2042.
- Mehrjerdi AK, Adlâ€ÂÂÂÂZarrabi B, Cho SW, Skrifvars M (2013) Mechanical and thermoâ€ÂÂÂÂphysical properties of highâ€ÂÂÂÂdensity polyethylene modified with talc. Journal of Applied Polymer Science 129: 2128-2138.
- Scott DM (1995) A two-colour near-infrared sensor for sorting recycled plastic waste. Measurement Science and Technology 6: 156.
- Eisenreich N, Rohe T (2000) Infrared spectroscopy in analysis of plastics recycling. Encyclopedia of Analytical Chemistry.
- Masoumi H, Safavi SM, Khani Z (2012) Identification and classification of plastic resins using near infrared reflectance spectroscopy. World Academy of Science, Engineering and Technology, International Journal of Mechanical, Aerospace, Industrial, Mechatronic and Manufacturing Engineering 6: 877-884.
- Hulse S (2000) Plastics product recycling: a Rapra industry analysis report. iSmithers Rapra Publishing.
- https://www.impact-solutions.co.uk/revealing-identity-mixed-recycled-plastics-using-differential-scanning-calorimetry-dsc/.
- Camacho W, Karlsson S (2001) NIR, DSC, and FTIR as quantitative methods for compositional analysis of blends of polymers obtained from recycled mixed plastic waste. Polymer Engineering & Science 41: 1626-1635.
- TA Instruments, Thermal Analysis & Rheology, Thermal Analysis Application, Brief Determination of Polymer Crystallinity by DSC, Number TA-123.
- Kong Y, Hay JN (2002)The measurement of the crystallinity of polymers by DSC. Polymer 43: 3873-3878.
- ASTM D (2004) 1238-04c-Standard Test Method for Melt Flow Rates of Thermoplastics by Extrusion Plastometer. Current edition approved Dec 1: 1-14.
- Kaivalchatchawal P, Suttipitakwong P, Samingprai S, Praserthdam P, Jongsomjit B (2011) The Influence of Comonomer on Ethylene/α-Olefin Copolymers Prepared Using [Bis (N-(3-tert butylsalicylidene) anilinato)] Titanium (IV) Dichloride Complex. Molecules 16: 1655-1666.
- Cruz VL, Muñoz–Escalona A, Martinez–Salazar J (1998)A theoretical study of the comonomer effect in the ethylene polymerization with zirconocene catalytic systems. Journal of Polymer Science Part A: Polymer Chemistry 36: 1157-1167.
- Malpass DB (2010) Introduction to industrial polyethylene: properties, catalysts, and processes (Vol. 45), John Wiley & Sons.
- Spiegelberg S, Kozak A, Braithwaite G (2015) Characterization of physical, chemical, and mechanical properties of UHMWPE. In UHMWPE Biomaterials Handbook (3rdedn), pp: 531-552.
- Hlatky GG, Turner HW, Eckman RR (1989) Ionic, base-free zirconocene catalysts for ethylene polymerization. Journal of the American Chemical Society 111: 2728-2729.
- Arrakhiz FZ, El Achaby M, Kakou AC, Vaudreuil S, Benmoussa K, et al. (2012) Mechanical properties of high density polyethylene reinforced with chemically modified coir fibers: impact of chemical treatments. Materials & Design 37: 379-383.
- Peacock A (2000) Handbook of polyethylene: structures: properties, and applications. CRC Press.
- Kaminsky W (2013) Polyolefins: 50 years after Ziegler and Natta II. Polyolefins by Metallocenes and Other Single-Site Catalysts, 1.
- Othman AM (2010) Effect of low-density polyethylene on fracture toughness of asphalt concrete mixtures. Journal of Materials in Civil Engineering 22: 1019-1024.
- Vasile C (2006) Practical Guide to Polyethylene. Rapra Technology.
- Shenoy AV, Saini DR (1996) Thermoplastic melt rheology and processing.
- Hao KA, Cao HL, Fan Z, Teng JG, Zhou LM (2011) The effect of thermal history on mechanical properties of woven basalt fabric reinforced poly (butylene terephthalate) composites. In Jeju Island, Korea: The 18th international conference on composite materials.
- Jordens K, Wilkes GL, Janzen J, Rohlfing DC, Welch MB (2000) The influence of molecular weight and thermal history on the thermal, rheological, and mechanical properties of metallocene-catalyzed linear polyethylenes. Polymer 41: 7175-7192.
- Van Melick HGH, Govaert LE, Meijer HEH (2003) Localisation phenomena in glassy polymers: influence of thermal and mechanical history. Polymer 44: 3579-3591.
- Chan CH, Chia CH, Thomas S (2014) Physical chemistry of macromolecules: macro to nanoscales. CRC Press.
- Menczel JD, Prime RB (2014) Thermal analysis of polymers: fundamentals and applications. John Wiley & Sons.