Introduction
Child hood obesity is a current global public health concern [1]. This condition is caused by an imbalance in the caloric intake and utilization in children, resulting in excess weight in the affected [1]. Causes of obesity in children may be varied including genetic, environmental, behavioural causes. Child hood obesity significantly increases the risk of certain chronic diseases in children and most of these diseases and problems are carried into adulthood, significantly reducing the length and or quality of life of the children. Obesity prevention can be a major role of primary providers in children. Such care should include the clinical and community component.
Body Mass Index (BMI) for adolescents and children is the measure used to assess the body fat and approximates the ideal weight for a person, considering the sex and age. The weight and height are used to calculate this figure which is classified as obese, overweight, normal weight and underweight. Since children grow with age and not all such growth is body fat, their BMI is compared with age and sex related percentiles within the ages of two to twenty.
The Centres for Diseases Control and Prevention (CDC) standard for BMI in children and adolescents is as follows
“Underweight: Less than the 5th percentile;
Healthy weight: 5th percentile to less than the 85th percentile
Overweight: 85th to less than the 95th percentile
Obese: Equal to or greater than the 95th percentile.”
Purpose of the Study
This study is designed planned to assess the effect of racial and ethnic background on childhood obesity in the United States in relation to racial background.
Significance of the Study
Studies have shown that proper diet and adequate physical activity are essential for reducing obesity in children [2]. This research seeks to assess extent of childhood obesity and the impact of ethnic backgrounds on these trends. This will provide evidence based results which can guide further interventions and policies to prevent and manage childhood obesity in the United States, ultimately leading to disease prevention and healthier children in the country.
Data set to be used
The data set to be used for this research is obtained from the website of the Centre for Diseases Control and Prevention. Specifically the Data Resource Center for Child and Adolescent Health will be used. Data relied on will be from the 2011/12 National Survey of Children's Health – BMI status for children 10–17 years (Retrieved from https://childhealthdata.org/ browse/survey/results?q=2612&r=1.)
Literature Review
Childhood obesity has been increasing in recent years in both developed and developing countries and said to have reached epidemic proportions in the U.S. with up to 33% of American children were found to be either obese or overweight in 2009 [1,3,4].
Obesity is caused by an imbalance in the intake and utilization of calories, usually from carbohydrates and fats [1]. Effects of obesity in children can be viewed from two perspectives – the short term effects with physical and psychological problems in childhood; and the long term with marked pathologies progressing and manifesting in adult life. Physical effects may include cardiovascular diseases, Type 2 diabetes, rheumatism, and stroke while physiological effects may include stigma and discrimination, low self-esteem, depression and even suicide [1].
The standard measure for pediatric weight is the measurement of Body Mass Index (BMI). It is a comparison of weight and height which is compared with the standard age sex BMI percentiles which is both an anthropological measures are well as a marker of short and long cardiovascular risk [1]. When the BMI of children (aged 2 to 19) is within the 95th percentile for their age and weight, they are said to be obese [1].
Factors Affecting Obesity
Huen, Harley, Beckman, Eskenazi1 & Holland describe the place of genetics in obesity while Karnik & Kanekar had earlier described obesity as having behavioural, environmental as well as genetic causative factors of obesity [1,4].
Behavioral factors
Behavioural factors include dietary and physical contributions. Obesity may be enhanced in children due to food portions are too large, too sugary or too energy rich.
Physical activity contributions are usually due to a lack of or insufficient exercise which may result from lack of safe environment for exercise or a sedentary lifestyle such as the excessive watching of television or playing of computer games. This is usually worsened by consumption of snacks as well as motivations by television commercials motivating the consumption of unhealthy meals [1].
A study by Carlson et al. [5] followed up children aged 6 to 9 for 24 months assessing the effects of diet and physical activity on their BMI. Decrease in BMI was associated with increase in number of breakfasts taken with parents and self-reported physical activity. Decrease in body fat was also associated with decrease in sedentary behaviour and decrease in consumption of high sugar sweetened drinks. This study pointed to the need to consider body fat as a potentially more accurate measure of adiposity [5]. Although 48% of the respondents were of Latino descent, the effect of ethnicity on the results was not clearly stated.
Another study by Boyle, Jones and Walters [2] in England compared self-reported dietary and physical activity with national standards and found out that irrespective of the area of study, the children and adolescents aged 11 to 16 were engaged in less than the required 60 minutes of moderate to rigorous physical activity and the BMI status was worsening over time.
Foods that have low glycemic index, releasing glucose slowly over time have been advocated for obesity prevention in preference to ‘low-fat energy restricted diets’. Kong et al. [6] conducted a systematic review of available data and concluded on the need to have well designed randomized controlled trials to assess the impact of Low GI foods on cardiovascular health and obesity.
Environmental factors
Environmental factors include the role models and habits of parents and other people within their environments which largely affect their diet. Some environments have limited or no access to healthy foods due to cost or physical locations [1]. These actively contribute to obesity in children.
Genetic factors
Genetic factors have also been indicated in pediatric obesity. This may be affected by hereditary contributions from parents including variations in fat and carbohydrate metabolism [1].
Paraoxonase 1 (PON1)
The enzyme PON1 has been demonstrated to be related to obesity in adults and children. Since PON1 polymorphism varies with racial differences and obesity ancestry information markers were used for the study [4]. The study revealed higher likelihood of obesity in PON1192QQ children compared to PON1192RR children at two and five years. Findings from their study suggested a role of PON1 in obesity characteristics irrespective of genetic ancestry.
Adiponectin
Adiponectin is a hormone found in adipocytes and found to be in high concentration where there is low fat retention. It is regulates glucose metabolism and increases sensitivity to insulin [7]. Earlier researches had demonstrated clear links of Adiponectin to obesity in adults. This study showed “clear links between Adiponectin and features of the metabolic syndrome in obese children and adolescents” [7]. It will be useful to research into the distribution of this fat regulating hormone in various racial and ethnic groups as compared with rates of obesity.
Strategies for Obesity Control
Various strategies have been used for obesity control in children. There have been school based, community based, clinic based, play based and family based interventions [1]. All these interventions have been found to have beneficial effects on obesity reduction and government policies to support obesity prevention and management are crucial in reducing childhood obesity and sustaining the gains of such intervention [1].
A randomized controlled trial was conducted where a school based intervention with moderate to vigorous physical activity, healthy snacks and educational enrichment programs was provide to 206 students in 18 schools [2]. The program was shown to have significant improvement on body fat and physical fitness. However the positive results were lost after the holidays, demonstrating the need for a multi-pronged and sustained intervention [2]
Primary care providers in obesity prevention and management
An assessment in 2008 by Vine et al. revealed that primary care providers were not doing enough in prevention and management of pediatric obesity [3]. The study assessed the possible roles of primary health care providers in preventing and treating childhood obesity. They conducted a literature review of 96 sources on the subject matter within clinics and communities and identified nine evidence based opportunities for interventions or enhanced roles by primary providers. These were “weight status assessment and monitoring, healthy lifestyle promotion, treatment, clinician skill development, clinic infrastructure development, community program referrals, community health education, multisectorial community initiatives, and policy advocacy” [3].
Ethnic and Racial Effects on Obesity
Ethnicity and racial background have been clearly demonstrated affect rates of obesity and this is seen from early childhood [8]. According to Huen et al. [4], minorities such as Mexican Americans are disproportionately affected by obesity. Many factors affect racial obesity differences. This includes cultural differences, perception of appearance and body image, diet and nutrition, physical activity as well as leisure activities such as watching television or outdoor sports [8].
The socio economic and geographical background of the populations may also affect ethnic obesity disparities. Suggestions to reduce childhood obesity include very early prevention of obesity including the use of culturally acceptable and linguistically understood education materials and media of communication [8]. The use of primary care providers is also advocated for the education of parents and care givers early in children’s lives to minimize the onset of obesity or overweight in children [8].
Strong relationship between BMI and body fat have been established but Affuso, Bray, Fernandez and Casazza [9] noted inconsistencies in BMI correlation across ethnic and racial lines. Their study sought to assess racial and ethnic differences in the BMI percentiles across “nationally representative sample of non-Hispanic White, non-Hispanic Black, and Mexican American children and adolescents.”
Using data from NHANES 2001 – 2004, 5743 were assessed and results showed lower body fat in non-Hispanic Blacks when compared with non-Hispanic Whites and Mexican Americans the lowest body fat in black boys and girls compared to all other races/ethnicities. The authors concluded that reliance of BMI as measure of adiposity may not be very accurate due to the different interpretations of BMI with relation to adiposity depending on racial status. In other words a higher BMI in a black child may be less indicative of obesity compared to other races [9]. The result of this study is similar to that of Jordan et al. [5] who concluded that body fat is a potentially more precise measure of adiposity than BMI.
Wang, Gortmaker and Taveras [10] studied ‘Trends and racial/ethnic disparities in severe obesity among US children and adolescents, 1976-2006.’ Using data obtained from NHANES, 15 980 children in the US aged 2 to 19 were studied. Severe obesity was defined as ‘35 kg/m2 or 120% of the ageand sex-specific 95th percentile on the CDC reference standards. There were differences seen in the prevalence rates of obesity among races with highest rates of obesity were observed Hispanic boys and Non-Hispanic black girls. A study in England by Higgins & Dale however found no significant differences in obesity when racial and ethnic backgrounds were considered. Parental weight and obesity was found to be a stronger predictor of childhood obesity compared with ethnicity [11].
Rationale for the study
Literature sources searched have revealed some significant studies and reviews on obesity in children. Some studies have highlighted rates of obesity across various ethnic or racial groups. However I have not identified a study that followed obesity rates and trends in children in the United States across racial/ ethnic divides.
This research will attempt to assess obesity using the BMI status of children by racial divides and assess the trends of BMI changes among children in the United States.
Methods
Study design
This study is a retrospective observational design. The research studies the participants as they occur in nature, without any manipulation, treatment or intervention [12]. It is a cross-sectional survey design in that it utilizes data collected at one point in time. The design relies on data collected during a structured United States surveys – The 2011 National Survey of Children’s Health [13].
The National Survey of Children’s Health survey is developed by the Maternal and Child Health Bureau, the National Center for Health Statistics (NCHS) and a national technical expert panel. The Centres for Diseases Control and Prevention recommends the use of the BMI-for-age which is gender and age specific for assessing underweight, overweight and obesity in children and teens due to the differences in body fatness changes through the growing years and across the sexes. BMIfor- age is expressed as a percentile and obtained from a graph or percentile calculator which compares the child’s BMI to similar data collected in previous national surveys.
Due to errors in self-reported height and weight measures in previous studies, BMI for children under 10 were not included and this study indicator is limited to children aged 10 to 17. In addition, the children were assumed to be at the mid-point of the years reported since BMI-for-age is reported in months. Unknown values such as responses like don’t know or refused were removed from the denominator.
Parsimony guided the choice of this research method. Being a literature review, the existing data source provides required data without going beyond what is necessary [12]. Datasets are available in the public domain and data sets received through questionnaires which had been approved by relevant Institutional Review Boards.
Study variables and measures
The independent variables studied were race/ethnicity (nominal variable), gender (dichotomous) and parents educational level (ordinal) while the dependent variable was obesity, defined as underweight (<5 BMI percentile), healthy weight (5-84% BMI percentile)overweight (>85 BMI percentile) (ordinal). Race/ethnicity was defined as Hispanic, Non- Hispanic white, Non-Hispanic Black and other Non-Hispanic.
Study participants
The study is focused on obesity in children. Study population or participants are children living in the 50 States of the United States of America aged between 10 and 17 years of age. Of an estimated population of 31,706,183, the total number sampled (cell size) as 43,864 comprising 2,503 underweight, 28,573 healthy eight and 12,788 overweight or obese children.
Data analysis
The data set used was retrieved from the website of Data Resource Center for Child and Adolescent Health which is a project of the Child and Adolescent Health Measurement Initiative (CAHMI). The 2011 National Survey of Children’s Health was assessed and data on childhood obesity identified. The predictor variables were ethnicity, gender and highest educational level of parents while the outcome variable was obesity. Ethnicity was defined as Hispanic, Non-Hispanic white, Non-Hispanic Black and other Non-Hispanic; gender was defined as male or female; while highest educational level of adults in households were defined as less than high school education, high school graduate and more than high school graduate. The outcome or dependable variable obesity was defined as overweight (>85 BMI percentile), underweight (<5BMI percentile) and healthy weight (5-84% BMI percentile).
Data analysis for health promotion does not have to be complex and simple descriptive statistics may be adequate [12]. Descriptive statistics was used to analyze the quantitative data obtained. Frequency tables were generated and means of variables were calculated using Microsoft Excel packages across the various States. Means were identified as the measure of central tendency. Two dimensional histograms were generated for pictorial representation.
The use of descriptive statistics may be considered some limitation as statistical significance of results obtained could not be determined. However the method provided a clear description of the situation from which useful inferences can be made. Further research which involves statistical calculations is recommended.
Results
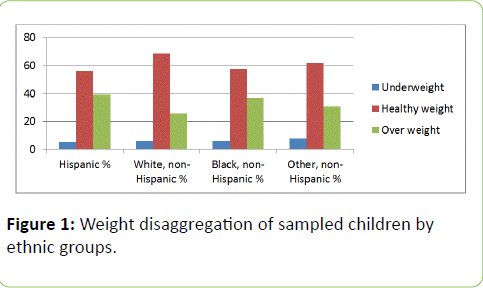
Figure 1: Weight disaggregation of sampled children by ethnic groups.
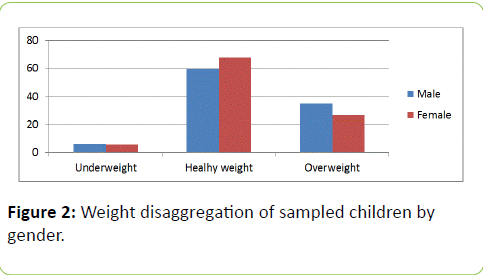
Figure 2: Weight disaggregation of sampled children by gender.
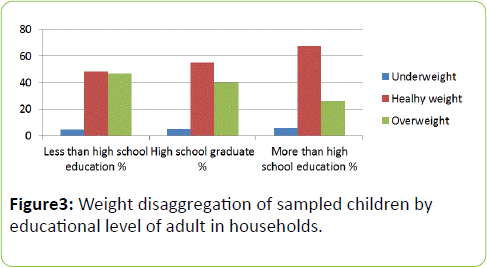
Figure 3: Weight disaggregation of sampled children by educational level of adult in households.
Figure 4: Weight disaggregation of sampled children by educational level of adult in households.
| |
|
Underweight (less than 5th percentile) |
Healthy weight (5th to 84th percentile) |
Overweight or Obese (85th percentile or) |
| |
Region |
Hispanic% |
White,non-Hispanic% |
Black, non-Hispanic% |
Other,non-Hispanic% |
Hispanic% |
White,non-Hispanic% |
Black, non-Hispanic% |
Other,non-Hispanic% |
Hispanic% |
White,non-Hispanic% |
Black, non-Hispanic% |
Other,non-Hispanic% |
| 1 |
Alabama |
0 |
9.8 |
2.3 |
10.8 |
71.5 |
62.7 |
47.6 |
62.9 |
28.5 |
27.5 |
50 |
26.3 |
| 2 |
Alaska |
0.7 |
3.9 |
0 |
5.4 |
52.6 |
73.7 |
72.7 |
57.1 |
46.7 |
22.5 |
27.3 |
37.5 |
| 3 |
Arizona |
5.4 |
6.4 |
10.6 |
4.3 |
44.4 |
69.9 |
59.4 |
53.6 |
50.2 |
23.7 |
30 |
42.1 |
| 4 |
Arkansas |
3.7 |
4.7 |
7.8 |
9.5 |
50.4 |
65.3 |
44.7 |
69.2 |
45.9 |
30 |
47.4 |
21.3 |
| 5 |
California |
6.2 |
10.4 |
6.3 |
18.6 |
55 |
69.5 |
60 |
54.9 |
38.8 |
20.1 |
33.7 |
26.5 |
| 6 |
Colorado |
8.2 |
7.3 |
2.6 |
8 |
56.6 |
73.1 |
65.8 |
80.7 |
35.2 |
19.6 |
31.6 |
11.3 |
| 7 |
Connecticut |
1.8 |
4.7 |
7.1 |
8.5 |
49.9 |
70.6 |
49.3 |
64.2 |
48.3 |
24.7 |
43.6 |
27.3 |
| 8 |
Delaware |
0.4 |
8.2 |
2.3 |
1.5 |
50.9 |
64.5 |
59.5 |
69 |
48.7 |
27.3 |
38.2 |
29.6 |
| 9 |
District of Columbia |
0.3 |
1.2 |
4.9 |
20.2 |
62.9 |
92.8 |
53.6 |
77.9 |
36.8 |
6.1 |
41.5 |
1.9 |
| 10 |
Florida |
3 |
4.3 |
6.2 |
3.8 |
61.9 |
71.4 |
61.9 |
80.2 |
35.1 |
24.3 |
31.9 |
16 |
| 11 |
Georgia |
2.4 |
4.3 |
2.6 |
8.3 |
54.1 |
72.5 |
51.3 |
55.7 |
43.5 |
23.3 |
46.1 |
36 |
| 12 |
Hawaii |
8.8 |
11.3 |
3 |
6.4 |
60.4 |
74.6 |
78.4 |
62.7 |
30.8 |
14.2 |
18.7 |
30.9 |
| 13 |
Idaho |
4.8 |
5.2 |
0 |
11.4 |
57.7 |
68.8 |
71.4 |
56.9 |
37.5 |
26 |
28.6 |
31.7 |
| 14 |
Illinois |
4.4 |
4.9 |
2.5 |
15.3 |
62.1 |
63.9 |
51.9 |
66.7 |
33.5 |
31.2 |
45.5 |
18.1 |
| 15 |
Indiana |
0.2 |
5.7 |
1.4 |
18.6 |
62.7 |
63.7 |
58.5 |
56.3 |
37.1 |
30.5 |
40 |
25 |
| 16 |
Iowa |
4.1 |
7.3 |
0 |
9.5 |
44.8 |
66.6 |
74.8 |
58 |
51 |
26.2 |
25.2 |
32.6 |
| 17 |
Kansas |
4.6 |
6.2 |
1.1 |
4.7 |
41.2 |
71.4 |
64.1 |
48.2 |
54.3 |
22.4 |
34.8 |
47.1 |
| 18 |
Kentucky |
11 |
4.9 |
10.7 |
0 |
51.6 |
60.9 |
49.7 |
58.2 |
37.4 |
34.2 |
39.6 |
41.8 |
| 19 |
Louisiana |
9.6 |
5.1 |
4 |
4.7 |
52.8 |
61.6 |
49.4 |
55.1 |
37.6 |
33.4 |
46.6 |
40.1 |
| 20 |
Maine |
1.1 |
5 |
0 |
9.7 |
69.2 |
64.4 |
100 |
67.9 |
29.7 |
30.6 |
0 |
22.4 |
| 21 |
Maryland |
15.8 |
3.6 |
5.7 |
13.2 |
40.1 |
75.8 |
48.3 |
68.9 |
44.1 |
20.7 |
46 |
17.9 |
| 22 |
Massachusetts |
1.3 |
4.6 |
1.5 |
8.8 |
51 |
70.2 |
29.1 |
73.2 |
47.7 |
25.2 |
69.5 |
18 |
| 23 |
Michigan |
2.6 |
4.2 |
4 |
1.2 |
67 |
64.6 |
51.5 |
71.8 |
30.4 |
31.2 |
44.5 |
27.1 |
| 24 |
Minnesota |
6.1 |
7.6 |
7.3 |
6.6 |
49.7 |
68.2 |
64.5 |
55.9 |
44.2 |
24.2 |
28.1 |
37.5 |
| 25 |
Mississippi |
9.2 |
1.8 |
2.3 |
2.5 |
52.8 |
61.6 |
57.9 |
34 |
38 |
36.6 |
39.8 |
63.5 |
| 26 |
Missouri |
0.5 |
6.2 |
2.7 |
17.9 |
64.9 |
66.5 |
52.9 |
60.8 |
34.6 |
27.3 |
44.4 |
21.3 |
| 27 |
Montana |
10.2 |
4.9 |
0 |
8.1 |
69.4 |
68.1 |
63.2 |
50.3 |
20.4 |
27 |
36.8 |
41.6 |
| 28 |
Nebraska |
6.3 |
4.5 |
2.4 |
2.7 |
43.7 |
69.4 |
54.1 |
81.7 |
50 |
26.1 |
43.4 |
15.6 |
| 29 |
Nevada |
2.7 |
5.9 |
2.5 |
6 |
47.2 |
70.5 |
65.7 |
76.8 |
50.1 |
23.6 |
31.9 |
17.2 |
| 30 |
New Hampshire |
5.1 |
7.3 |
0 |
11.2 |
57.6 |
67.3 |
85 |
57.7 |
37.3 |
25.4 |
15 |
31.1 |
| 31 |
New Jersey |
6.6 |
6.4 |
4.4 |
12.2 |
59.6 |
74.9 |
59 |
67.5 |
33.8 |
18.7 |
36.7 |
20.2 |
| 32 |
New Mexico |
8 |
10.3 |
0 |
8.1 |
57.2 |
65.2 |
68.5 |
57.5 |
34.8 |
24.5 |
31.5 |
34.3 |
| 33 |
New York |
4.7 |
6 |
8.4 |
10.6 |
59.5 |
67.4 |
44.6 |
58.3 |
35.8 |
26.7 |
46.9 |
31.1 |
| 34 |
North Carolina |
12.4 |
5.4 |
2.8 |
0.3 |
61.6 |
65.6 |
60.1 |
68.8 |
26.1 |
29.1 |
37.2 |
31 |
| 35 |
North Dakota |
0.8 |
4.8 |
0 |
5.8 |
33.5 |
64.2 |
21.6 |
45.9 |
65.7 |
31 |
78.4 |
48.3 |
| 36 |
Ohio |
8.1 |
3 |
8.5 |
10.7 |
64.2 |
65.7 |
60.6 |
63.4 |
27.7 |
31.4 |
30.9 |
25.9 |
| 37 |
Oklahoma |
3.4 |
4.3 |
3.4 |
8.2 |
58 |
66.5 |
50.9 |
50.7 |
38.6 |
29.2 |
45.7 |
41.1 |
| 38 |
Oregon |
7.4 |
6.5 |
3.7 |
6.3 |
54.5 |
71.1 |
63.6 |
60 |
38.1 |
22.4 |
32.7 |
33.7 |
| 39 |
Pennsylvania |
0.7 |
3.5 |
10.2 |
10 |
53.5 |
73 |
45.9 |
70.3 |
45.8 |
23.5 |
43.9 |
19.8 |
| 40 |
Rhode Island |
8.4 |
5.9 |
8.5 |
16.4 |
51.9 |
70.8 |
50.4 |
50.9 |
39.7 |
23.3 |
41.1 |
32.7 |
| 41 |
South Carolina |
18.6 |
5.8 |
1.2 |
4.3 |
42.8 |
60.3 |
52.1 |
38.5 |
38.6 |
33.9 |
46.7 |
57.2 |
| 42 |
South Dakota |
4.1 |
6.6 |
0 |
2.3 |
66.8 |
71.6 |
79.1 |
45.4 |
29.1 |
21.8 |
20.9 |
52.3 |
| 43 |
Tennessee |
9.6 |
4.2 |
11.2 |
3.2 |
45.5 |
63.7 |
56.5 |
46.8 |
44.9 |
32.1 |
32.4 |
50 |
| 44 |
Texas |
4 |
5.5 |
2.4 |
0.8 |
51.6 |
70.5 |
42.4 |
71 |
44.4 |
24.1 |
55.1 |
28.2 |
| 45 |
Utah |
7.7 |
9.6 |
3.7 |
5.5 |
45.4 |
73.3 |
74.4 |
62.1 |
46.9 |
17 |
21.9 |
32.4 |
| 46 |
Vermont |
8.6 |
5.9 |
5.2 |
4.1 |
68.9 |
69.8 |
52 |
66.6 |
22.5 |
24.2 |
42.8 |
29.2 |
| 47 |
Virginia |
1.8 |
6 |
4.6 |
4.4 |
62.3 |
66.9 |
64 |
65.3 |
35.9 |
27.1 |
31.4 |
30.3 |
| 48 |
Washington |
4.2 |
5.9 |
1.5 |
3.9 |
63.6 |
68 |
66.1 |
77.5 |
32.2 |
26.1 |
32.4 |
18.6 |
| 49 |
West Virginia |
5.5 |
5.4 |
8.6 |
0 |
72.5 |
60.8 |
53.1 |
61.8 |
22 |
33.9 |
38.3 |
38.2 |
| 50 |
Wisconsin |
1.8 |
5 |
2.5 |
9.8 |
54.5 |
66.9 |
59.3 |
76.9 |
43.7 |
28 |
38.2 |
13.3 |
| 51 |
Wyoming |
2.4 |
7.9 |
100 |
9.1 |
58.7 |
67.6 |
0 |
63.7 |
38.8 |
24.5 |
0 |
27.2 |
Table 1: Obesity trends across the regions of the US disaggregated by ethnicity.
Discussion
This study shows that 33.05% of children in the US are overweight. This is in agreement with earlier studies by Vine, Hargreaves, Briefel and Orfield, [3] where it was stated that up to one third of American children are obese.
From the data analysis, there was a clear difference in obesity status by ethnicity across the United States. Higher rates of children being obese were observed among the Hispanic (39%) and non-Hispanic Blacks (37%) with the non- Hispanic Whites having the lowest level of overweight children (25%). Similarly, the highest rates of healthy weight children were found among the non-Hispanic White ethnicity. This data further validates a publication by Huen et al., [4] that minorities such as Mexican Americans are disproportionately affected by obesity. From the graphs, gender did not appear to have significant variation in obesity status. However males were generally more obese than females studied.
The proportion of children having healthy weights clearly increased with increasing education level of adults in households. This indicates the relationship of education with healthy behaviour but may also be a reflection of the socioeconomic status of the family. Effects of environments where children grow up have been documented to affect their rates of obesity [1].
Although the BMI-for-age is not a diagnostic tool, when a child has a high value, it may be a very useful pointer to the need for further assessments such as skinfold thickness measurements, evaluations of diet, physical activity, family history, and other appropriate health screenings to determine if the excess fat poses significant health problems.
Conclusion
This study demonstrated that ethnic background of children in the United States affects their obesity status. Educational background of parents or adults in households also plays a role in the children’s obesity status but gender did not appear to affect childhood obesity in the US.
Policy makers, government, public health and general health practitioners as well as other stakeholders need to develop and implement policies to reduce obesity in children in the US. Special attention should be paid to Hispanic children and non- Hispanic Black children and families at the lower spectrum of educational exposure and socioeconomic status.
Acknowledgements
The Faculty of Public Health, College of Health Sciences, Walden University, USA is acknowledged for their guidance and contributions. The contributions of Dorothy Oqua (PhD), Country Director, Howard University Global Initiative Nigeria is also acknowledged.
References
- Karnik S, Kanekar (2012) A Childhood Obesity: A Global Public Health Crisis. International Journal of Preventive Medicine 3: 1-7.
- Boyle S, Jones G, Walters S (2010) Physical activity, weight status and diet in adolescents: are children meeting the guidelines? Health: 1142-1149.
- Vine M, Hargreaves M, Briefel R, Orfield C (2013) Expanding the Role of Primary Care in the Prevention and Treatment of Childhood Obesity: A Review of Clinic- and Community-Based Recommendations and Interventions. Journal of Obesity.
- Huen K, Harley K, Beckman K, Eskenazi B, Holland N, et al. (2012) Associations of PON1 and Genetic Ancestry with Obesity in Early Childhood. Plos ONE, 8: 1-9
- Carlson J, Crespo N, Sallis J, Patterson R, Elder J, et al. (2012) Childhood Obesity. 8: 110-115.
- Kong AS, Chan R M, Nelson E S, Chan JN (2011) Role of low-glycemic index diet in management of childhood obesity. Obesity Reviews 12: 492-498.
- Jeffery A, Murphy J, Metcalf B, Hosking J, Voss L, et al. (2008) Adiponectin in childhood. International Journal of Pediatric Obesity 3: 130–140.
- Peña M, Dixon B, Taveras E (2012) Are You Talking to ME? The Importance of Ethnicity and Culture in Childhood Obesity Prevention and Management. Childhood Obesity 8: 23-27.
- Affuso O, Bray M, Fernandez G, Casazza K (2010) Standard obesity cut points based on BMI percentiles do not equally correspond to body fat percentage across racial/ethnic groups in a nationally representative sample of children and adolescents. International Journal of Body Composition Research 8 : 117-122.
- Wang Y, Gortmaker S, Taveras E (2011) Trends and racial/ethnic disparities in severe obesity among US children and adolescents, 1976–2006. International Journal of Pediatric Obesity 6: 12-20.
- Higgins V, Dale A (2012) Ethnicity and childhood overweight/obesity in England. Pediatric Obesity 7: e22–26
- Crosby R, DicClemente R, Salazar F (2013) Research methods in health promotion. San Francisco: Jossey-Bass.
- National Survey of Children’s Health (2011).