Research Article - (2025) Volume 12, Issue 2
Quality Function through Linear Programming
Aaron Kusidi Lutete*
Department of Computer Science and Technology, California State University, California, United States
*Correspondence:
Aaron Kusidi Lutete, Department of Computer Science and Technology, California State University, California,
United States,
Email:
Received: 24-Oct-2024, Manuscript No. IPBJR-24-21853;
Editor assigned: 26-Oct-2024, Pre QC No. IPBJR-24-21853 (PQ);
Reviewed: 08-Nov-2025, QC No. IPBJR-24-21853;
Revised: 12-Feb-2025, Manuscript No. IPBJR-24-21853 (R);
Published:
19-Feb-2025, DOI: 10.36648/2394-3718.12.2.144
Abstract
Quality is the most complex word in manufacturing and the world. Some people define quality as conformance. This brings us to find quality as a set of requirements that should be met. Others define quality as user satisfaction. Quality has been a big part of the modern world. Throughout the year many techniques have been developed to achieve and maintain quality. The world of management and engineering has been impacted by the notion of six sigma and lean to monitor quality. Even if monitoring quality has a competitive impact. Some others like Joseph Juran have developed the concept of quality trilogy in total quality management. While total quality management emphasizes multiple tools to monitor or improve quality, our paper will focus on elaborating on a practical technique of planning quality. Quality has for a long time been defined as a variable of performance or reliability. The variable quality has been used to model the production function through methods like aggregate planning. Just like production needs to be planned and monitored, quality can be represented as a function. This research will try to define quality as a function based on parameters and variables using linear programming. We will try to prove that quality is a function defined by the user’s requirement and can be monitored or planned before and after production.
Keywords
Quality; Function; Planning; Linear programming; Variable; Parameter
Introduction
In the manufacturing and business sectors, capacity planning and production planning are essential parts of the management process. Methods like aggregate planning have been developed to forecast quality in an aggregate manner. Aggregate planning overviews the overall requirement for production based on capacity in terms of cost and resources. This method helps the manager to forecast and plan their current and future performance. Quality is used in aggregate planning as a parameter of production or capacity in terms of cost. Aggregate planning is just more than a financial tool, it is also a technical tool that can be used to make technical measurements and to develop instruction strategies to achieve a particular goal. It is used to "optimize manufacturing by minimizing costs of operations and increasing productivity''. In the modern world, quality is a measure of customer satisfaction with a product or a service''. Because quality can be measured, it can be defined as a parameter of customer satisfaction. Based on that assumption, we can generate an aggregate function of quality which can be used to plan quality and to reduce the cost of quality in the production. Many techniques have been developed to model quality function. "The Kano model is widely applied as a useful tool for understanding customer needs and analyzing the effect of meeting customer needs on customer satisfaction levels." Most of the quality planning methods like the Kano model or six sigma are either graphical or instructional through software. Just like aggregate production planning, our aggregate quality plan will be modeled using linear programming techniques. This construction technique will quantify quality with clear aggregate measures which will be important in monitoring future quality needs and will reduce quality cost in the process.
Background
Documents about the application of linear programming to developing a quality function are not popular in the scientific world. Few searchers have developed a concept about the subject. Charles S. Reveille a professor at Johns Hopkins University developed the application of quality function into water treatment. In his article, Linear Programming Applied to Water Quality Management, the author develops a model of managing water quality using linear programming. The authors define quality as a function of water standards and cost. The objective function is structured in terms of the costs of the treatment plants. The principal constraints prevent violation of the dissolved oxygen standards. A simplified version of the Willamette River in Oregon is studied, using the linear programming formulation, and the results are compared with those obtained by dynamic programming. The result of this research concludes with the fact that quality can be modeled as a function and can be used to monitor cost in production. Even if the author only uses a dual variable function, the conclusion of his research opens the doors to an analysis of a multiple variable function. Also, Nezir Aydin, a searcher and industrial engineer, developed the function of quality as a customer-oriented function. His study "develops a sustainable Linear Programming (LP) based Quality Function Deployment (QFD) methodology under IVIF-environment. The proposed method determines more accurate Customer Expectations (CEs) and related Service Requirements (SRs). Accordingly, while "clothing quality", price policy", and "staff behavior" are determined as the most important CEs, design of customer personal, production cost, and marketing applications are obtained as the most affecting SRs. Since no specific study in the literature addresses uncertainty in CEs and SRs in the apparel retailing industry. Min Xe, a professor at the City University of Hong Kong, developed the concept of quality function development. For the author, "Quality Function Deployment (or QFD, for short) is a basic TQM tool that systematically develops customers' needs and expectations. The tool provides a graphical methodology for unearthing a customer's stated and unstated needs and expectations, for making decisions in cases where these needs and expectations conflict, and for driving these customer-based requirements and expectations into the product development and manufacturing process". The author defined quality development function as a house of quality based on a matrix that defines the customer expectation and criteria of satisfaction. This function develops the different variables and parameters forming the quality function. All these different authors have systematically and methodically developed the concept of quality and the different appropriate methods.
However, our paper will focus on proving and developing an aggregate function of quality based on linear programming.
Problem Statement
Quality has been used as a parameter in production planning. Quality cost used as a variable of production gives an overview of the production capacity and can be used as a variable in capacity planning. The utilization of quality as a parameter of production changes the importance of quality. Quality becomes a simple variable that needs to be studied insight the production or the process. This perspective does not give the ability to quantify quality based on some variables that are encompassed in production. A function is a notion connecting different inputs into an output. Production has a factor of multiple inputs or parameters and depends on multiple variables to produce an outcome. In the same way, quality is just more than a standard or a metric measure that needs to have a certain configuration. Quality is a combination of multiple variables that are more complex than understood. To define production, we have to see the entire process as an all [1].
In the manufacturing world, production capacity does not only integrate the manufacturing system but also the support system. This perspective shows how important production is and the different parameters and variables that need to be considered while planning production. "Although the term "Planning Quality" (PQ) has been used several times by the scientific community, a standard definition of PQ in the field of production planning and a clear distinction to other similar concepts like "robust planning" is still missing. The fact that quality planning is commonly used without appropriately defining the concept creates a scientific hole in quality analyses. While quality is part of production and management, it is used at a microscopic level defining different measures and features based on the customer requirements. Quality management tools like six sigma or Kaizen define quality as a set of practices and measurements that need to be applied at the microscopic level in every function of the institution. Even if this concept has been proven to be very useful, there is still a need for a bigger picture of quality in the organization. Because of the lack of scientific interest in developing quality as a function and the fact that quality is only applied at a microscopic level across the institution, there is a need for us to see quality as a different function within production. As a result, our paper will focus on developing a quality function based on the linear programming method. It seeks to address by analytic means the following objectives:
• Developing an aggregate quality function using linear programming.
• Assessing the impact of quality as a function.
• Establishing the place of quality as an important factor like production.
Materials and Methods
The importance of any procedure is to define a road map through methodic strategies. These strategies are a result of innovative approaches consulted throughout the research. We have conducted descriptive research by simply presenting different facts and elements encounters. We have described the phenomenon by different elements perceived and understood. We have developed an analytic way and have given illustrations to better sustain our information and different facts. We have used documentation study as a technique to gather information and different notions related to quality and linear programming. We have studied different authors and their perspectives on the subject. Finally, we have analyzed different primary sources exploring our subject and have used the different information to build a practical theory and to experience our theory with different examples.
Review of the Research
This scholarly exploration aims to unravel how the mathematical rigor and precision of linear programming can enhance the effectiveness and efficiency of quality function processes in diverse industries. Linear programming, a method for achieving the best outcome in a mathematical model whose requirements are represented by linear relationships, is pivotal in optimizing resource allocation, reducing costs, and improving overall system performance [2]. This review delves into the core of this integration, scrutinizing the theoretical underpinnings, practical implementations, and case studies that illuminate the transformative impact of linear programming on quality function deployment.
Quality Function Modelling
Modeling a quality function can be very complex because quality deeply depends on certain factors that can be versatile. Because quality is defined as the ability to meet the customer criteria or requirements, we will try to analyze the different elements that can be used to understand how to model quality function.
Quality planning of Joseph Juran: Joseph Moses Juran, an advocate for quality and quality management, developed the theory being quality improvement. Based on Juran’s trilogy, quality improvement is based on three principal elements: Quality plan, quality control, and quality improvement. For our context, we are trying to build an aggregate function of parameters that gives an overview of quality in an organization.
“Quality does not happen by accident; it must be planned.” Quality planning is the structured process of designing products and services to meet new goals and ensure that customer needs are met (Figure 1).
Quality planning steps:
• Establish the project.
• Identify customers.
• Discover the customer’s needs.
• Develop the product.
• Develop the process.
• Develop the controls and transfer them to operations.
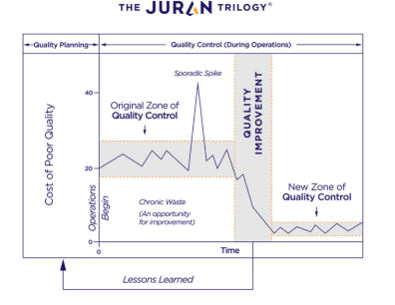
Figure 1: Juran’ trilogy
The most important part of the Juran method starts with an overview of quality as a function of quality planning. In this part, we try first of all to identify the customer, the inner customer, and the external customer. It is based on customer satisfaction that we can build the quality function. After defining the customer needs, we will have to:
• Define customer needs specifications
• Define the different parameters for customer satisfaction
• Put measures to ensure quality
Quality function needs to be defined by determining customer criteria through a process of needs identification and parameter building.
Identifying the Quality Parameters
To identify the parameters of customer needs, we need to understand customer satisfaction.
In simple words, customer satisfaction is a measurement that determines how well a company’s products or services meet customer expectations. It’s one of the most important indicators of purchase intentions and customer loyalty. As such, it helps predict business growth and revenue. While the definition above looks pretty straightforward, in reality, it’s not that easy to define what “satisfied customers” really mean for your company. If you’re tempted to say, "I’ve got a lot of purchases and a steady number of recurring customers, so I think I’m good,” think twice. Maybe some of your clients simply forgot to cancel their subscriptions. Maybe they procrastinate switching to your competitors. Or perhaps they’re too shy to complain and seek reimbursement. None of these reasons means they’re satisfied. This is where specific customer satisfaction metrics, like CSAT (Customer Satisfaction Score), come into play. They let you determine what exactly influences the satisfaction or lack of it among your customers [3]. And it pays off to keep your customers happy. A high customer satisfaction level guarantees longterm clients and makes you stand out from the competition. It also lets you avoid the dire consequences of bad customer experience: churning customers and negative word of mouth [4,5].
The customer expectations are represented by the Maslow's hierarchy of needs.
Maslow's hierarchy of needs can be separated into two types of needs: Deficiency needs and growth needs.
Deficiency needs: Physiological, security, social, and esteem needs are deficiency needs, which arise due to deprivation. Satisfying these lower-level needs is important to avoid unpleasant feelings or consequences.
Growth needs: Maslow called the needs at the top of the pyramid growth needs. These needs don't stem from a lack of something, but rather from a desire to grow as a person.
While the theory is generally portrayed as a fairly rigid hierarchy, Maslow noted that the order in which these needs are fulfilled does not always follow this standard progression (Figure 2).
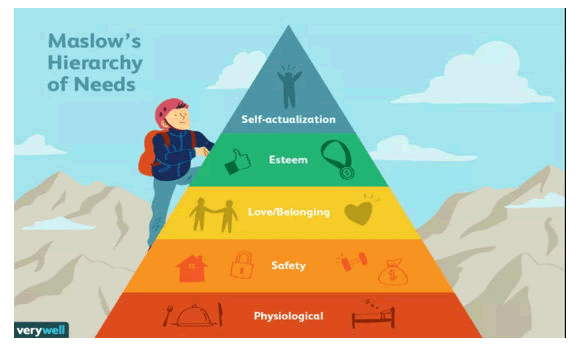
Figure 2: Maslow's hierarchy of needs.
The customer is “anyone the organization supplies with products or services”.
The American quality association defines the needs of customers by the following parameters:
• Performance: Usability, availability, reliability, maintainability.
• Feature: Time oriented, ethical, cultural, technological.
• Service: The experience.
• Warranty: The promised quality.
• Price
• Reputation
These different parameters are static elements that define quality. This element helps us to see what quality is from a broader viewpoint.
Identifying variables: The variables are based on different parameters. Variables are elements that help us to quantify different parameters. Variable depends principally on the type of product being developed. "Quality variables include details about the data that are collected while operating. These variables are defined in plant applications administrator. The values that you provide for these variables help verify that the parameters that are critical to the quality and manufacturing processes are within acceptable limits. You can use this data to review the performance of a production line and production unit and compare the quality of the products produced in each unit with projections for an operation”.
For example: If you are asked to define the quality variable of a phone, you will base the phone on different customer requirement and their related parameters. A phone should have higher technology (features), need to be easily used for different functions (usability), need to be affordable or expensive depending on the need of the customer (price) need to last long (service). For all these elements, we can define a variable as follows: Features (number of applications, pixels capacity of the camera), usability (number of functionality, the storage capacity), price (cost of material m cost of other parameters), service (batteries capacity, phone resistance to water or heat).
Modelling Using Linear Programming
Linear programming is a mathematical process of maximization and minimization. It is used to maximize and minimize function based on different constraints that could be faced. It is a programming method that evaluates a function based on a variable. Linear programming is used to define Quality functions based on the different parameters and their related variables.
A linear programming problem consists of:
• Decision variables
• Objective function
• Constraints
• Non-Negative restrictions
Decision variables are the variables x, and y, which decide the output of the linear programming problem and represent the final solution.
The objective function, generally represented by Z, is the linear function that needs to be optimized according to the given condition to get the final solution.
The restrictions imposed on decision variables that limit their values are called constraints. Now, the general formula of a linear programming problem is
Objective function: Z=ax + by
Constraints: cx + die ≥ e, pox + qi ≤ r
Non-Negative restrictions: x ≥ 0, y ≥ 0
In the above condition x, and y are the decision variables
Steps to Quality Function Modelling
Modeling quality function is primarily based on the objective. The first objective of aggregate planning is to reduce costs and optimize your production. In our case, our objective will be to maximize quality and reduce cost. The following steps will be required to develop a quality function.
• Step 1: Identify customer needs through different feedback methods for example: Customer surveys, agile teams, etc.
• Step 2: Simplify the different needs and connect the needs to different parameters.
• Step 3: Identify the variables connected to the parameters.
• Step 4: Connect the different variables to our main objective which is the cost.
• Step 5: Find the different constraints related to the function and variables.
• Step 6: Build the linear model and execute the program based on different methods of resolution like the simplex method
Example: You are asked to find a quality function for a pencil. The company has affected a budget of 200$ on the pencil improvement and esthetics on their 500$ budget.
• Step 1: Identify customer needs through different feedback methods for example: Customer surveys, agile teams, etc. Based on a web search, a pencil must write properly, it needs to be easy to handle, it needs to be easy to erase the writing, and many other feature elements.
• Step 2: Simplify the different needs and connect the needs to different parameters. The pencil must performance (be usable) and needs features.
• Step 3: Identify the variables connected to the parameters.
Performance: quantity of clay in the mine (harder to break).
Features: Quality of eraser, use of the numerical reader and other forms of technology (added technology).
• Step 4: Connect the different variables to our main objective which is the cost. Let's say that the kilo of clay is 0.15$ and the work for each feature is 35$/feature.
• Step 5: Find the different constraints related to the function and variables. Let's say that the quantity of clay is represented by X1. The features are represented by X2.
Constraints: X1 + X2 ≤ 500$, X2 ≤ 200$
Non-Negative restrictions: X1 ≥ 0, X2 ≥ 0
• Step 6: Build the linear model and execute the program based on different methods of resolution like the simplex method.
The function quality to maximize will be equal to:
Objective function: Z = 0.15X1 + 35X2
Constraints: X1 + X2 ≤ 500$, X2 ≤ 200$
Non-negative restrictions: X1 ≥ 0, X2 ≥ 0
Practice Case
Microsoft is planning to launch a new phone line. The main objective is to give the users a better phone that can be computer however the price of customizing the phone should not exceed 25000$ knowing that the company mostly pays 10$/additional applications like keyboard connection, larger processor, and storage space [6]. Also, the phone needs to be used more often in complicated environments as a result, the phone will need extract colt ant treatment which will cost approximately 350$/treatment. The price of the phone is based on the unit cost of producing a phone which is 300$ and the quantity should exceed 80 units. The reputation of the phone will depend on the should be based on ability to have multiple purposes but the different functionality in the exploitation system in a single phone should be superior to the price of building a computer (3000$). The budget for the project is 50000$.
When we analyze the different elements, we can see the following parameters:
• Performance (reliability)
• Features (technology, time-oriented)
• Reputation
• Price
These parameters can be expressed with the following variables:
• Performance (reliability): Resistance of the material (Measurement: number of treatments).
• Features (technology): Sophistication (measurement: number of applications).
• Reputation: Function (measurement: number of functionality).
• Price: Quantity (measurement: number of phones to produce).
Modeling this problem using linear, we have:
• X1: Resistance of the material (Measurement: number of treatments).
• X2: Sophistication (measurement: number of applications).
• X3: Function (measurement: number of functionality).
• X4: Quantity (measurement: number of phone to produce).
We have the quality function: 350X1+10X2+ X3+300X4.
Contraints: 350X1+10X2+ X3 ≤ 25000, 300X4 ≥ 24000, 350X1+10X2+ X3+ 300X4 ≤ 50000
Non-negative restrictions: X1 ≥ 0, X2 ≥ 0, X3 ≥ 0, X4 ≥ 0.
Solving this problem using the simplex method m we will have:
Max Z = 350X1+10X2+X3+300X4
Subject if to
350X+10X2+X3 ≤ 25000
300X ≥ 24000
350X+10X2+X3+300X4 ≤ 50000 and X1, X2, X3, X4 ≥ 0
The problem is converted to canonical form by adding slack, surplus, and artificial variables as appropriate.
• As the constraint-1 is of type '≤' we should add slack variable S1.
• As the constraint-2 is of type '≥' we should subtract surplus variable S2 and add artificial variable A1.
• As the constraint-3 is of type '≤' we should add slack variable S3 after introducing slack, surplus, artificial variables (Tables 1-4).
Max Z=350X1+10X2+X+300X4
Subject if to
350X1+10X2+X3 ≤ 25000
300X4 ≥ 24000
350X1 +10X2 +X3+300X4 ≤ 50000 and X1, X2, X3, X4 ≥ 0
| Iteration-1 |
Cj |
350 |
10 |
1 |
300 |
0 |
0 |
0 |
-M |
- |
| B |
CB |
XB |
X1 |
X2 |
X3 |
X4 |
S1 |
S2 |
S3 |
A1 |
MinRatio XBX4 |
| S1 |
0 |
25000 |
350 |
10 |
1 |
0 |
1 |
0 |
0 |
0 |
- |
| A1 |
-M |
24000 |
0 |
0 |
0 |
-300 |
0 |
-1 |
0 |
1 |
24000300=80→ |
| S3 |
0 |
50000 |
350 |
10 |
1 |
300 |
0 |
0 |
1 |
0 |
50000300=166.6667 |
| Z=-24000M |
Zj |
0 |
0 |
0 |
-300M |
0 |
M |
0 |
-M |
- |
| |
|
Zj-Cj |
-350 |
-10 |
-1 |
-300M-300↑ |
0 |
M |
0 |
0 |
- |
Table 1: Iteration-1.
The negative minimum Zj-Cj is -300M-300 and its column index is 4. So, the entering variable is X4.
Minimum ratio is 80 and its row index is 2. So, the leaving basis variable is A1.
The pivot element is 300.
Entering =X4, Departing =A1, Key Element =300
R2(new)=R2(old) ÷ 300
R1(new)=R1(old)
R3(new)=R3(old)- 300R2(new)
| Iteration-2 |
Cj |
350 |
10 |
1 |
300 |
0 |
0 |
0 |
|
| B |
CB |
XB |
X1 |
X2 |
X3 |
X4 |
S1 |
S2 |
S3 |
MinRatio XBX1 |
| S1 |
0 |
25000 |
-350 |
10 |
1 |
0 |
1 |
0 |
0 |
25000350=71.4286→ |
| X4 |
300 |
80 |
0 |
0 |
0 |
1 |
0 |
-0.0033 |
0 |
- |
| S3 |
0 |
26000 |
350 |
10 |
1 |
0 |
0 |
1 |
1 |
26000350=74.2857 |
| Z=24000 |
|
Zj |
0 |
0 |
0 |
300 |
0 |
-1 |
0 |
|
| |
|
Zj-Cj |
-350↑ |
-10 |
-1 |
0 |
0 |
-1 |
0 |
|
Table 2: Iteration-2.
Negative minimum Zj-Cj is -350 and its column index is 1. So, the entering variable is X1. Minimum ratio is 71.4286 and its row index is 1. So, the leaving basis variable is S1.
The pivot element is 350.
Entering =X1, Departing =S1, Key Element =350
R1(new)=R1(old) ÷ 350
R2(new)=R2(old)
R3(new)=R3(old) - 350R1(new)
| Iteration-3 |
Cj |
350 |
10 |
1 |
300 |
0 |
0 |
0 |
|
| B |
CB |
XB |
X1 |
X2 |
X3 |
X4 |
S1 |
S2 |
S3 |
MinRatio XBS2 |
| X1 |
350 |
71.4286 |
1 |
0.0286 |
0.0029 |
0 |
0.0029 |
0 |
0 |
- |
| X4 |
300 |
80 |
0 |
0 |
0 |
1 |
0 |
-0.0033 |
0 |
- |
| S3 |
0 |
1000 |
0 |
0 |
0 |
0 |
-1 |
-1 |
1 |
10001=1000→ |
| Z=49000 |
|
Zj |
350 |
10 |
1 |
300 |
1 |
-1 |
0 |
|
| |
|
Zj-Cj |
0 |
0 |
0 |
0 |
1 |
-1↑ |
0 |
|
Table 3: Iteration-3.
Negative minimum Zj-Cj is -1 and its column index is 6. So, the entering variable is S2. Minimum ratio is 1000 and its row index is 3. So, the leaving basis variable is S3.
The pivot element is 1.
Entering=S2, Departing=S3, Key element=1
R3 (new)=R3 (old)
R1 (new)=R1 (old)
R2 (new)=R2 (old)+0.0033R3 (new)
| Iteration-4 |
CCCJ |
350 |
10 |
1 |
300 |
0 |
0 |
0 |
|
| B |
CB |
XB |
X1 |
X2 |
X3 |
X4 |
S1 |
S2 |
S3 |
MinRatio |
| X1 |
350 |
71.4286 |
1 |
0.0286 |
0.0029 |
0 |
0.0029 |
0 |
0 |
| X4 |
300 |
83.3333 |
0 |
0 |
0 |
1 |
-0.0033 |
0 |
0.0033 |
| S2 |
0 |
1000 |
0 |
0 |
0 |
0 |
-1 |
1 |
1 |
| Z=50000 |
Zj |
350 |
10 |
1 |
300 |
0 |
0 |
1 |
| |
|
Zj-Cj |
0 |
0 |
0 |
0 |
0 |
0 |
1 |
Table 4: Iteration-4.
Since all Zj-Cj ≥ 0
Hence, the optimal solution is arrived at with the value of variables as:
X1=71.4286, X2=0, X3=0, X4=83.3333
Max Z=50000
In this problem, we have found that the companies should not focus on building features and reputation based on their finances and focus on developing a reliable phone meeting their demanded quantity and price requirement. At this point m, we have given an environment-resistant phone at an affordable price. The phone can be used more often in complicated environments and the price of the phone is based on the unit cost of producing a phone which is 300$ and the quantity exceeds 80 units.
Results and Discussion
The exploration of modeling a quality function through linear programming has shed light on its pivotal role in enhancing decision-making processes for production capacity planning.
This integration is not merely a theoretical advancement but a practical tool that brings a new dimension to the manufacturing and service processes, emphasizing the significance of adopting an aggregate perspective on quality. While the microscopic approach to quality has its merits in detailed analysis, the aggregate view facilitated by linear programming offers a comprehensive overview that is essential for strategic planning, product design, and development.
The application of linear programming in modeling quality functions underscores the necessity of optimizing decisions on quality options and parameters. This methodology allows organizations to prioritize their focus on aspects of quality that yield the highest impact on production efficiency and customer satisfaction. The positive outcomes observed from the application of this method are encouraging, pointing towards a robust framework that could significantly improve the quality of decision-making in various domains of production and service delivery.
However, it is crucial to acknowledge the gray areas and limitations identified in the application of this model. The concerns regarding the subjective nature of decision-making, the oversight of critical parameters or variables significant to the organization, and the lack of consideration for the correlation between certain variables highlight the need for further refinement of this approach. These challenges underscore the complexity of quality management and the necessity for models that can accurately capture the multifaceted nature of quality in production and service contexts.
Future endeavors in this field should aim at addressing these inconveniences by developing more sophisticated models that can incorporate subjective decision-making processes, recognize and prioritize organizational variables, and account for the interdependencies between different quality parameters [7]. Enhancing the model's ability to provide more directive results, which align with the strategic objectives of the organization, will be crucial for its successful implementation in decision-making.
Moreover, this model's potential to forecast the evolution of different aggregates and monitor various quality-related variables opens up new avenues for research and development [8,9]. By predicting future trends and identifying potential areas of improvement, organizations can proactively manage quality, ensuring that their products and services continue to meet and exceed customer expectations.
Conclusion
In conclusion, while the journey of integrating linear programming with quality function modeling is still in its early stages, the potential benefits are undeniable. The insights gained from this exploration offer a promising direction for future research and practical applications, aiming to enhance the quality of decision-making in production planning and beyond. As we move forward, it is imperative to refine and expand upon this approach, embracing the complexities and dynamic nature of quality, to develop more comprehensive and effective models for quality management in the manufacturing and service industries.
References
- Vernova GE (2020) Access the quality variables of an operation. Proficy Plant Applications.
- Andrade S (2023) What is aggregate production planning and why it is important? Think Lean Six Sigma.
- Ayd N (2023) A linear programming based QFD methodology under a fuzzy environment to develop sustainable policies in the apparel retailing industry. J Clean Prod. 387:135887.
[Crossref] [Google Scholar]
- GeeksforGeeks (2023) Linear Programming. GeeksforGeeks.
- Iqbal M (2023) Juran Trilogy quality planning, control, and improvement.
- Libretexts (2021) The Juran trilogy. Biol LibreTexts.
- Lingitz L (2023) Quality in production planning: Definition, quantification and a machine learning based improvement method. Procedia Comput Sci. 217:358–365.
[Crossref] [Google Scholar]
- Jahan A, Edwards K, Bahraminasab M (2016) Materials selection in the context of design problem solving. In: Elsevier eBooks, pp 25–40.
- K C MSEd (2022) Maslow’s Hierarchy of Needs. Verywell Mind.
Citation: Lutete AK (2025) Quality Function through Linear Programming. Br J Res 12:144.
Copyright: © 2025 Lutete AK. This is an open-access article distributed under the terms of the Creative Commons Attribution
License, which permits unrestricted use, distribution, and reproduction in any medium, provided the original author and source
are credited.