Sharaniza Ab-Rahim1, Azura Mansor2, Zulaika Roslan3, Effat Omar3, Khalilah Mastura Zahari3, Mudiana Muhamad1and Tunku Kamarul2
1DDH CoRe, Universiti Teknologi MARA,40450 Shah Alam Selangor, Malaysia
2NOCERAL, Department of OrthopaedicSurgery, Faculty of Medicine, Universityof Malaya, 50603 Kuala Lumpur,Malaysia
3Institute of Molecular Medicine andBiotechnology, Faculty of Medicine,Universiti Teknologi MARA, 47000 Sg.Buluh, Selangor, Malaysia
Corresponding Author:
Dr. Sharaniza Ab-Rahim
Faculty of Medicine, Sg. Buluh Campus Universiti Teknologi MARA, Selangor, Malaysia.
Tel: 60361267362
Fax: 60361265082
E-mail: sharaniza_abrahim@salam.uitm.edu.my
Received date: December 17, 2015 Accepted date: December 28, 2015 Published date:December 30, 2015
Citation: Ab-Rahim S, Mansor A, Roslan Z, et al. Proteome Comparisons between Pre-Chemotherapy and Post- Chemotherapy Serum of Metastatic Osteosarcoma Patients Reveals Potential Novel Biomarker. Biochem Mol Biol J. 2016, 1:1.
Introduction
Osteosarcoma (OS), also known as osteogenic sarcoma, is the most common type of cancer that develops in bone. Most osteosarcoma occurs in children and young adults between the ages of 10 to 30 [1]. It accounts about 10% of childhood cancer. This cancerous (malignant) bone tumor usually develops during the period of rapid growth of an adolescence maturing into an adult. The malignant bone tumour tends to develop in the bones of the tibia (shin), femur (thigh) and humerus (upper arm).
Diagnosis of OS was made by imaging test followed by histological grading of the tissue biopsied from the patients. The present standard treatment for high-grade OS includes neo-adjuvant chemotherapy followed by surgical resection and post-operative chemotherapy [2]. Although the cure rate of non-metastatic cases has improved tremendously, there were recurrences in approximately 30% of the cases and more than 80% of the relapses involve the lungs [3]. These undetectable micrometastases are commonly present at time they first seek medical attention and indicate presence of more aggressive diseases. Previous data has shown that approximately 80% of patients are believed to have metastatic diseases, yet only 8-15% is detectable with the current diagnostic tools [4]. Despite decades of trial using intensified dosing, different timing and variations in combinations of chemical agents poor prognosis has continues to be the major problem in managing osteosarcoma. Although advances of the standard treatment for OS have significantly improved the survival rate in recent years, its prognosis continues to remain less optimistic.
Identification of cancer biomarkers using blood and its products, such as plasma and serum are of paramount importance since they contain proteins secreted from the cancer cells. However, identifying clinically relevant biomarkers impose a major challenge to researcher due to presence of abundant protein such as albumin, immunoglobulin and transferrin which contribute 99% of the mass of the total plasma proteins [5]. The remaining 1% is thought to be composed of the medium/low abundance proteins and include the biomarker pool [6]. In addition, the progression of osteosarcoma is usually presents at early haematogenous metastasis which is also attributed to the poor prognosis of OS. This tumour cells are likely to invade the surrounding tissues or migrate to distant sites during tumour progression.
Recent advances in genomics and proteomics has enabled researchers to learn more about the molecular aspects of a tumour. Although there are many different protein fractionation methodologies based on differences in molecular weight, shape, charge, pI, hydrophobicity and affinity through specific biomolecular interactions, it has been reported that high abundance protein separation using the antibody based IgY-12 immunodepletion system is highly reproducible [7]. Amongst the proteomic technologies used, isobaric Tags for Relative and Absolute Quantitation (iTRAQ) has the advantages of being relatively high throughput and simultaneously provide information on peptide quantitation and identification, as previously reported [8-10].
In this study we have performed a 4-plex iTRAQ analysis in order to identify the novel proteins that play a key role in the osteosarcoma metastatic progression. In a typical workflow, samples are reduced, alkylated and proteolytically digested to generate peptides. The peptides are labelled with a set of iTRAQ reagents (in a 4 or 8-plex format), pooled and fractionated by strong cation exchange (SCX). The fractions are then analysed by liquid chromatography tandem mass spectrometry (LC-MS/MS), with the resultant mass spectra providing sequence information (from the peptide fragments), and relative quantification (from the reporter group ions).
Materials and Method
Blood collection and serum isolation
Peripheral blood was drawn from patients attending the Orthopaedic Clinic at University of Malaya Medical Centre (UMMC) following written informed consent from the patients and upon approval by the UMMC Ethics Committee (BK-MIS- 1117-E01). The blood was drawn twice; during the patients’ initial visit to the clinic (pre-chemotherapy) and the second time, during the surgical removal of the tumour (post-chemotherapy). Serum was isolated by allowing the blood to coagulate for 30 minutes, centrifuged at 1,200 × g for 10 min at 4°C and then stored at −80°C in 100 μl aliquots.
Serum grouping and pooling
Twelve serum samples were carefully selected and pooled (n=6 patients/group), to form 2 patient groups. The patients were actively monitored for at least 5 years from the time of their initial blood taking. These patients were with evidence of bone metastasis from the prior imaging and histological analysis. The 2 patient groups were: Group 1: Pre-chemotherapy samples, which the blood was drawn prior to chemotherapy and any treatment to the patients. Group 2: Post-chemotherapy samples which the blood was drawn during surgical removal of the tumour (postchemotherapy patients).
Control group was collected from voulunteer healthy individuals prior to their consent.
Immunodepletion and iTRAQ labelling
Pooled serum samples were depleted of the most common plasma proteins according to the iTRAQ protocol (Applied Biosystem). Previous studies have shown that serum pooling followed by depletion of the most highly abundant proteins is an effective strategy to reduce the dynamic range of proteins, and thus enhance the identification of serum biomarkers, as demonstrated using the quantitative proteomic method of iTRAQ [11]. Serum samples from 6 patients representing each of the 2 patient groups were pooled in equal volumes to give a total volume of 200 μl for each group (40 μl of each sample). The pooled serum samples were shipped on dry ice to Proteomics International (Australia).
The samples were then being acetone precipitated, reduced, alkylated and trypsin digested according to the protocol (Applied Biosystem). Samples (Control, Pre-chemotherapy and post-chemotherapy) were labelled with iTRAQ reagents, 114 (control), 115 (control), 116 (pre-chemotherapy) and 117 (postchemotherapy) accordingly. Peptide were desalted on Strata-X 33 μm reversed phase column (Phenomenex) and dissolved in a buffer containing 10 mM KH2PO4 (pH3) in 10% acetonitrile prior to separation by strong cation exchange liquid chromatography (SCX) using polysulfoethyl column (4.6 × 100 mm, 5 μm, 300 A) 1100 HPLC system (Agilent, USA). Peptides were eluted with a linear gradient of 0-400 mM KCl and eight fractions of the peptides were collected and loaded onto an Agilent Zorbax 300SB-C18, 3.5 μm (Agilent, USA) which running on nano HPLC system (Shimadzu, Japan). Peptides were resolved with a gradient of 10-40% acetonitrile (0.1%) trifluoroacetic acid) over 160 minutes. The resultant spots were analysed on a 5600 Triple TOF mass spectrometer (AB Sciex, USA).
Data analysis
Spectral data was analysed against the SwissProt database with the taxonomy set to Homo sapiens using ProteinPilot™ 4.5 software (AB Sciex, USA). The database was downloaded on February 2014 and contained 542,503 sequences.
Immunohistochemistry
Tissue biopsied from the metastatic OS patients were fixed prior to paraffin embedding. The paraffin embedded tissue blocks will be sectioned at 4 to 5 micron thickness, applied to poly-L-lysine coated slides and dried in a hot oven at 60°C for a minimum of 2 hours. The sections was then deparaffinised in a few changes of xylene followed by graded concentration of alcohol until fully hydrated. Immunohistochemistry was performed using a Dakoimmunostaining kit (DakoCytomation, USA) to verify the presence of VCAM-1 in the tissue biopsied. Slides were washed with Tris-buffered saline (TBS) and treated with 0.03% hydrogen peroxide containing sodium azide. Slides were then incubated with primary antibody to VCAM-1 or PBS alone (negative control) for 1 hour. Slides were then further exposed to horseradish peroxidase (HRP)-conjugated goat anti-mouse secondary antibody/ IgG for 30 minutes. Samples were stained with diaminobenzidine (DAB kit, DakoCytomation, USA) according to manufacturer protocol and observed under the light microscope for the presence of VCAM-1.
Results
Gene ontology annotation
Gene ontology (GO) annotations for biological processes were assigned using Protein Analysis through Evolutionary Relationships (PANTHER) software. This software link the protein accession codes to the corresponding entries in the gene ontology database hence identifying the range of proteins assessed earlier [12]. Approximately 217 proteins with 104,214 spectra were analysed. The PANTHER analysis revealed the presence of many common plasma proteins such as cellular component organization (39.2%), cellular process (66.7%), biological regulation (24.2%) and localization (18.2%) (Figure 1). In total of 51 proteins and 69 proteins were differentially expressed in pre-chemotherapy and post-chemotherapy in relative to control serum.
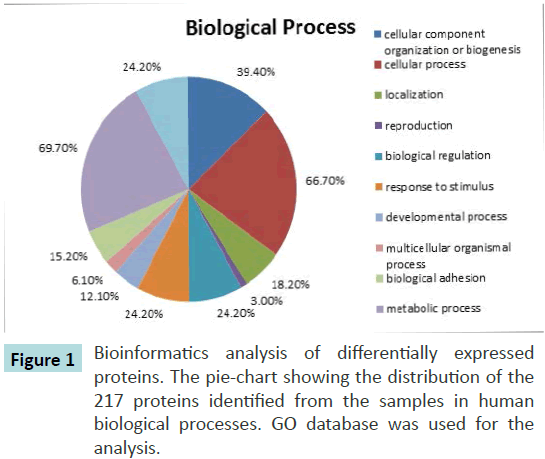
Figure 1 Bioinformatics analysis of differentially expressed proteins. The pie-chart showing the distribution of the 217 proteins identified from the samples in human biological processes. GO database was used for the
analysis.
Identification of proteins for biomarker leads
Differences in protein levels are reported following a t-test analysis and the p-values were calculated based on the number of peptides used for the quantification and the variance of the iTRAQ reporter ratios derived from these peptides. A p-value ≤ 0.01 was used to assign significant changes in protein levels between sample sets. These protein changes were reported as significant differential expression, were selected based upon statistical significance rather than fold change [13].
In our analysis, we were interested in proteins showing both increased and decreased expression levels, as previous studies have reported that both significantly up- and down-regulated proteins may be of clinical relevance9. Identification of proteins differentially expressed in pre-chemotherapy and postchemotherapy were of interest as these could provide leads for potentially useful diagnostic and prognostic biomarkers. Thus, a comparison between the pre-chemotherapy groups versus the control group showed a significant differential expression of 51 proteins; 28 of which were up-regulated and 23 downregulated (Table 1a). Similarly, a comparison between the post-chemotherapy groups versus the control group identified the differential expression of 69 proteins; 29 of which showed significant over-expression and 40 showed down-regulations (Table 1b). Comparisons of the pre-chemotherapy versus the post-chemotherapy group identified the differential expression of 57 proteins, with 41 proteins showing significant over-expression and 16 showing significant down-regulation (Table 1c).
| Accession No. |
Name |
% Cov |
Peptides(95%) |
116:114 |
PVal 116:114 |
| P04114|APOB_HUMAN |
Apolipoprotein B-100 |
47.8 |
361 |
0.9638 |
0.00E+00 |
| P0C0L5|CO4B_HUMAN |
Complement C4-B |
76.6 |
566 |
4.2073 |
4.60E-03 |
| P01023|A2MG_HUMAN |
Alpha-2-macroglobulin |
68.1 |
153 |
1.0864 |
0.00E+00 |
| P00450|CERU_HUMAN |
Ceruloplasmin |
72.4 |
353 |
1.0666 |
0.00E+00 |
| P00751|CFAB_HUMAN |
Complement factor B |
63.6 |
207 |
1.028 |
0.00E+00 |
| P02751|FINC_HUMAN |
Fibronectin |
47.7 |
104 |
0.2051 |
0.00E+00 |
| Q14624|ITIH4_HUMAN |
Inter-alpha-trypsin inhibitor heavy chain H4 |
70.2 |
209 |
1.0093 |
7.30E-03 |
| P01031|CO5_HUMAN |
Complement C5 |
49.7 |
102 |
3.767 |
0.00E+00 |
| P43652|AFAM_HUMAN |
Afamin |
64.1 |
84 |
0.0787 |
0.00E+00 |
| P06727|APOA4_HUMAN |
Apolipoprotein A-IV |
76 |
73 |
0.912 |
0.00E+00 |
| P13671|CO6_HUMAN |
Complement component C6 |
65.9 |
72 |
1.8365 |
8.00E-04 |
| P06396|GELS_HUMAN |
Gelsolin |
58.4 |
101 |
0.8551 |
0.00E+00 |
| P02749|APOH_HUMAN |
Beta-2-glycoprotein 1 |
79.1 |
114 |
0.4207 |
3.00E-04 |
| P01008|ANT3_HUMAN |
Antithrombin-III |
72.2 |
66 |
1.977 |
2.00E-04 |
| P01042|KNG1_HUMAN |
Kininogen-1 |
61.8 |
121 |
0.3048 |
1.90E-03 |
| P02765|FETUA_HUMAN |
Alpha-2-HS-glycoprotein |
66.8 |
122 |
0.955 |
3.00E-03 |
| P01011|AACT_HUMAN |
Alpha-1-antichymotrypsin |
63.8 |
77 |
1.028 |
1.50E-03 |
| P07996|TSP1_HUMAN |
Thrombospondin-1 |
41.4 |
41 |
0.1486 |
0.00E+00 |
| P02748|CO9_HUMAN |
Complement component C9 |
61.9 |
41 |
4.7863 |
0.00E+00 |
| P35858|ALS_HUMAN |
Insulin-like growth factor-binding protein complex acid labile subunit |
51.2 |
50 |
0.5649 |
3.51E-02 |
| P00738|HPT_HUMAN |
Haptoglobin |
74.6 |
36 |
1.9055 |
0.00E+00 |
| P02649|APOE_HUMAN |
Apolipoprotein E |
75.4 |
33 |
0.3281 |
1.00E-04 |
| P04196|HRG_HUMAN |
Histidine-rich glycoprotein |
64.8 |
41 |
0.929 |
0.00E+00 |
| P07357|CO8A_HUMAN |
Complement component C8 alpha chain |
57.7 |
35 |
1.7219 |
1.24E-02 |
| Q06033|ITIH3_HUMAN |
Inter-alpha-trypsin inhibitor heavy chain H3 |
48.7 |
41 |
2.729 |
1.71E-02 |
| P10909|CLUS_HUMAN |
Clusterin |
52.1 |
38 |
0.3565 |
1.70E-02 |
| P36955|PEDF_HUMAN |
Pigment epithelium-derived factor |
76.1 |
44 |
0.1406 |
0.00E+00 |
| P29622|KAIN_HUMAN |
Kallistatin |
60.4 |
32 |
0.1706 |
0.00E+00 |
| P02750|A2GL_HUMAN |
Leucine-rich alpha-2-glycoprotein |
60.8 |
54 |
1.1695 |
0.00E+00 |
| P00748|FA12_HUMAN |
Coagulation factor XII |
49.3 |
34 |
3.5318 |
1.18E-02 |
| Q96PD5|PGRP2_HUMAN |
N-acetylmuramoyl-L-alanine amidase |
58.9 |
47 |
0.3162 |
3.10E-03 |
| P04004|VTNC_HUMAN |
Vitronectin |
49.6 |
54 |
0.3981 |
2.70E-03 |
| P02768|ALBU_HUMAN |
Serum albumin |
55.7 |
18 |
5.8614 |
0.00E+00 |
| P68871|HBB_HUMAN |
Hemoglobin subunit beta |
89.8 |
23 |
18.197 |
1.00E-04 |
| Q16610|ECM1_HUMAN |
Extracellular matrix protein 1 |
49.3 |
13 |
0.2858 |
1.40E-02 |
| P05452|TETN_HUMAN |
Tetranectin |
74.3 |
20 |
0.2965 |
6.50E-03 |
| P04003|C4BPA_HUMAN |
C4b-binding protein alpha chain |
45.4 |
14 |
4.5709 |
9.00E-04 |
| P02753|RET4_HUMAN |
Retinol-binding protein 4 |
65.2 |
34 |
0.3251 |
7.80E-03 |
| P02787|TRFE_HUMAN |
Serotransferrin |
34 |
10 |
0.1629 |
0.00E+00 |
| P17936|IBP3_HUMAN |
Insulin-like growth factor-binding protein 3 |
44 |
11 |
0.3664 |
1.92E-02 |
| P15169|CBPN_HUMAN |
Carboxypeptidase N catalytic chain |
40.8 |
15 |
1.7378 |
2.46E-02 |
| P08519|APOA_HUMAN |
Apolipoprotein(a) |
33.3 |
14 |
15.9956 |
1.66E-02 |
| P63261|ACTG_HUMAN |
Actin, cytoplasmic 2 |
32.5 |
12 |
2.208 |
2.20E-02 |
| P02775|CXCL7_HUMAN |
Platelet basic protein |
64.8 |
14 |
0.15 |
2.30E-03 |
| P02741|CRP_HUMAN |
C-reactive protein |
31.3 |
9 |
2.729 |
2.90E-03 |
| P02656|APOC3_HUMAN |
Apolipoprotein C-III |
57.6 |
7 |
0.0824 |
3.00E-02 |
| P06702|S10A9_HUMAN |
Protein S100-A9 |
64 |
8 |
1.7219 |
4.81E-02 |
| P69905|HBA_HUMAN |
Hemoglobin subunit alpha |
64.8 |
10 |
20.7014 |
1.00E-04 |
| P05109|S10A8_HUMAN |
Protein S100-A8 |
52.7 |
6 |
2.355 |
1.78E-02 |
| P02652|APOA2_HUMAN |
Apolipoprotein A-II |
57 |
5 |
0.52 |
1.51E-02 |
| O00187|MASP2_HUMAN |
Mannan-binding lectin serine protease 2 |
18.7 |
7 |
1.8707 |
4.46E-02 |
Table 1a: Proteins differentially expressed between the control (114) and pre-chemotherapy (116) groups.
| Accession No. |
Name |
% Cov |
Peptides (95%) |
117:114 |
PVal 117:114 |
| P04114|APOB_HUMAN |
Apolipoprotein B-100 |
47.8 |
361 |
1.0093 |
0.00E+00 |
| P08603|CFAH_HUMAN |
Complement factor H |
79.2 |
346 |
0.9727 |
0.00E+00 |
| P01023|A2MG_HUMAN |
Alpha-2-macroglobulin |
68.1 |
153 |
1.0471 |
0.00E+00 |
| P02751|FINC_HUMAN |
Fibronectin |
47.7 |
104 |
6.1376 |
0.00E+00 |
| P02790|HEMO_HUMAN |
Hemopexin |
89.2 |
416 |
0.955 |
0.00E+00 |
| P00747|PLMN_HUMAN |
Plasminogen |
82.1 |
136 |
0.9462 |
0.00E+00 |
| P01031|CO5_HUMAN |
Complement C5 |
49.7 |
102 |
1.7378 |
1.90E-03 |
| P00734|THRB_HUMAN |
Prothrombin |
71.9 |
159 |
0.955 |
0.00E+00 |
| P02774|VTDB_HUMAN |
Vitamin D-binding protein |
81.4 |
130 |
0.9727 |
7.00E-04 |
| P19823|ITIH2_HUMAN |
Inter-alpha-trypsin inhibitor heavy chain H2 |
49.7 |
171 |
0.1514 |
1.00E-04 |
| P06727|APOA4_HUMAN |
Apolipoprotein A-IV |
76 |
73 |
0.9036 |
0.00E+00 |
| P10643|CO7_HUMAN |
Complement component C7 |
60.7 |
85 |
2.9376 |
0.00E+00 |
| P06396|GELS_HUMAN |
Gelsolin |
58.4 |
101 |
0.8318 |
0.00E+00 |
| P02749|APOH_HUMAN |
Beta-2-glycoprotein 1 |
79.1 |
114 |
0.1614 |
0.00E+00 |
| P01008|ANT3_HUMAN |
Antithrombin-III |
72.2 |
66 |
0.2512 |
9.00E-04 |
| P19827|ITIH1_HUMAN |
Inter-alpha-trypsin inhibitor heavy chain H1 |
59.5 |
114 |
0.0938 |
0.00E+00 |
| P01042|KNG1_HUMAN |
Kininogen-1 |
61.8 |
121 |
0.1923 |
1.00E-04 |
| P00736|C1R_HUMAN |
Complement C1r subcomponent |
71.5 |
79 |
0.3373 |
2.93E-02 |
| P02765|FETUA_HUMAN |
Alpha-2-HS-glycoprotein |
66.8 |
122 |
0.955 |
1.26E-02 |
| P01011|AACT_HUMAN |
Alpha-1-antichymotrypsin |
63.8 |
77 |
1.0471 |
1.00E-04 |
| P07996|TSP1_HUMAN |
Thrombospondin-1 |
41.4 |
41 |
0.2512 |
0.00E+00 |
| P03952|KLKB1_HUMAN |
Plasma kallikrein |
57.1 |
46 |
0.1419 |
0.00E+00 |
| P05156|CFAI_HUMAN |
Complement factor I |
59.9 |
43 |
0.3873 |
9.00E-04 |
| P06681|CO2_HUMAN |
Complement C2 |
55.1 |
49 |
0.4325 |
3.63E-02 |
| P09871|C1S_HUMAN |
Complement C1s subcomponent |
59.3 |
48 |
0.2489 |
2.20E-03 |
| P05155|IC1_HUMAN |
Plasma protease C1 inhibitor |
52.2 |
59 |
1.9953 |
3.59E-02 |
| P08123|CO1A2_HUMAN |
Collagen alpha-2(I) chain |
40.3 |
49 |
48.7528 |
5.00E-04 |
| P02748|CO9_HUMAN |
Complement component C9 |
61.9 |
41 |
2.6546 |
1.15E-02 |
| P26927|HGFL_HUMAN |
Hepatocyte growth factor-like protein |
57.5 |
27 |
0.4055 |
4.40E-03 |
| P35858|ALS_HUMAN |
Insulin-like growth factor-binding protein complex acid labile subunit |
51.2 |
50 |
0.0982 |
0.00E+00 |
| P25311|ZA2G_HUMAN |
Zinc-alpha-2-glycoprotein |
70.8 |
68 |
0.118 |
2.10E-03 |
| P00738|HPT_HUMAN |
Haptoglobin |
74.6 |
36 |
1.1912 |
0.00E+00 |
| P02649|APOE_HUMAN |
Apolipoprotein E |
75.4 |
33 |
2.9107 |
1.00E-04 |
| P04196|HRG_HUMAN |
Histidine-rich glycoprotein |
64.8 |
41 |
0.9376 |
0.00E+00 |
| Q06033|ITIH3_HUMAN |
Inter-alpha-trypsin inhibitor heavy chain H3 |
48.7 |
41 |
4.1687 |
1.00E-04 |
| P02760|AMBP_HUMAN |
Protein AMBP |
78.4 |
65 |
0.4699 |
1.03E-02 |
| P10909|CLUS_HUMAN |
Clusterin |
52.1 |
38 |
0.1803 |
2.10E-03 |
| P05546|HEP2_HUMAN |
Heparin cofactor 2 |
52.9 |
47 |
0.1644 |
1.00E-04 |
| P36955|PEDF_HUMAN |
Pigment epithelium-derived factor |
76.1 |
44 |
0.2512 |
2.10E-03 |
| P29622|KAIN_HUMAN |
Kallistatin |
60.4 |
32 |
0.1675 |
0.00E+00 |
| P08697|A2AP_HUMAN |
Alpha-2-antiplasmin |
67.6 |
47 |
0.1318 |
6.00E-03 |
| P07358|CO8B_HUMAN |
Complement component C8 beta chain |
55.2 |
27 |
0.631 |
1.27E-02 |
| P02750|A2GL_HUMAN |
Leucine-rich alpha-2-glycoprotein |
60.8 |
54 |
1.1482 |
0.00E+00 |
| P04275|VWF_HUMAN |
von Willebrand factor |
19.6 |
21 |
1.7378 |
2.70E-03 |
| P07225|PROS_HUMAN |
Vitamin K-dependent protein S |
42.3 |
24 |
0.5445 |
5.50E-03 |
| P01024|CO3_HUMAN |
Complement C3 |
28.1 |
27 |
1.0965 |
4.86E-02 |
| Q96PD5|PGRP2_HUMAN |
N-acetylmuramoyl-L-alanine amidase |
58.9 |
47 |
0.2032 |
1.80E-03 |
| P04004|VTNC_HUMAN |
Vitronectin |
49.6 |
54 |
0.1419 |
1.00E-04 |
| P02768|ALBU_HUMAN |
Serum albumin |
55.7 |
18 |
5.7016 |
0.00E+00 |
| Q96KN2|CNDP1_HUMAN |
Beta-Ala-His dipeptidase |
43.4 |
17 |
0.1096 |
0.00E+00 |
| P68871|HBB_HUMAN |
Hemoglobin subunit beta |
89.8 |
23 |
5.2481 |
2.90E-03 |
| P05452|TETN_HUMAN |
Tetranectin |
74.3 |
20 |
0.2032 |
1.10E-03 |
| P05543|THBG_HUMAN |
Thyroxine-binding globulin |
42.7 |
21 |
3.8371 |
3.77E-02 |
| P02753|RET4_HUMAN |
Retinol-binding protein 4 |
65.2 |
34 |
0.1472 |
1.50E-03 |
| P02787|TRFE_HUMAN |
Serotransferrin |
34 |
10 |
0.0492 |
0.00E+00 |
| P17936|IBP3_HUMAN |
Insulin-like growth factor-binding protein 3 |
44 |
11 |
0.1585 |
2.90E-03 |
| P15169|CBPN_HUMAN |
Carboxypeptidase N catalytic chain |
40.8 |
15 |
1.4454 |
3.75E-02 |
| P08519|APOA_HUMAN |
Apolipoprotein(a) |
33.3 |
14 |
21.2814 |
1.45E-02 |
| P43251|BTD_HUMAN |
Biotinidase |
23.4 |
11 |
0.2679 |
2.43E-02 |
| P02741|CRP_HUMAN |
C-reactive protein |
31.3 |
9 |
12.1339 |
3.70E-03 |
| Q9Y6R7|FCGBP_HUMAN |
IgGFc-binding protein |
5.7 |
8 |
3.4995 |
2.62E-02 |
| P06702|S10A9_HUMAN |
Protein S100-A9 |
64 |
8 |
2.6303 |
2.06E-02 |
| P69905|HBA_HUMAN |
Hemoglobin subunit alpha |
64.8 |
10 |
5.5976 |
2.30E-03 |
| P18428|LBP_HUMAN |
Lipopolysaccharide-binding protein |
20.8 |
6 |
5.1523 |
1.39E-02 |
| P05109|S10A8_HUMAN |
Protein S100-A8 |
52.7 |
6 |
3.9446 |
9.80E-03 |
| P01009|A1AT_HUMAN |
Alpha-1-antitrypsin |
33.3 |
4 |
3.1915 |
4.20E-03 |
| P02647|APOA1_HUMAN |
Apolipoprotein A-I |
39.3 |
3 |
0.2355 |
3.58E-02 |
| P18065|IBP2_HUMAN |
Insulin-like growth factor-binding protein 2 |
16 |
3 |
13.6773 |
3.44E-02 |
| P14151|LYAM1_HUMAN |
Vascular cell adhesion protein 1 |
17.2 |
2 |
2.3988 |
3.27E-02 |
Table 1b. Proteins differentially expressed between the control (114) and post-chemotherapy groups (117).
| Accession No. |
Name |
% Cov |
Peptides (95%) |
116:117 |
PVal 116:117 |
| P04114|APOB_HUMAN |
Apolipoprotein B-100 OS |
47.8 |
361 |
0.9462 |
0.00E+00 |
| P0C0L5|CO4B_HUMAN |
Complement C4-B |
76.6 |
566 |
1.977 |
1.83E-02 |
| P08603|CFAH_HUMAN |
Complement factor H |
79.2 |
346 |
1.028 |
0.00E+00 |
| P01023|A2MG_HUMAN |
Alpha-2-macroglobulin |
68.1 |
153 |
1.028 |
0.00E+00 |
| P00450|CERU_HUMAN |
Ceruloplasmin |
72.4 |
353 |
1.0471 |
0.00E+00 |
| P00751|CFAB_HUMAN |
Complement factor B |
63.6 |
207 |
1.0186 |
0.00E+00 |
| P02751|FINC_HUMAN |
Fibronectin |
47.7 |
104 |
0.0466 |
0.00E+00 |
| Q14624|ITIH4_HUMAN |
Inter-alpha-trypsin inhibitor heavy chain H4 |
70.2 |
209 |
1.0093 |
3.80E-02 |
| P02790|HEMO_HUMAN |
Hemopexin |
89.2 |
416 |
1.0186 |
2.90E-03 |
| P00747|PLMN_HUMAN |
Plasminogen |
82.1 |
136 |
1.028 |
0.00E+00 |
| P01031|CO5_HUMAN |
Complement C5 |
49.7 |
102 |
2.1878 |
0.00E+00 |
| P00734|THRB_HUMAN |
Prothrombin |
71.9 |
159 |
1.0375 |
0.00E+00 |
| P02774|VTDB_HUMAN |
Vitamin D-binding protein |
81.4 |
130 |
1.028 |
0.00E+00 |
| P19823|ITIH2_HUMAN |
Inter-alpha-trypsin inhibitor heavy chain H2 |
49.7 |
171 |
4.9659 |
2.20E-03 |
| P43652|AFAM_HUMAN |
Afamin |
64.1 |
84 |
0.0809 |
0.00E+00 |
| P10643|CO7_HUMAN |
Complement component C7 |
60.7 |
85 |
0.3499 |
0.00E+00 |
| P13671|CO6_HUMAN |
Complement component C6 |
65.9 |
72 |
4.529 |
0.00E+00 |
| P06396|GELS_HUMAN |
Gelsolin |
58.4 |
101 |
1.0186 |
1.12E-02 |
| P02749|APOH_HUMAN |
Beta-2-glycoprotein 1 |
79.1 |
114 |
2.6792 |
1.39E-01 |
| P01008|ANT3_HUMAN |
Antithrombin-III |
72.2 |
66 |
7.379 |
0.00E+00 |
| P19827|ITIH1_HUMAN |
Inter-alpha-trypsin inhibitor heavy chain H1 |
59.5 |
114 |
8.5507 |
0.00E+00 |
| P01042|KNG1_HUMAN |
Kininogen-1 |
61.8 |
121 |
1.6144 |
2.20E-01 |
| P00736|C1R_HUMAN |
Complement C1r subcomponent |
71.5 |
79 |
3.0761 |
1.83E-02 |
| P07996|TSP1_HUMAN |
Thrombospondin-1 |
41.4 |
41 |
0.5702 |
4.23E-02 |
| P03952|KLKB1_HUMAN |
Plasma kallikrein |
57.1 |
46 |
4.7863 |
0.00E+00 |
| P05156|CFAI_HUMAN |
Complement factor I |
59.9 |
43 |
3.5975 |
0.00E+00 |
| P06681|CO2_HUMAN |
Complement C2 |
55.1 |
49 |
2.355 |
9.02E-02 |
| P09871|C1S_HUMAN |
Complement C1s subcomponent |
59.3 |
48 |
3.5975 |
2.00E-03 |
| P08123|CO1A2_HUMAN |
Collagen alpha-2(I) chain |
40.3 |
49 |
0.0119 |
1.60E-03 |
| P02748|CO9_HUMAN |
Complement component C9 |
61.9 |
41 |
1.8365 |
6.00E-03 |
| P26927|HGFL_HUMAN |
Hepatocyte growth factor-like protein |
57.5 |
27 |
1.8707 |
1.69E-01 |
| P35858|ALS_HUMAN |
Insulin-like growth factor-binding protein complex acid labile subunit |
51.2 |
50 |
6.1944 |
7.60E-03 |
| P25311|ZA2G_HUMAN |
Zinc-alpha-2-glycoprotein |
70.8 |
68 |
6.8549 |
1.12E-02 |
| P00738|HPT_HUMAN |
Haptoglobin |
74.6 |
36 |
1.5849 |
0.00E+00 |
| P02649|APOE_HUMAN |
Apolipoprotein E |
75.4 |
33 |
0.1191 |
0.00E+00 |
| P07357|CO8A_HUMAN |
Complement component C8 alpha chain |
57.7 |
35 |
2.0324 |
6.50E-03 |
| Q06033|ITIH3_HUMAN |
Inter-alpha-trypsin inhibitor heavy chain H3 |
48.7 |
41 |
0.6427 |
1.88E-02 |
| P02760|AMBP_HUMAN |
Protein AMBP |
78.4 |
65 |
2.5119 |
1.20E-03 |
| P05546|HEP2_HUMAN |
Heparin cofactor 2 |
52.9 |
47 |
6.368 |
1.00E-04 |
| P08697|A2AP_HUMAN |
Alpha-2-antiplasmin |
67.6 |
47 |
5.2481 |
1.73E-02 |
| P07358|CO8B_HUMAN |
Complement component C8 beta chain |
55.2 |
27 |
2.421 |
5.30E-03 |
| P04275|VWF_HUMAN |
von Willebrand factor |
19.6 |
21 |
0.2911 |
3.00E-04 |
| P01024|CO3_HUMAN |
Complement C3 |
28.1 |
27 |
0.3532 |
8.00E-04 |
| P04278|SHBG_HUMAN |
Sex hormone-binding globulin |
48.3 |
16 |
0.207 |
0.00E+00 |
| Q96KN2|CNDP1_HUMAN |
Beta-Ala-His dipeptidase |
43.4 |
17 |
5.6494 |
1.60E-03 |
| P68871|HBB_HUMAN |
Hemoglobin subunit beta |
89.8 |
23 |
3.8371 |
1.80E-03 |
| Q16610|ECM1_HUMAN |
Extracellular matrix protein 1 |
49.3 |
13 |
0.2512 |
1.00E-04 |
| P51884|LUM_HUMAN |
Lumican |
53 |
23 |
0.4529 |
4.42E-02 |
| P04003|C4BPA_HUMAN |
C4b-binding protein alpha chain |
45.4 |
14 |
1.6444 |
3.90E-03 |
| P02787|TRFE_HUMAN |
Serotransferrin |
34 |
10 |
3.6644 |
2.57E-02 |
| P63261|ACTG_HUMAN |
Actin, cytoplasmic 2 |
32.5 |
12 |
2.0512 |
3.19E-02 |
| P02775|CXCL7_HUMAN |
Platelet basic protein |
64.8 |
14 |
0.2312 |
2.63E-02 |
| P0C0L4|CO4A_HUMAN |
Complement C4-A |
76.6 |
543 |
3.4041 |
4.32E-02 |
| P02741|CRP_HUMAN |
C-reactive protein |
31.3 |
9 |
0.2188 |
4.29E-02 |
| P69905|HBA_HUMAN |
Hemoglobin subunit alpha |
64.8 |
10 |
4.0179 |
1.60E-03 |
| P01009|A1AT_HUMAN |
Alpha-1-antitrypsin |
33.3 |
4 |
0.5395 |
3.68E-02 |
| P02652|APOA2_HUMAN |
Apolipoprotein A-II |
57 |
5 |
0.5754 |
2.57E-02 |
Table 1c. Proteins differentially expressed between the pre-chemotherapy (116) and post-chemotherapy (117) groups.
Differential protein level associated with OS metastasis progression
In addition to the analysis above, protein differences were mapped according to progression of the disease to the metastatic cancer (Figure 2). The lists of differences are based on comparisons between the controls versus pre-chemotherapy group; control versus post-chemotherapy group and pre-chemotherapy versus post-chemotherapy groups. From the list, a number of proteins were seen to be differentially expressed at certain stages. For instance, individual proteins such as C-reactive protein, alpha- 2-macroglobulin, vascular adhesion molecule-1 (VCAM-1) and gelsolin were evidently showed a significant differential expression at different stages.
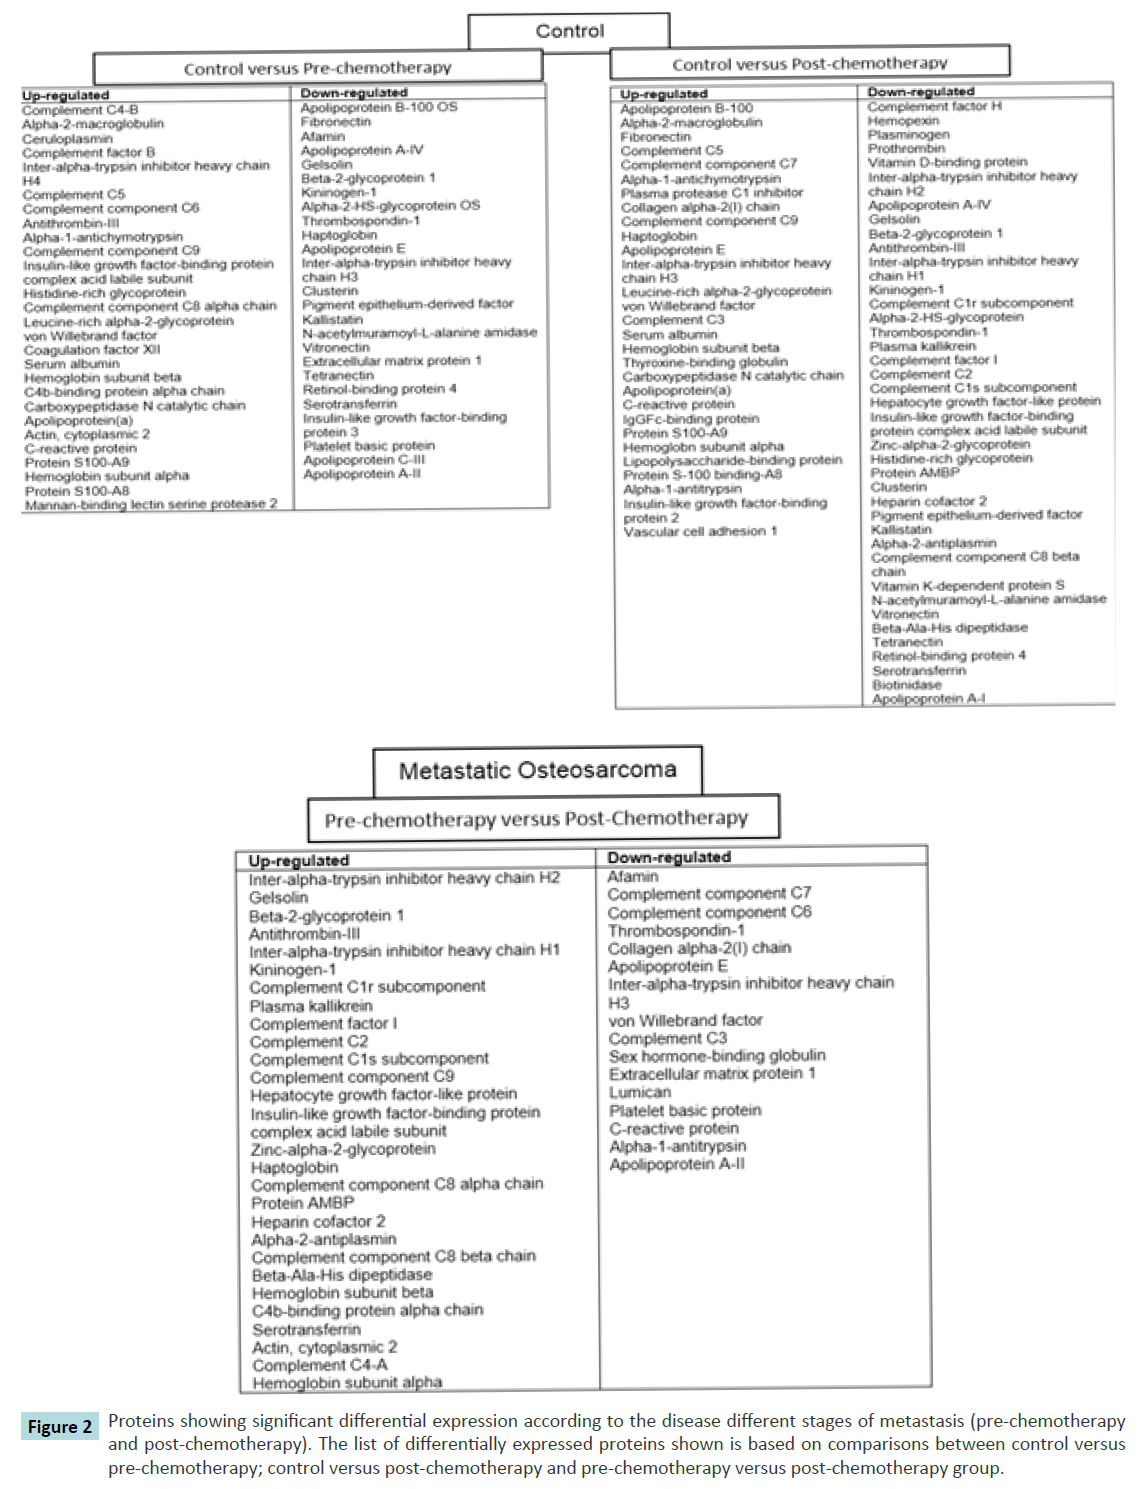
Figure 2 Proteins showing significant differential expression according to the disease different stages of metastasis (pre-chemotherapy and post-chemotherapy). The list of differentially expressed proteins shown is based on comparisons between control versus pre-chemotherapy; control versus post-chemotherapy and pre-chemotherapy versus post-chemotherapy group.
Protein-protein interaction
Protein-protein interaction network was analysed by String software (version 9). In this work we have analysed the interaction of protein in response to chemotherapy. Therefore, we have used the list of post-chemotherapy proteins differential expression in relative to control that we have identified earlier as reference. From the analysis we have shown 12 proteins were involved in the protein-protein interaction out of 69 proteins identified earlier (Figure 3).
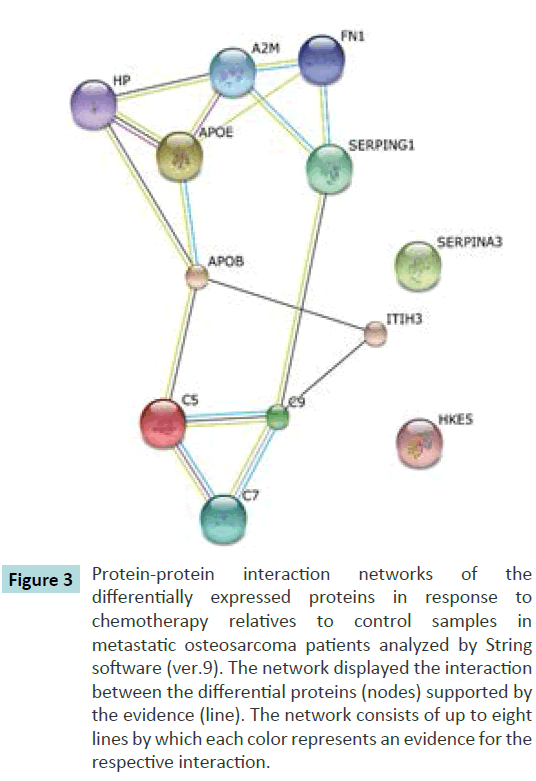
Figure 3 Protein-protein interaction networks of the differentially expressed proteins in response to chemotherapy relatives to control samples in metastatic osteosarcoma patients analyzed by String software (ver.9). The network displayed the interaction between the differential proteins (nodes) supported by the evidence (line). The network consists of up to eight lines by which each color represents an evidence for the respective interaction.
Immunohistochemistry
According to the above bioinformatics analysis, we have selected VCAM-1 to further verify the result obtained using immunohistochemistry assessment to the OS tissue biopsy of the patients. The relative positive signal at post-chemotherapy is much more that in the pre-chemotherapy samples (Figure 4). This assessment reveals good correlation between VCAM-1 staining and the proteome expression profiles.
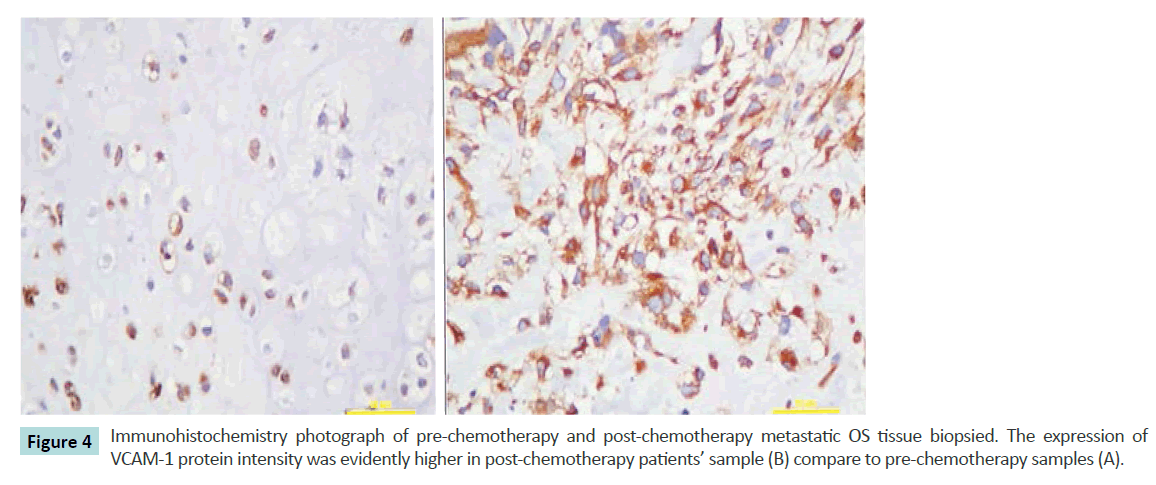
Figure 4 Immunohistochemistry photograph of pre-chemotherapy and post-chemotherapy metastatic OS tissue biopsied. The expression of VCAM-1 protein intensity was evidently higher in post-chemotherapy patients’ sample (B) compare to pre-chemotherapy samples (A).
Discussion
This study is conducted with the aims to identify potentially useful serum biomarkers for metastatic osteosarcoma. We have successfully profiled pooled serum samples from a carefully selected group of patients representing the stages of osteosarcoma (OS) cancer progression using a 4-plex iTRAQ approach. Following the GO annotations of the 217proteins identified and quantified, majority of these proteins were found to be classified in diverse biological processes such as cellular component organization or biogenesis (39.2%), cellular process (66.7%), biological regulation (24.2%) and localization (18.2%). Regarding the differentially expressed proteins, some of these have previously been reported as candidate for biomarkers in many other cancers such as alpha- 2-macroglobulin (prostate cancer) [14], ceruloplasmin (ovarian cancer) [15] and C-reactive protein (bone cancer) [16] which provides confidence to our dataset and provides an independent confirmation of these candidates.
In comparison between normal sera and pre-chemotherapy of the metastatic OS samples, total of 52 proteins have been shown to be altered. One of the proteins that have shown to be significantly elevated is C-reactive protein (CRP). CRP is an acute phase reactant (APR) protein produced by the liver in response to inflammation. Elevation of CRP has been reported previously in patients with bone metastatic prostate cancer, and has been associated with an adverse outcome for men with castration resistant prostate cancer [17]. This suggested that our finding is in consistent to the previous findings on the relation of CRP in metastatic progression of a cancer. In addition to CRP, many other APR protein family proteins have been seen to be altered in this data set including alpha-2-macroglobulin, ceruloplasmin, haptoglobin, and alpha- 1-antichymotrypsin. Although alteration of these proteins is not surprising as it is well documented that the presence of a tumour activates an inflammatory response, but the possibility of these APR proteins could have been secreted ‘ectopically’ by the tumour cells is plausible. For examples, previous studies have reported that common plasma proteins; albumin, prealbumin, alpha-1- antitrypsin, ceruloplasmin, alpha-2-macroglobulin, haptoglobin, transferrin and alpha-1-antichymotrypsin have been secreted in renal cell carcinoma, squamous cell carcinoma and breast cancer cell lines [18,19]. The potential of assessing APR proteins as cancer biomarkers could aid in diagnosis and staging and further identify the metastatic OS in the patients. Elevated serum CRP has been shown in patients with poor OS disease survival16.
Another study has also supported that elevated serum CRP has higher correlation with patients with high grade OS survival [20].
Comparison between post-chemotherapy groups with the control group showed further significant elevation of the CRP. This further supported our suggestion on the possibility of assaying the APR protein secreted by the tumour cells to aid at least in the prognosis of the OS patients in determining the stages or identifying the metastatic disease itself. Another protein that was shown to have been remarkably altered is gelsolin. Gelsolin is an actin-binding protein which is key regulator of actin filament assembly and disassembly [21]. Previous studies have shown that gelsolin is being down-regulated in OS patients [22,23]. This is in consistent with our findings in which, gelsolin has been shown to be down-regulated in patients with the OS patients before chemotherapy and further reduction of the protein expression after chemotherapy. However, the comparison between prechemotherapy and post-chemotherapy group shows an increase of gelsolin expression. We believed that this protein could play a role in the irresponsiveness towards the chemotherapy of the metastatic tumour cells. Vascular adhesion molecule-1 (VCAM-1) has shown a similar pattern in their expression even though the elevation in comparison between pre-chemotherapy and post-chemotherapy is not significant.
To support our hypothesis, we have carried out immunohistochemistry assessment on VCAM-1. Our data has shown increased in the expression of VCAM-1 in postchemotherapy groups when compared with the prechemotherapy patients in metastatic OS patients. Our study represents one of the first steps in development of biomarkers for OS metastatic patients. To our knowledge, our study is the first to use the iTRAQ approach in identifying leads for potential biomarkers of metastatic OS using patients’ serum. The panel of proteins identified in this study, together with the APR proteins from the patients’ serum could be benefited future biomarker identification specific for the metastatic OS disease by further fractionation and strategies. However, these proteins warrant further validation and investigation.
In conclusion, we have successfully profile the proteins of the metastatic OS patients’ serum using the iTRAQ labelling and LCMS separation. Many common biological processes proteins have been identified with several significant differentially expressed proteins detected. Amongst the potential biomarker candidate proteins identified are CRP. Our findings could also provide a clue on understanding the tumour progression as we have also identified proteins (gelsolin and VCAM-1) that may play a role in responsiveness to the chemotherapy.
Acknowledgement
This project was funded by Ministry of Higher Education Malaysia (RAGS/2012/UITM/SKK01/6).
References
- Luu HH, Kang Q, Park JK, Si W, Luo Q, et al. (2005) Anorthotopic model of human osteosarcoma growth and spontaneous pulmonary metastasis. Clinical and Experimental Metastasis 22: 319-329.
- Ferguson WS, GoorinAM (2001) Current treatment of osteosarcoma. Cancer Invest 19: 292-315.
- Gorlick R, Anderson P, Andrulis I, Arndt C, Beardsley GP, et al. (2003) Biology of childhood osteogenic sarcoma and potential targets for therapeutic development: meeting summary. Clin Cancer Res 9: 5442-5453.
- Ward WG, Mikaelian K, Dorey F, Mirra JM, Sassoon A, et al. (1994) Pulmonary metastases of stage IIB extremity osteosarcoma and subsequent pulmonary metastases. J ClinOncol 12: 1849-1858.
- Anderson NL, Anderson NG (2002) The human plasma proteome: history, character, and diagnostic prospects. Mol Cell Proteomics 1: 845-867.
- Qian WJ, Kaleta DT, Petritis BO, Jiang H, Liu T, et al. (2008) Enhanced detection of low abundance human plasma proteins using a tandem IgY12-SuperMix immunoaffinity separation strategy. Mol Cell Proteomics 7: 1963-1973.
- Liu T, Qian WJ, Mottaz HM, Gritsenko MA, Norbeck AD, et al. (2006) Evaluation of multiproteinimmunoaffinity subtraction for plasma proteomics and candidate biomarker discovery using mass spectrometry. Mol Cell Proteomics 5: 2167-2174.
- Glen A, Evans CA, Gan CS, Cross SS, Hamdy FC, et al. (2010) Eight-plexiTRAQ analysis of variant metastatic human prostate cancer cells identifies candidate biomarkers of progression: An exploratory study. Prostate 70: 1313-1332.
- Glen A, Gan CS, Hamdy FC, Eaton CL, Cross SS, et al. (2008) iTRAQ-facilitated proteomic analysis of human prostate cancer cells identifies proteins associated with progression. J Proteome Res 7: 897-907.
- Keshamouni VG, Michailidis G, Grasso CS, Anthwal S, Strahler JR, et al. (2006) Differential protein expression profiling by iTRAQ-2DLC-MS/MS of lung cancer cells undergoing epithelial-mesenchymal transition reveals a migratory/invasive phenotype. J Proteome Res 5: 1143-1154.
- Boylan KL, Andersen JD, Anderson LB, Higgins L, Skubitz AP (2010) Quantitative proteomic analysis by iTRAQ(R) for the identification of candidate biomarkers in ovarian cancer serum. Proteome Sci8: 31.
- Thomas PD, Kejariwal A, Campbell MJ, Mi H, Diemer K, et al. (2003) PANTHER: a browsable database of gene products organized by biological function, using curated protein family and subfamily classification. Nucleic Acids Res 31: 334-341.
- Noirel J, Evans C, Salim M, Mukherjee J, Ow SY, et al. (2011) Methods in Quantitative Proteomics: Setting iTRAQ on the Right Track. Current Proteomics 8: 17-30.
- Burgess EF, Haman AJL, Pietenpol JA (2008)Prostate cancer serum biomarker discovery through proteomic analysis of alpha-2 macroglobulin protein complexes. PROTEOMICS - Clinical Applications 2: 1223-1233.
- Lee CM, Lo HW, Shao RP, Wang SC, Xia W, et al. (2004) Selective Activation of Ceruloplasmin Promoter in Ovarian Tumors Potential Use for Gene Therapy Cancer Res 64: 1788.
- Nakamura T, Grimer RJ, Gaston CL, Watanuki M, Sudo A, et al. (2013) The prognostic value of the serum level of C-reactive protein for the survival of the patients with a primary sarcoma bone. Bone Joint J 95-B:411-418.
- Prins RC, Rademacher BL, Mongoue-Tchokote S, Alumkal JJ, Graff JN, et al. (2012) C-reactive protein as an adverse prognostic marker for men with castration-resistant prostate cancer (CRPC): Confirmatory results. UrolOncol 30: 33-37.
- Yoshimura S, Tamaoki N, Ueyama Y, Hata J (1978) Plasma protein production by human tumorsxenotransplanted in nude mice. Cancer Res 38: 3474-3478.
- Mbeunkui F, Metge BJ, Shevde LA, Pannell LK (2007) Identification of differentially secreted biomarkers using LC-MS/MS in isogenic cell line representing a progression of breast cancer. J Proteome Res 6: 2993-3002.
- Funovics PT, Edelhauser G, Funovics MA, Laux C, Berzaczy D, et al. (2011) Pre-operative serum C-reactive protein as independent prognostic factor for survival but not infection in patients with high-grade osteosarcoma. IntOrthop 35:1529-1536.
- Sun HQ, Yamamoto M, Mejillano M, Yin HL (1999) Gelsolin, a Multifunctional Actin regulatory protein. J BiolChem 274: 33179-33182.
- Jin S, Shen JN, Peng JQ, Wang J, Huang G, et al. (2012) Decreased expression of serum gelsolin in patients with osteosarcoma. Chin Med J 125:262-269.
- Shen JN, Jin S, Wang J, Huang G, Yin JQ, et al. (2008) Detection of serum biomakers of osteosarcoma by proteomic profiling. Chinese Journal of Oncology 30:519-522.